Creating a monthly expense report in Google Sheets is a great way to keep track of your spending habits, budget more efficiently, and ensure financial discipline. In this tutorial, we will walk you through the entire process, including the essential Google Sheets formulas that can help you analyze your expenses and make informed financial decisions.
Setting Up Your Google Sheets Expense Report
The first step in creating an effective expense report is setting up your Google Sheets document. Follow these simple steps to start:
Open Google Sheets: Navigate to Google Sheets and create a new blank spreadsheet.
Label Your Columns: Create headers in your first row for the categories you’ll be tracking. For example:
- Date: When the expense occurred.
- Category: What type of expense it was (e.g., Food, Transportation, Utilities).
- Description: A brief note about the expense (optional but useful).
- Amount: The amount spent on the expense.
Enter Data: Begin inputting your data row by row. Each new expense gets a new row, including the date, category, description, and amount.
This organization will give you a clear view of your expenses, and you can easily modify it later for more categories or detailed reports.
Organizing Your Data
Once you’ve set up the basic structure, the next step is to organize the data effectively. Organization is key to making sure your expense report is both useful and easy to interpret.
Use Data Validation for Categories
To avoid mistakes in categorizing your expenses, you can use Data Validation. This feature allows you to create a dropdown list for categories so that every time you input an expense, you can select from predefined options.
- Select the Category column (e.g., column B).
- Go to Data > Data validation.
- Under Criteria, select List of items and enter the categories separated by commas, like:
Food, Transportation, Utilities, Entertainment, etc.
- Click Save. Now you have a dropdown list for easy categorization of your expenses.
Sort Expenses by Date
To analyze your data more easily, sorting your expenses by date is important. This will allow you to view trends over time and simplify analysis for specific periods.
- Highlight the rows containing your data (excluding the header row).
- Go to Data > Sort range.
- Choose Sort by Date and select either Ascending or Descending, depending on your preference.
This simple organization will help you focus on what matters—tracking your expenses effectively.
Using Key Google Sheets Formulas
Formulas are essential for calculating and summarizing your data. Below, we will go over the most useful formulas for creating an efficient monthly expense report.
SUM Formula
The SUM formula is essential for calculating the total amount spent in a given category or month.
To calculate the total expenses:
=SUM(D2:D100)
This will sum all the values in the Amount column (assuming that column D contains the amount spent).
- To calculate the total for a specific category:
=SUMIF(B2:B100, "Food", D2:D100)
This will add up all expenses in the Food category.
AVERAGE Formula
To better understand your average spending patterns, the AVERAGE formula can be quite helpful. For instance:
- To calculate the average expense:
=AVERAGE(D2:D100)
This will give you the average amount spent across all your recorded expenses.
IF Formula
The IF formula allows you to make conditional calculations, which can be helpful for flagging high expenses.
- To flag high expenses:
=IF(D2>100, "High Expense", "Normal Expense")
This formula will check if an expense in column D is greater than 100 and label it as “High Expense” if true.
SUMIFS Formula
The SUMIFS formula is an advanced version of SUMIF and allows you to sum values based on multiple criteria.
- To sum expenses for a specific category within a specific month:
=SUMIFS(D2:D100, B2:B100, "Food", A2:A100, ">=01/01/2024", A2:A100, "<=01/31/2024")
This will calculate the total amount spent on Food in January 2024.
COUNTIF Formula
The COUNTIF formula is useful for counting the number of occurrences of a particular category or condition.
- To count how many times a category appears:
=COUNTIF(B2:B100, "Food")
This will count how many Food expenses are listed.
Creating a Summary Section
A summary section is a powerful way to analyze the data at a glance. Here’s how to create one:
Total Expenses
To show the total expenses for the month, use the SUM formula at the top of your sheet or in a separate section:
=SUM(D2:D100)
Category Breakdown
You can also create a breakdown of expenses by category using the SUMIF formula:
=SUMIF(B2:B100, "Food", D2:D100)
Repeat this for each category, and you’ll have a neat summary of your expenses by type.
Yearly or Monthly Comparison
To compare expenses from different months, you can use the SUMIFS formula by specifying the desired month or year. This allows you to track progress and spot trends:
=SUMIFS(D2:D100, A2:A100, ">=01/01/2024", A2:A100, "<=01/31/2024")
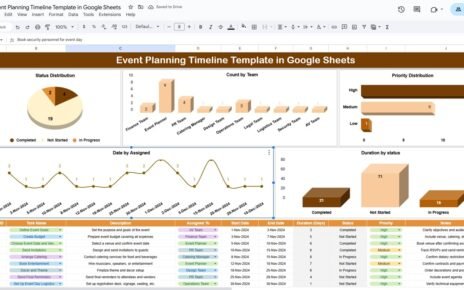
Visualizing Your Expenses with Charts
A great way to visualize your expenses is by using Google Sheets’ charting options. Follow these steps to create charts for your monthly report:
Create a Pie Chart for Category Breakdown
- Highlight the data you want to visualize (e.g., category and total amounts).
- Go to Insert > Chart.
- In the Chart Editor, select Pie Chart.
- Customize the chart to make it visually appealing by adjusting colors and labels.
Create a Line or Bar Chart for Monthly Expenses
To track your spending over time, a line or bar chart works well. You can track monthly expenses by organizing your data by month and using a line chart to visualize trends.
- Organize the data with months in one column and total expenses in another.
- Select the data and go to Insert > Chart.
- Choose a Line Chart or Bar Chart from the Chart Editor.
Advanced Tips and Tricks
- Use Conditional Formatting to Highlight High Expenses
Conditional formatting helps draw attention to high expenses.
- Select the Amount column.
- Go to Format > Conditional formatting.
- Set the rule to Greater than and enter a value (e.g., 100).
- Choose a color to highlight the high expenses.
Use Pivot Tables for In-Depth Analysis
Pivot tables are a powerful tool for summarizing data. They allow you to organize your expenses by category, month, or other criteria with just a few clicks.
- Select your data.
- Go to Data > Pivot table.
- Drag and drop fields (like Category and Amount) into the pivot table to summarize the data in meaningful ways.
Conclusion
Creating a monthly expense report in Google Sheets is a great way to manage your finances and stay on top of your spending. By following the steps outlined in this tutorial, you can set up a report that not only tracks your expenses but also provides insights into where your money is going.
Visit our YouTube channel to learn step-by-step video tutorials
Youtube.com/@NeotechNavigators