In today’s highly competitive global market, businesses engaged in international trade need accurate and real-time insights to track performance, mitigate risks, and ensure sustainable growth. But manually managing trade data can quickly become overwhelming and inefficient.
That’s where the International Trade KPI Dashboard in Google Sheets proves invaluable. This easy-to-use, highly customizable template helps trade analysts, supply chain teams, and logistics managers monitor performance with key indicators, all from a centralized digital space.International Trade KPI Dashboard in Google Sheets
Let’s explore the full capabilities of this dashboard and how it can empower better decision-making across your trading operations.International Trade KPI Dashboard in Google Sheets
What is the International Trade KPI Dashboard in Google Sheets?
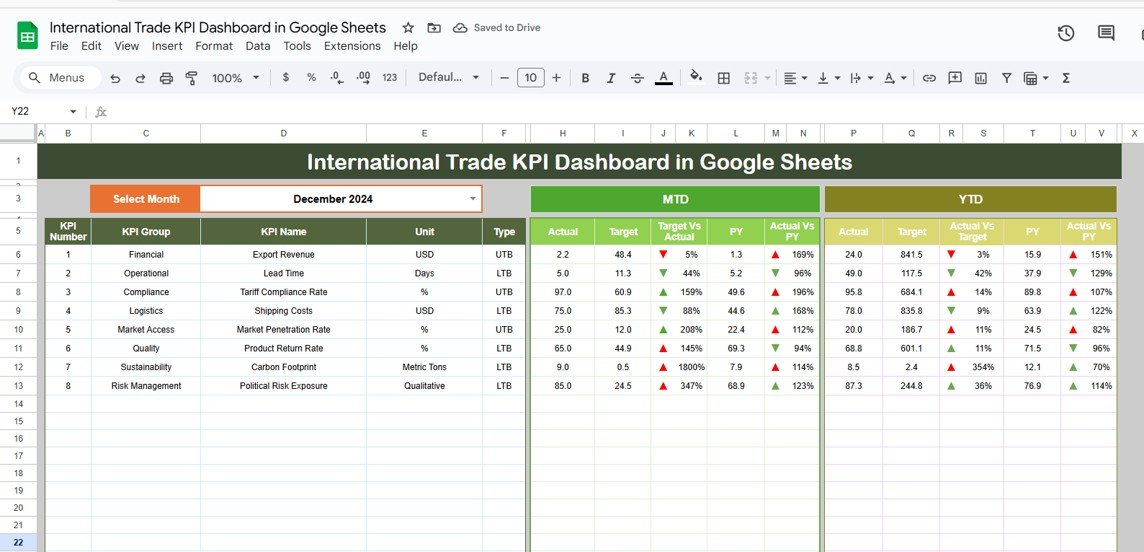
The International Trade KPI Dashboard is a comprehensive Google Sheets template designed to track and evaluate key performance indicators related to imports, exports, shipping, customs, vendor management, trade efficiency, and cost optimization.
With its interactive features and well-defined structure, it allows teams to analyze both MTD (Month-To-Date) and YTD (Year-To-Date) performance with comparisons to targets and previous years.International Trade KPI Dashboard in Google Sheets
Key Features of the Dashboard
This dashboard is spread across 6 key worksheet tabs, each playing a specific role in performance tracking:
1. Dashboard Sheet Tab
This is the main dashboard view where all KPIs are visualized. On cell D3, users can select a specific month from a dropdown. Once selected, the entire dashboard updates dynamically with visuals and metrics.International Trade KPI Dashboard in Google Sheets
Displayed KPI Data Includes:
-
MTD Actual, Target, and Previous Year
-
YTD Actual, Target, and Previous Year
-
Conditional formatting using up/down arrows for trend comparison
-
Automatic calculations and visual cues
Click to buy International Trade KPI Dashboard in Google Sheets
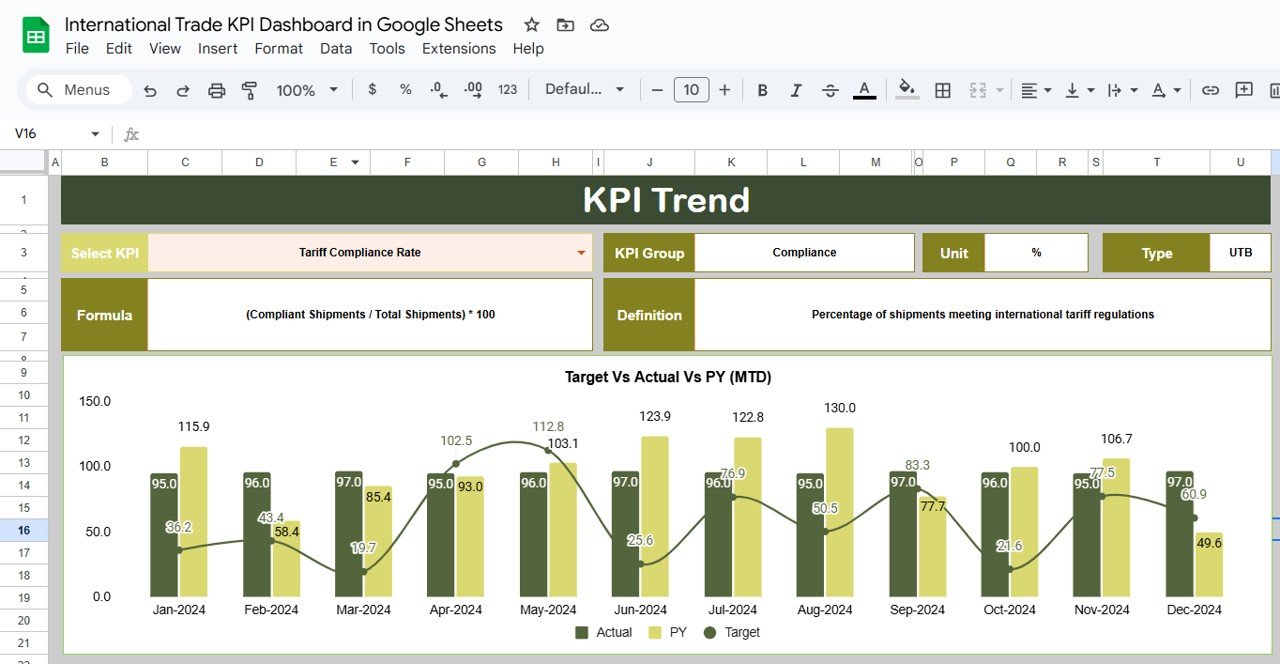
2. KPI Trend Sheet Tab
This tab lets you deep-dive into trends for any selected KPI using a dropdown filter in cell C3.
This page displays:
-
KPI Group
-
Unit of Measurement
-
Type of KPI (Lower The Better or Upper The Better)
-
Aggregation Formula
-
Brief Definition
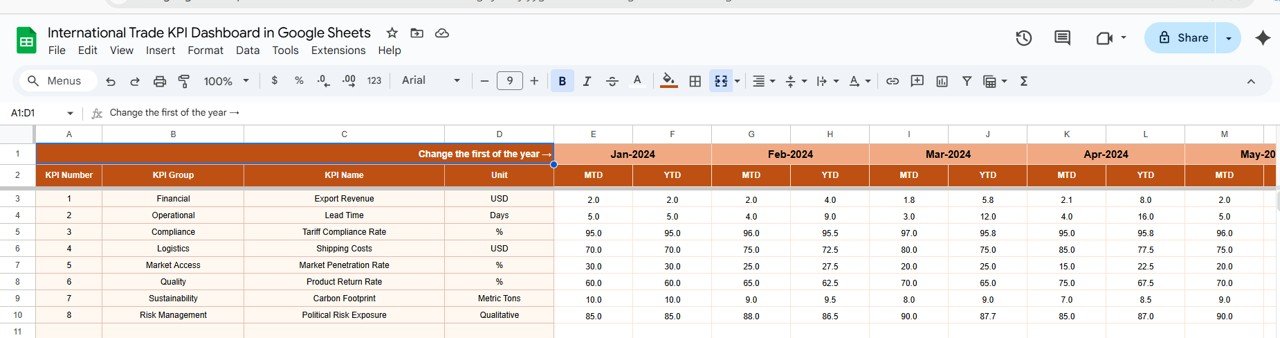
3. Actual Number Sheet Tab
This is where users input the actual performance numbers for MTD and YTD.
-
Select the initial month of the year in cell E1
-
Enter monthly data per KPI row
-
Automatically connects to the Dashboard
Click to buy International Trade KPI Dashboard in Google Sheets
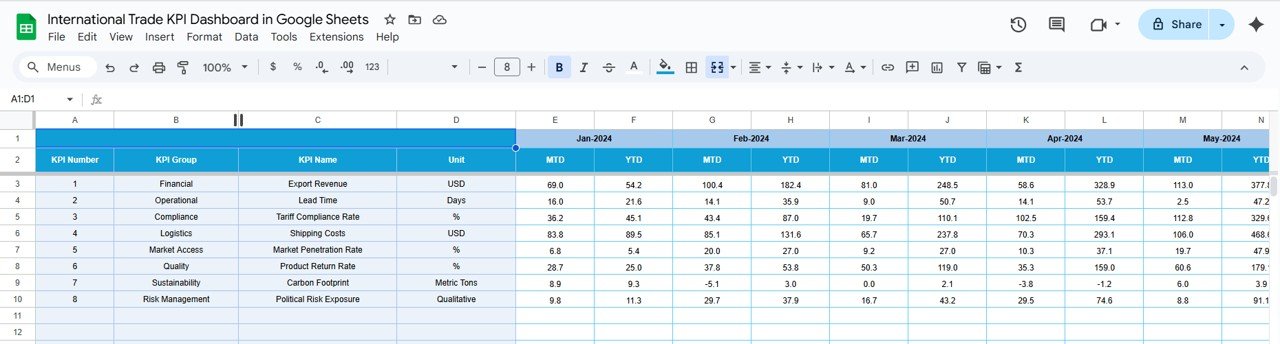
4. Target Sheet Tab
Enter the target values for each KPI:
-
Input MTD and YTD target numbers
-
These values appear on the dashboard for comparison
-
Helps you identify gaps and set realistic goals
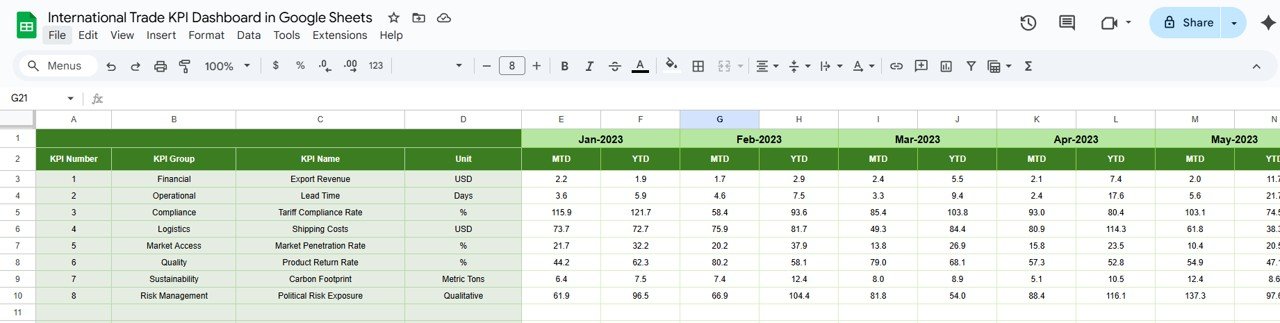
5. Previous Year Number Sheet Tab
Record the same KPIs from the previous year:
-
Tracks year-over-year growth
-
Highlights long-term trends
-
Supports strategic planning
Click to buy International Trade KPI Dashboard in Google Sheets
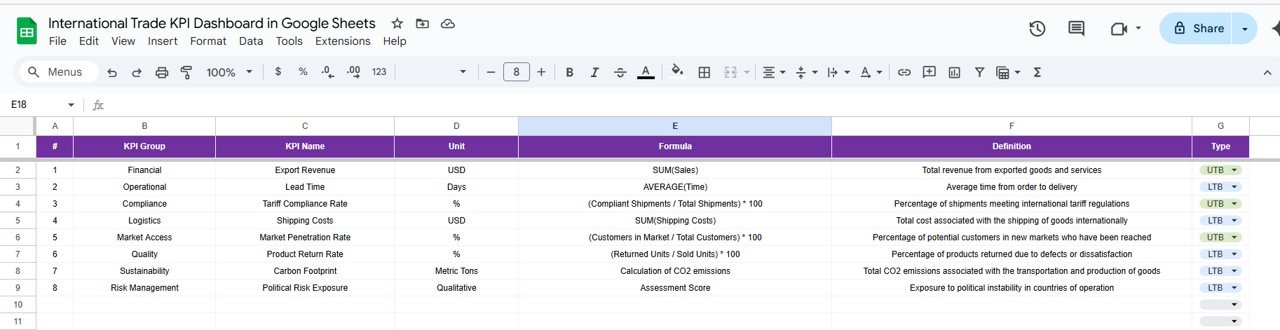
6. KPI Definition Sheet Tab
This is the foundation of the system where you define each KPI in detail:
-
KPI Name
-
KPI Group
-
Unit (e.g., USD, %, Days)
-
Formula to Aggregate
-
Definition
-
Type (UTB: Upper The Better or LTB: Lower The Better)
Advantages of the International Trade KPI Dashboard
-
Easy to Use: Built in Google Sheets with no coding required
-
Dynamic Insights: Interactive dashboard updates by selecting a month
-
Data Accuracy: Prevents errors through structured templates and dropdowns
-
Real-Time Monitoring: Tracks MTD, YTD, and year-over-year data
-
Improves Collaboration: Team members can access and update data simultaneously
-
Saves Time: Eliminates manual reporting tasks with automated summaries
-
Customizable: Add or remove KPIs as per your business requirements
Opportunities for Improvement
Click to buy International Trade KPI Dashboard in Google Sheets
-
Add automated alerts using Google Apps Script
-
Integrate with Google Data Studio for advanced visualization
-
Include vendor-wise analysis or shipment-level details
-
Add dynamic filters for regions, categories, or vendors
-
Implement data validation to prevent incorrect entries
-
Build a mobile-friendly version using Google Forms + Sheets
Best Practices for Using the Dashboard
-
Keep KPI definitions standardized across all users
-
Update data monthly to ensure accuracy
-
Use dropdowns for consistency in values (e.g., “Delivered”, “Pending”)
-
Regularly back up your sheet to avoid data loss
-
Visualize only essential KPIs on the main dashboard for clarity
-
Train team members on how to input data correctly
-
Validate target-setting strategies yearly based on past performance
Conclusion
Click to buy International Trade KPI Dashboard in Google Sheets
The International Trade KPI Dashboard in Google Sheets is a practical, cost-effective, and smart tool for organizations that want to gain visibility into their trading operations. With MTD and YTD performance tracking, goal comparisons, and trend visualizations, it provides a complete view of your trade efficiency.
Whether you manage exports, imports, or logistics, this dashboard can help you make smarter, faster, and more profitable decisions—without the need for expensive software or complex systems.International Trade KPI Dashboard in Google Sheets
Frequently Asked Questions (FAQs)
Q1. Can I use this dashboard for both imports and exports?
Yes. You can track export and import KPIs in separate rows or groups within the same sheet.
Q2. How can I customize the dashboard for my company’s region-specific trade?
You can add slicers or dropdown filters for countries, continents, or trade zones in the KPI Trend or Dashboard sheet.
Q3. Is Google Sheets powerful enough to handle thousands of rows of data?
For medium-scale use, yes. For enterprise-level volume, consider using Google BigQuery with Google Sheets integration.
Q4. Can I connect this with real-time data sources?
Yes, using Google Apps Script or external add-ons like Supermetrics or Sheetgo.
Q5. Is the dashboard compatible with mobile devices?
Google Sheets dashboards are accessible via mobile, but for optimal viewing, use a desktop or tablet.International Trade KPI Dashboard in Google Sheets
Visit our YouTube channel to learn step-by-step video tutorials
Youtube.com/@NeotechNavigators
Click to buy International Trade KPI Dashboard in Google Sheets