Managing issues effectively is a crucial part of any project’s success. To streamline this process, a Project Issue Tracker helps teams track and resolve issues in a structured way. In this article, we’ll show you how to create a fully-functional Project Issue Tracker in Google Sheets that is easy to use and can be customized for your needs. Whether you’re a project manager, team leader, or part of a development team, this guide will walk you through building a project issue tracker template with useful features, including charts, slicers, and detailed data tabs.
What is a Project Issue Tracker?
Click to buy Project Issue Tracker in Google Sheets
A Project Issue Tracker is a tool that helps you track problems, bugs, or challenges that occur during a project. It allows teams to record, prioritize, assign, and resolve issues. An effective tracker keeps the project on course by ensuring that every issue is accounted for and resolved promptly.
Google Sheets is a powerful tool for building such trackers because it offers cloud-based collaboration, easy integration with other tools, and customizable features. With just a few steps, you can create a dynamic Project Issue Tracker that provides real-time updates and clear insights into the status of each issue.
How to Create a Project Issue Tracker in Google Sheets
Follow these steps to create a simple yet effective Project Issue Tracker in Google Sheets.
Step 1: Set Up the Data Sheet
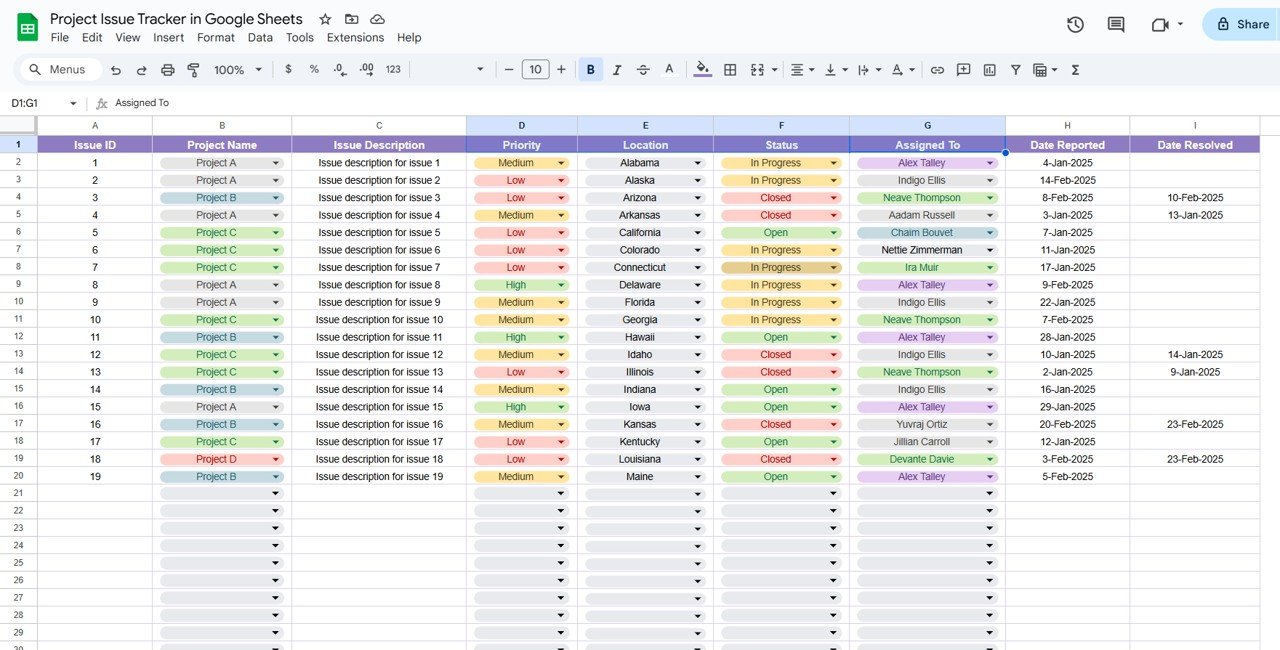
The data sheet is where you’ll input the raw information related to the issues. It contains essential details like the Issue ID, Project Name, Description, Priority, Location, Status, Assigned To, Date Reported, and Date Resolved.

Click to buy Project Issue Tracker in Google Sheets
Here’s an overview of the fields that will be included in the Data Sheet:
You can easily add more rows to this data sheet as your project progresses. The key is to ensure that every issue is documented properly for easy tracking.
Step 2: Create the Tracker Sheet Tab
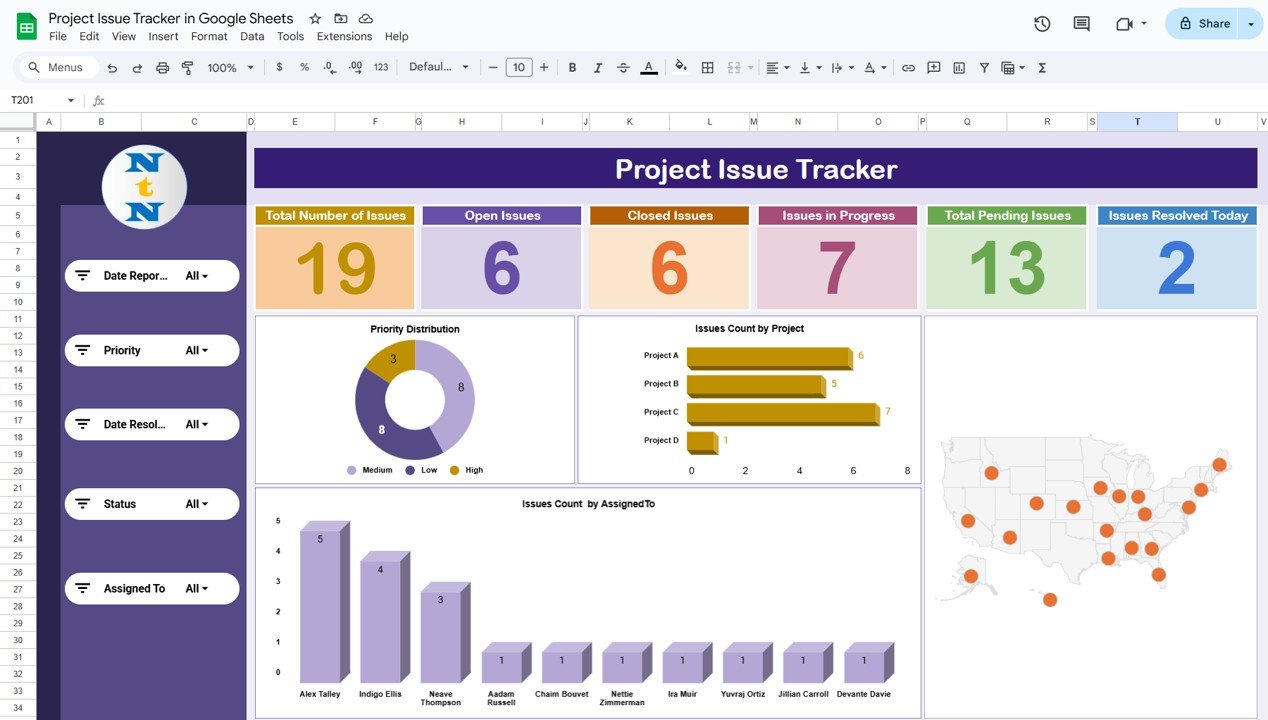
The Tracker Sheet displays dynamic charts, cards, and slicers to help you visualize and manage issues effectively. Let’s break down the components of this sheet:
Cards
Cards give you an overview of the status of issues in your project. They are essential for quickly seeing key metrics at a glance. Some important cards to include are:
- Total Number of Issues: Displays the total number of issues recorded in the project.
- Open Issues: Shows the count of open issues that need attention.
- Closed Issues: Displays the number of issues that have been resolved and closed.
- Issues in Progress: Shows how many issues are currently being worked on.
- Total Pending Issues: Displays issues that are waiting for resolution but are not yet in progress.
- Issues Resolved Today: Shows how many issues have been resolved on the current day.
Slicers
Slicers are interactive filters that allow you to segment and view data based on specific criteria. For a Project Issue Tracker, you can use the following slicers:
- Date Reported: Filter issues by the date they were reported.
- Priority: Filter by the priority level of the issue (High, Medium, Low).
- Location: View issues based on their geographical location.
- Status: Filter by the status of the issue (Open, Closed, In Progress).
- Assigned To: Filter issues based on the team member assigned to them.
Charts
Click to buy Project Issue Tracker in Google Sheets
Charts help visualize the data and make it easier to spot trends and patterns. Here are some useful charts to include in your tracker:
-
Priority Distribution (Donut Chart): A donut chart will show the distribution of issues based on priority, helping you quickly see which priority level has the most open issues.
-
Issues Count by Project (Bar Chart): A bar chart can display the number of issues by project. This is useful for comparing how many issues are reported for different projects.
-
Issues Count by Assigned To (Column Chart): A column chart helps visualize the distribution of issues among team members.
-
Map: States-wise: This map chart will give you a geographic view of where the issues are located. It’s especially useful for large teams working in different regions.

Click to buy Project Issue Tracker in Google Sheets
Advantages of Using a Project Issue Tracker in Google Sheets
- Easy Collaboration: Google Sheets allows for real-time collaboration, making it ideal for teams working remotely or in different time zones. Multiple team members can work on the tracker simultaneously, providing instant updates and feedback.
- Customizable and Flexible: Google Sheets offers flexibility in customization. You can adjust the tracker to meet the specific needs of your team or project by adding fields, creating different types of charts, and using slicers to filter data according to various criteria.
- Visual Representation of Data: With features like charts, cards, and slicers, your Project Issue Tracker will not only store data but also provide insightful visual representations of your project’s health. This makes it easy to analyze progress, identify bottlenecks, and prioritize critical issues.
- Easy to Share and Access: Google Sheets is cloud-based, so you can share the tracker with anyone in your team or project stakeholders. You don’t have to worry about sending files back and forth—simply share the link and manage permissions.
- Cost-Effective: Using Google Sheets is free (with a Google account), making it an affordable solution for small teams and larger organizations alike.
Best Practices for Project Issue Tracking
To make the most of your Project Issue Tracker, follow these best practices:
- Define Clear Categories for Issues: Be clear on the types of issues you’re tracking. Are they bugs, development challenges, or customer complaints? Categorizing issues helps make the tracker more organized and actionable.
- Prioritize Issues Effectively: Use the priority field to ensure that the most critical issues are resolved first. Assign high-priority issues to your best team members or focus efforts on resolving issues that are blocking other work.
- Update Regularly: For the tracker to be useful, it needs to be updated regularly. Encourage your team to input new issues and update the status of ongoing issues promptly.
- Leverage Slicers and Charts: Use slicers and charts to filter and visualize the data. These tools will help you focus on specific trends, such as which team members are overloaded with issues or whether high-priority issues are being resolved on time.
- Use Comments and Notes: Encourage your team to leave comments or notes on each issue. This allows for additional context that may be useful when reviewing the issue later on.
Opportunity to Improve in Project Issue Tracking
While the Project Issue Tracker in Google Sheets is a powerful tool, there are always opportunities for improvement. Here are some ideas for making the tracker even more effective:
- Automate Data Entry: One improvement you can implement is automating the data entry process. Use Google Sheets functions or integrations with other tools (such as Zapier) to automatically import data from emails, project management tools, or issue trackers like Jira.
- Add Conditional Formatting: Conditional formatting can help you quickly identify critical issues by color-coding them based on priority, status, or date. For example, high-priority issues could be highlighted in red to grab attention.
- Integrate with Project Management Tools: you’re using project management tools like Trello or Asana, consider integrating your issue tracker with them to automatically pull in issues and provide a more comprehensive view of the project.
- Create Automated Alerts: Set up email or Slack alerts for important changes, such as when an issue moves to “Resolved” or when a high-priority issue remains unresolved for too long.
Frequently Asked Questions (FAQs)
1. What Is the Best Way to Track Project Issues?
The best way to track project issues is by using a structured template that includes essential fields like issue ID, priority, location, status, and assigned team member. Google Sheets offers a flexible, customizable platform for creating such trackers.
2. How Can I Customize My Google Sheets Project Issue Tracker?
You can customize your tracker by adding new columns, creating slicers to filter by date or status, and integrating charts to visualize the data. Google Sheets is fully customizable based on your project’s needs.
3. Can I Automate Data Entry in My Project Issue Tracker?
Yes, you can automate data entry in your tracker by integrating Google Sheets with other tools like Zapier or using built-in functions to automatically import data.
4. How Can I Use Slicers in Google Sheets?
Slicers in Google Sheets allow you to filter and view your data based on specific criteria, such as priority, location, and assigned team member. To add slicers, go to “Data” > “Slicer” and select the criteria you wish to filter.
Conclusion
In this article, we’ve shown you how to create a Project Issue Tracker in Google Sheets that is easy to use, highly customizable, and offers valuable insights through visual tools like charts and slicers. By following the steps outlined, you can create a dynamic tracker that helps your team stay organized, resolve issues efficiently, and keep the project on track.
With continuous updates, regular use, and the addition of features like automation and integrations, your Project Issue Tracker will be an indispensable tool for managing issues and ensuring project success.
Visit our YouTube channel to learn step-by-step video tutorials
Youtube.com/@NeotechNavigators
Click to buy Project Issue Tracker in Google Sheets


