In the fast-paced world of retail, having a clear and effective way to monitor key performance indicators (KPIs) is crucial. A Retail KPI Dashboard in Google Sheets can provide insights into your store’s performance, helping you make data-driven decisions. This article will walk you through setting up a Retail KPI Dashboard in Google Sheets, detailing the KPIs to track, their units, formulas to aggregate, and the definitions. Additionally, we’ll explore best practices, opportunities for improvement, and answer some frequently asked questions.
What is a Retail KPI Dashboard?
A Retail KPI Dashboard is a tool used to monitor the performance of a retail business. It displays important KPIs (key performance indicators) in a single, easy-to-read layout, typically with graphs and tables to summarize key metrics. A dashboard helps managers, executives, and store owners track performance across different areas such as sales, customer service, inventory, and more.
The Retail KPI Dashboard in Google Sheets is an excellent choice because it’s accessible, customizable, and integrates well with other Google services.
Click to buy Retail KPI Dashboard in Google Sheets
Key Features of the Retail KPI Dashboard in Google Sheets
This Retail KPI Dashboard includes several features that make it a powerful tool for tracking performance. Below are the six main worksheets included in the dashboard:
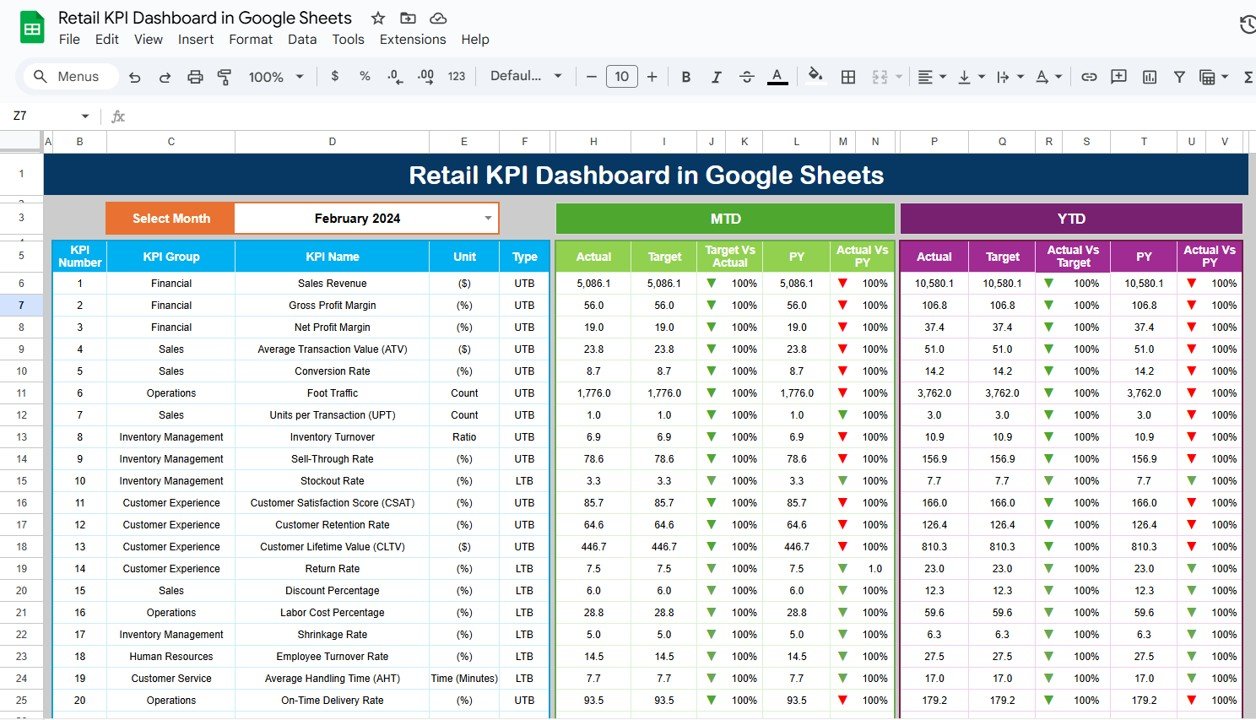
1. Dashboard Sheet Tab
The Dashboard Sheet is the main tab of the KPI dashboard. It displays all the key metrics you need to track, including:
- MTD (Month-to-Date) Actuals: Shows the actual values for the current month.
- Target: Displays the target for each KPI.
- Previous Year (PY): Shows the same data from the previous year for comparison.
- Target vs. Actual: This compares the target values with the actual numbers, highlighting the differences.
- PY vs. Actual: This compares the current year’s actual numbers with the previous year’s, helping you gauge growth or decline.
The dashboard also includes conditional formatting, with up and down arrows indicating whether the performance is above or below expectations.
Click to buy Retail KPI Dashboard in Google Sheets
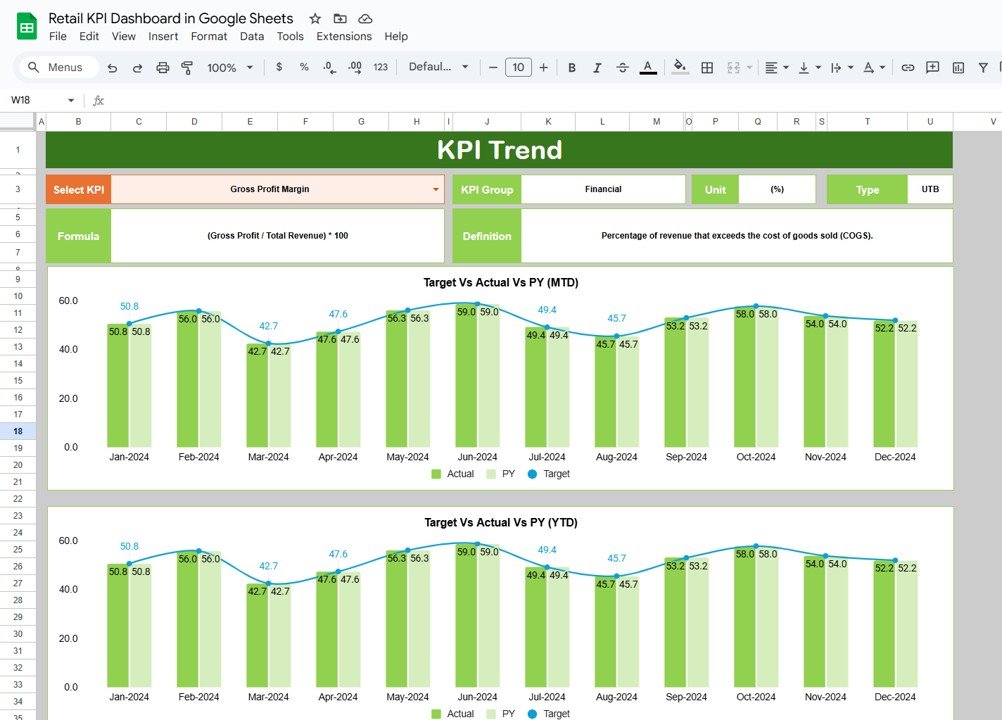
2. KPI Trend Sheet Tab
In this tab, you can select specific KPIs from a dropdown menu.
Key details displayed here include:
- KPI Group: The category of the KPI (e.g., sales, customer satisfaction).
- Unit of KPI: The measurement unit for the KPI (e.g., dollars, percentage).
- KPI Type: Whether the KPI is “Lower the Better” or “Upper the Better”.
- Formula: The formula used to calculate the KPI.
- Definition: A detailed explanation of what the KPI measures.
Click to buy Retail KPI Dashboard in Google Sheets
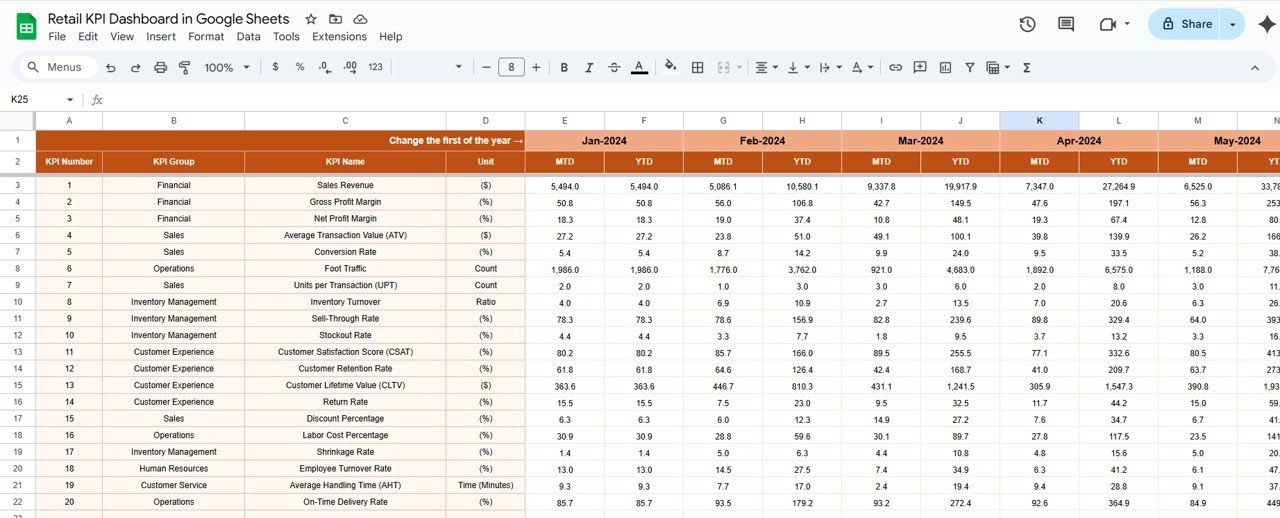
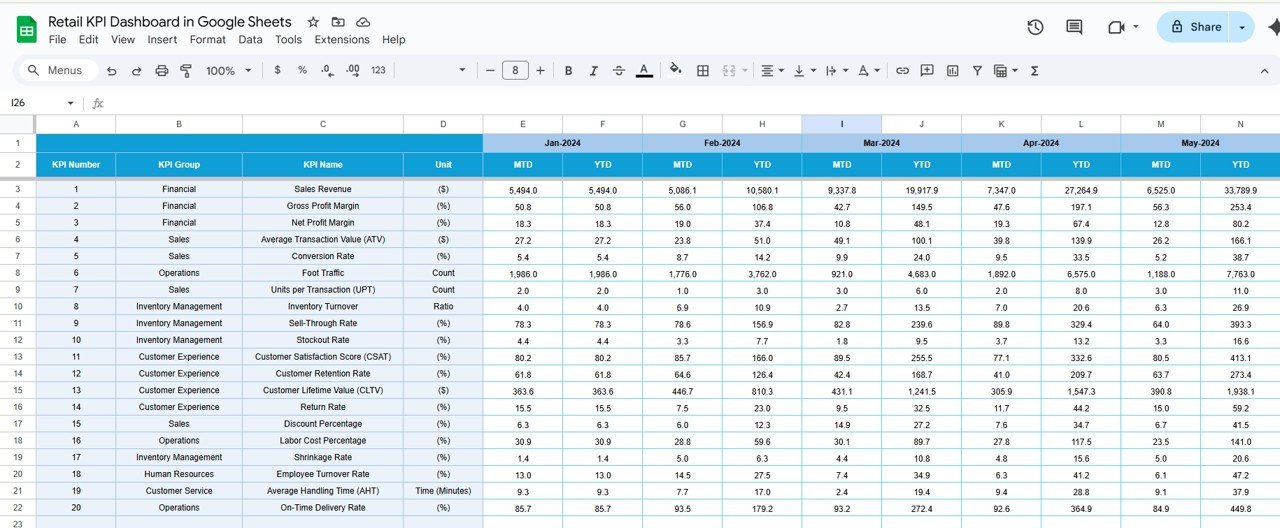
3. Actual Numbers Sheet Tab
-
Here, you can enter the actual numbers for the MTD and YTD for a specific month.
-
This tab allows you to change the month and see how the numbers fluctuate.
Click to buy Retail KPI Dashboard in Google Sheets
4. Target Sheet Tab
-
This sheet allows you to input target numbers for each KPI, both for MTD and YTD.
-
You can adjust the targets monthly based on performance goals.
Click to buy Retail KPI Dashboard in Google Sheets
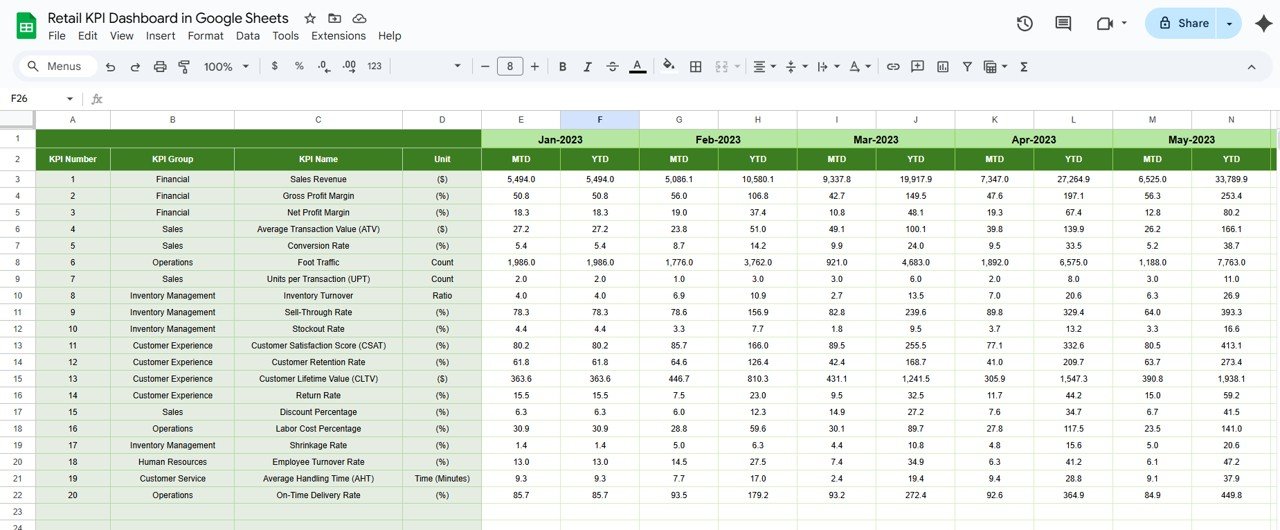
5. Previous Year Number Sheet Tab
-
This tab lets you input the previous year’s data, which helps in comparing year-over-year performance.
Click to buy Retail KPI Dashboard in Google Sheets
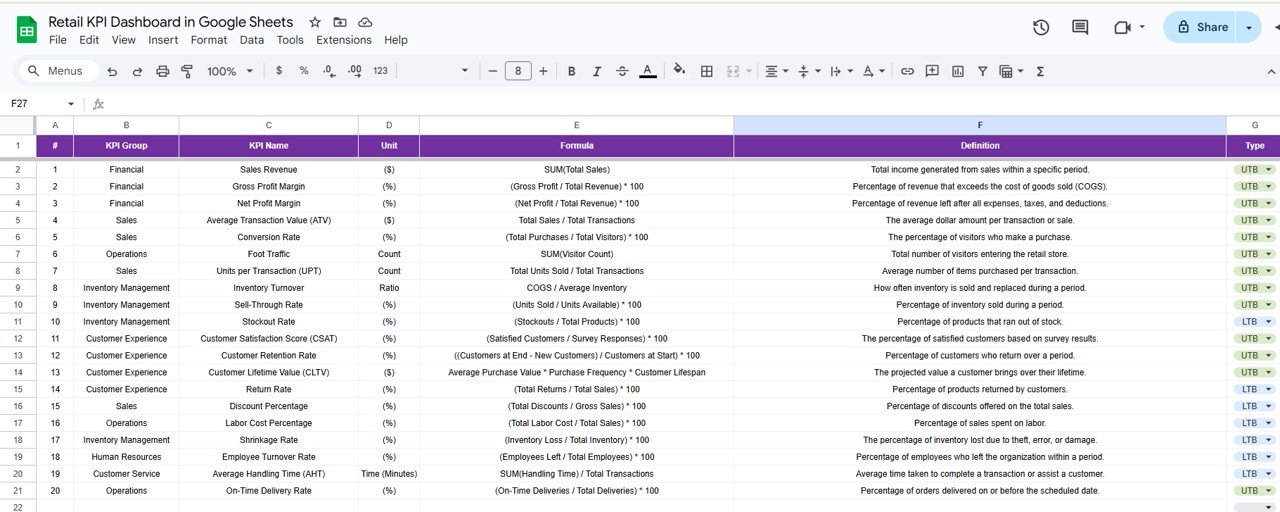
6. KPI Definition Sheet Tab
-
This sheet contains definitions for each KPI, making it easier for everyone to understand what each metric means.
-
You will enter the KPI name, KPI group, unit, formula, and definition for every KPI tracked in the dashboard.
Click to buy Retail KPI Dashboard in Google Sheets
Advantages of Using a Retail KPI Dashboard in Google Sheets
-
Centralized Data: All important KPIs are accessible in one central location, making it easier for managers to track and analyze performance.
-
Customization: Google Sheets allows full customization. You can adjust the dashboard to suit your specific business needs.
-
Collaboration: Google Sheets makes it easy for teams to collaborate. Multiple people can access and update the dashboard in real time.
-
Cost-Effective: Unlike many expensive retail management systems, Google Sheets is free and accessible to anyone with a Google account.
-
Data Visualization: The use of charts and conditional formatting enhances the visual appeal and clarity of the data, making it easier to understand.
-
Scalability: As your retail business grows, you can expand the dashboard to track more KPIs and incorporate additional features.
Opportunity for Improvement in the Retail KPI Dashboard
While the Retail KPI Dashboard in Google Sheets is powerful, there are always opportunities for improvement:
-
Integration with External Data: The dashboard can be enhanced by integrating it with external data sources, such as POS (Point of Sale) systems, to automate the data entry process.
-
Advanced Analytics: Implementing more complex formulas, like forecasting models or trend analysis, can provide deeper insights into future performance.
-
Mobile Accessibility: Although Google Sheets is already mobile-friendly, further optimizing the dashboard for smaller screens can make it easier for retail managers to access KPIs on-the-go.
-
Automation: Automating data input through Google Apps Script or integration with other tools like Google Analytics can reduce manual work and enhance data accuracy.
-
User Training: Ensuring all users understand the KPIs and their importance can improve the overall effectiveness of the dashboard.
Best Practices for the Retail KPI Dashboard
Click to buy Retail KPI Dashboard in Google Sheets
To maximize the effectiveness of your Retail KPI Dashboard in Google Sheets, consider these best practices:
- Keep It Simple: Don’t overcrowd the dashboard with too many KPIs. Focus on the most critical metrics that will provide actionable insights.
- Use Conditional Formatting: Conditional formatting (e.g., color coding, up/down arrows) can help quickly highlight areas that need attention. Make it visually appealing and easy to interpret.
- Review KPIs Regularly: Keep the KPIs up to date. Regularly review the KPIs to ensure they are still relevant to your business objectives.
- Ensure Data Accuracy: Regularly validate the data being entered into the dashboard. Accurate data ensures the dashboard’s effectiveness in decision-making.
- Set Clear Targets: Ensure that every KPI has a clear target, whether it’s based on historical data, industry standards, or business objectives. Targets help measure progress and identify areas for improvement.
- Use a Monthly or Quarterly Review: Review the dashboard monthly or quarterly to assess trends, make adjustments, and ensure that all KPIs are aligned with your retail goals.
Frequently Asked Questions (FAQ)
Click to buy Retail KPI Dashboard in Google Sheets
How do you calculate KPIs for retail?
KPIs are calculated using specific formulas. For example, Sales Revenue is calculated by multiplying the number of units sold by the price per unit, while Conversion Rate is calculated by dividing the number of purchases by the total number of visitors.
What is the difference between MTD and YTD?
MTD (Month-to-Date) measures the performance from the start of the current month up to the present day.
YTD (Year-to-Date) measures performance from the start of the year up to the present day.
Can Google Sheets handle large retail datasets?
Yes, Google Sheets can handle relatively large datasets, but it may experience performance issues with very large datasets. For larger datasets, consider integrating with Google BigQuery or using external data tools.
How can I share the Retail KPI Dashboard with my team?
You can share the dashboard with your team by providing them with a view or edit link in Google Sheets. Google Sheets also allows for real-time collaboration.
Conclusion
Click to buy Retail KPI Dashboard in Google Sheets
A Retail KPI Dashboard in Google Sheets is an invaluable tool for retail managers who want to stay on top of their business performance. By tracking essential KPIs like sales revenue, conversion rates, and customer satisfaction, you can make data-driven decisions that improve business outcomes. With easy customization, collaboration, and cost-effectiveness, this dashboard provides the perfect solution for retail businesses of all sizes. By following the best practices, improving opportunities, and addressing common challenges, your dashboard will be an essential resource for driving business growth.
Visit our YouTube channel to learn step-by-step video tutorials
Youtube.com/@NeotechNavigators
Click to buy Retail KPI Dashboard in Google Sheets