Sales performance is the heartbeat of every business. Whether you’re tracking regional sales, product categories, or individual sales reps, understanding your data is key to improving strategy and hitting revenue goals. The Sales Business Intelligence Dashboard in Google Sheets is a powerful, ready-to-use solution that transforms raw data into visual, actionable insights — without needing complex BI tools or coding skills.Sales Business Intelligence Dashboard in Google Sheets
In this detailed article, we’ll explore how this dashboard works, its structure, features, advantages, improvement opportunities, best practices, and frequently asked questions.Sales Business Intelligence Dashboard in Google Sheets
What Is a Sales Business Intelligence Dashboard in Google Sheets?
Click to Buy Sales Business Intelligence Dashboard in Google Sheets
A Sales Business Intelligence (BI) Dashboard is an interactive analytical tool designed to monitor sales performance across multiple dimensions such as regions, products, and sales reps.
Built in Google Sheets, this dashboard integrates dynamic charts, KPI cards, and automated calculations to provide a clear picture of how sales targets are being achieved — all in real time.
It’s designed for sales managers, team leaders, and executives who want data-driven visibility without investing in expensive BI platforms.
Dashboard Overview
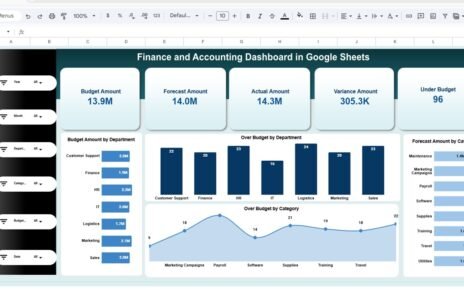
The Sales Business Intelligence Dashboard in Google Sheets consists of multiple interactive sections, each designed to highlight specific sales dimensions.
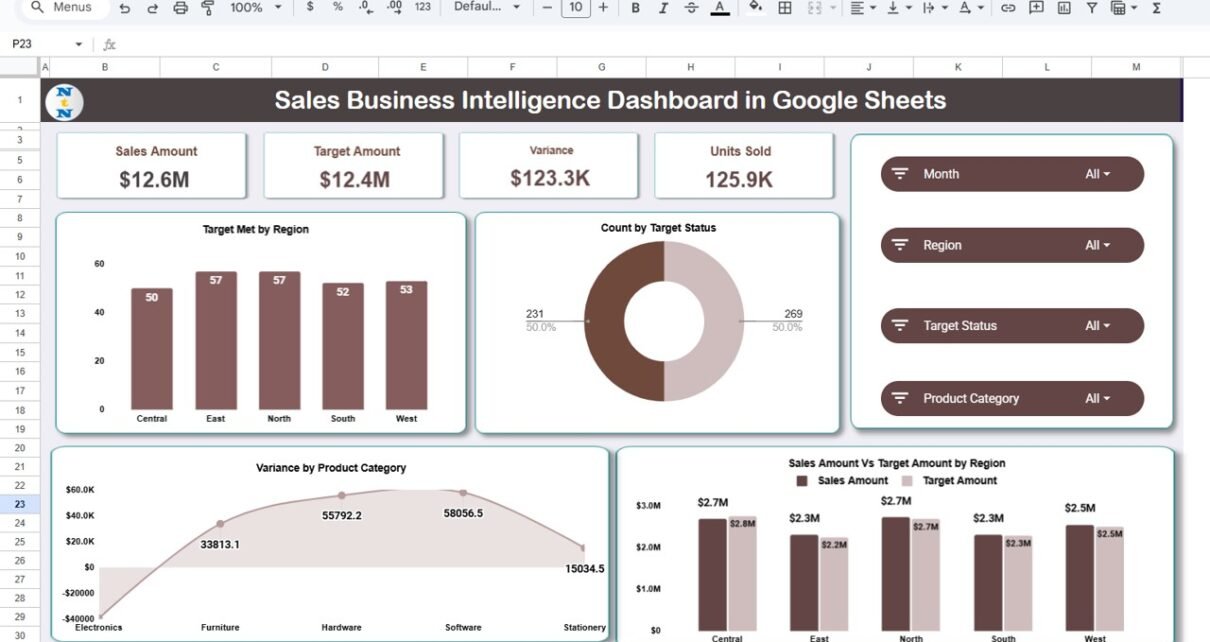
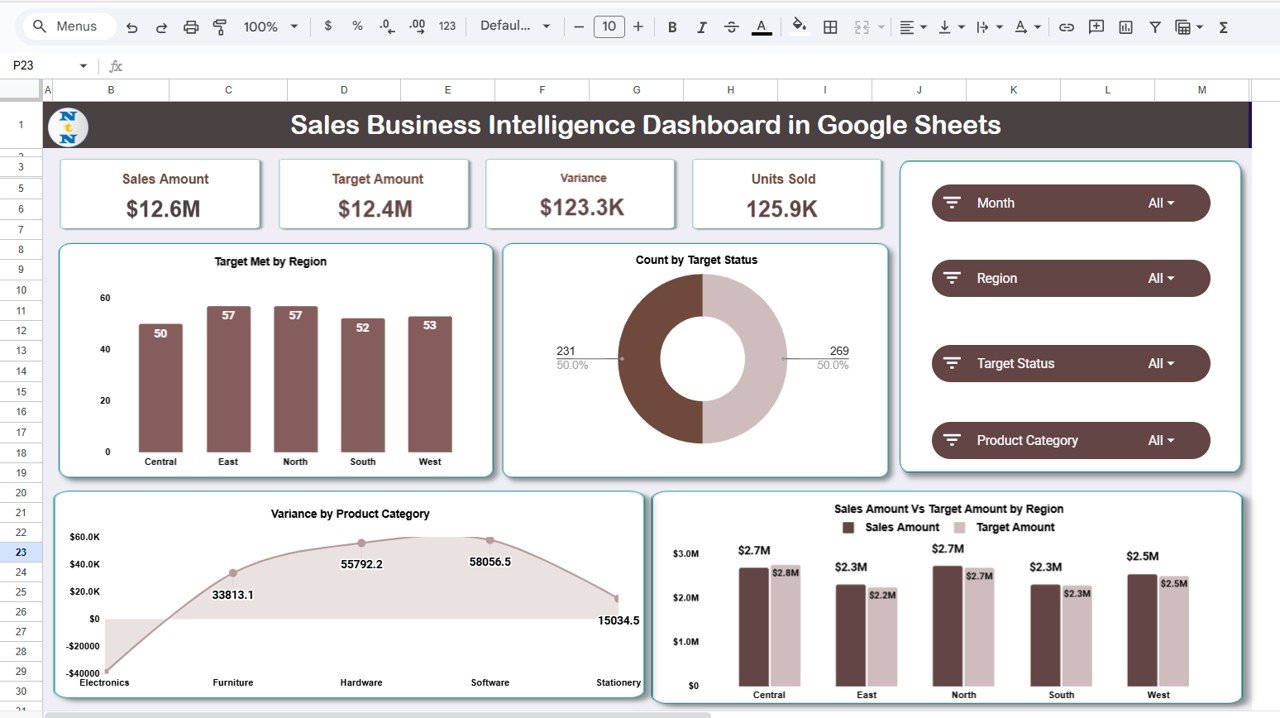
Overview Section
The Overview page serves as the central dashboard summarizing all key metrics and performance trends.
KPI Cards
At the top, you’ll find performance summary cards that display:
-
Sales Amount: Total revenue generated within the selected period.
-
Target Amount: The sales goal or target value.
-
Variance: Difference between Actual and Target (highlighted with up/down arrows and color codes).
-
Units Sold: Total quantity of products sold.
Charts in Overview
-
Target Met by Region – Displays how many regions have achieved their targets.
-
Count by Target Status – Shows the proportion of regions hitting or missing targets.
-
Sales Amount vs Target Amount by Region – Compares actual vs target sales figures regionally.
-
Variance by Product Category – Highlights performance gaps across product categories.
These visuals make it easy to identify where sales performance is strong and where improvement is needed.
Click to Buy Sales Business Intelligence Dashboard in Google Sheets
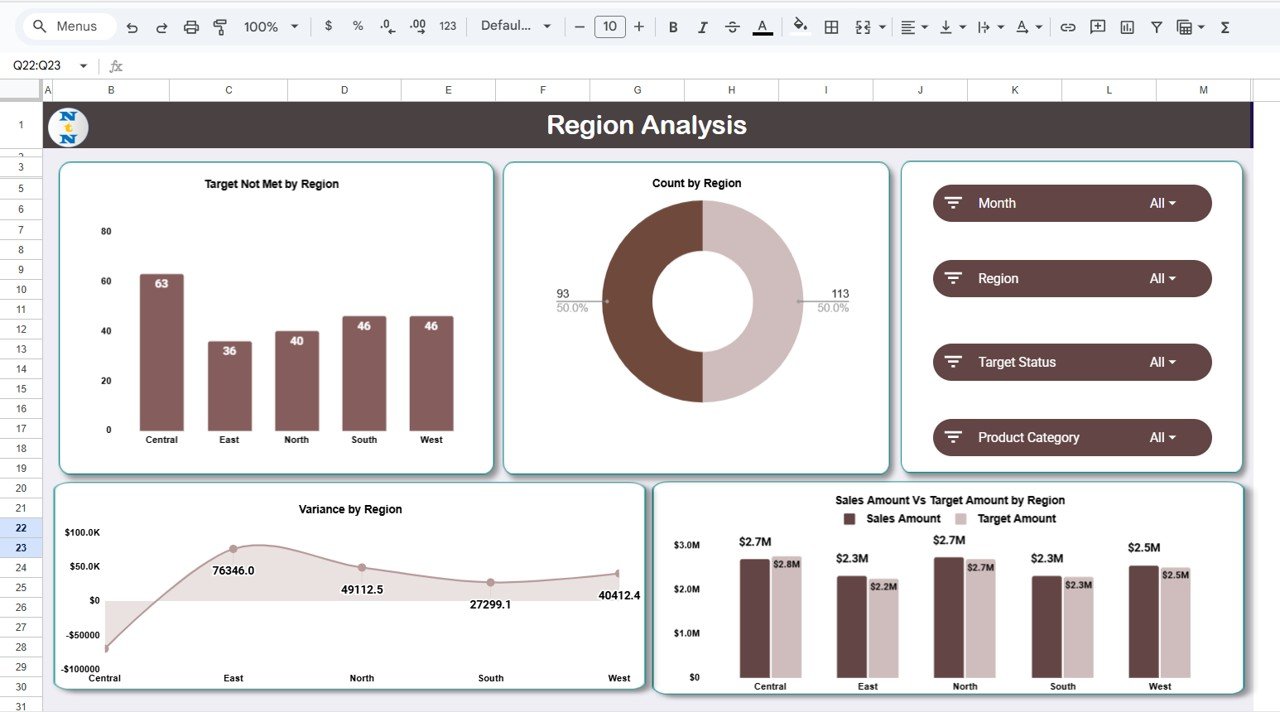
Region Analysis
This sheet breaks down sales data region-wise for deeper insights.
Charts Included:
-
Target Not Met by Region – Highlights regions falling short of sales goals.
-
Count by Region – Displays how many transactions or opportunities exist in each region.
-
Sales Amount vs Target Amount by Region – Compares actual vs target data.
-
Variance by Region – Highlights overperforming or underperforming regions.
With these visuals, regional managers can quickly identify trends and adjust sales strategies for underperforming areas.
Click to Buy Sales Business Intelligence Dashboard in Google Sheets
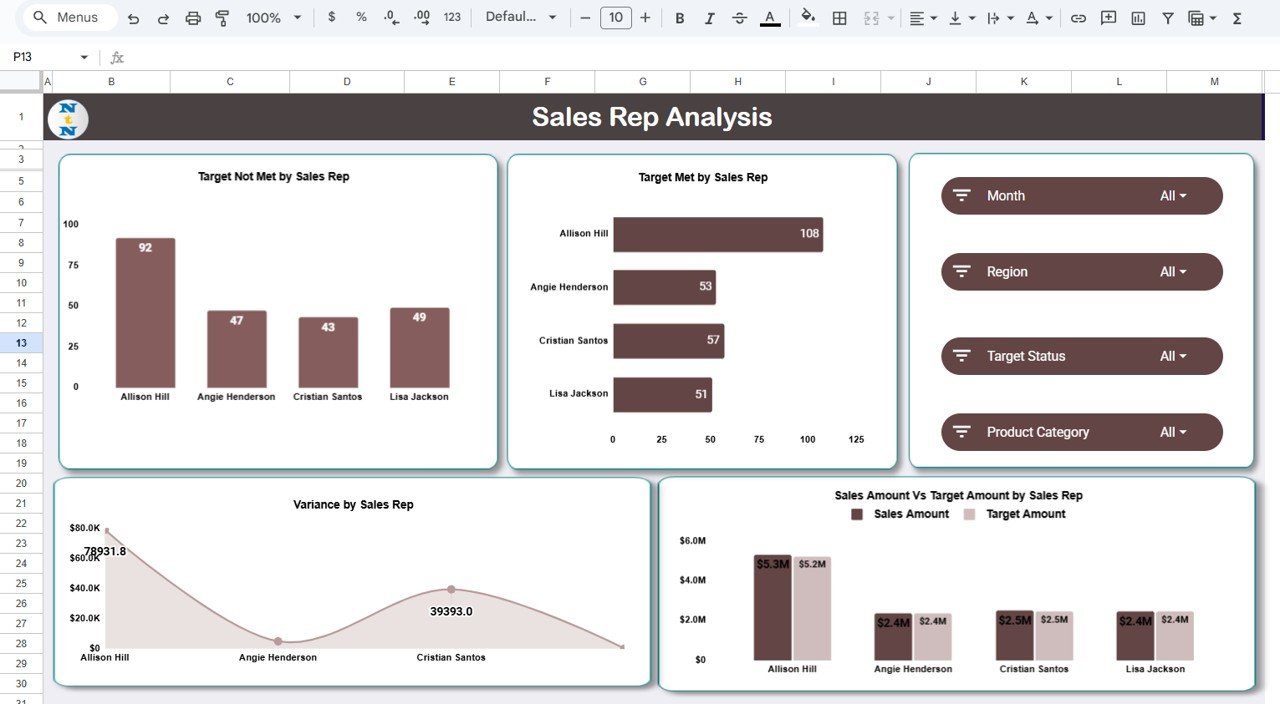
Sales Representative Analysis
This section focuses on individual sales performance metrics.
Charts Included:
-
Target Not Met by Sales Rep – Shows which sales reps missed their targets.
-
Target Met by Sales Rep – Displays the number of reps who achieved or exceeded goals.
-
Sales Amount vs Target Amount by Sales Rep – Visual comparison of individual performance.
-
Variance by Sales Rep – Identifies top and low performers for better coaching and reward planning.
This analysis helps sales leaders evaluate productivity, improve accountability, and plan incentive structures.
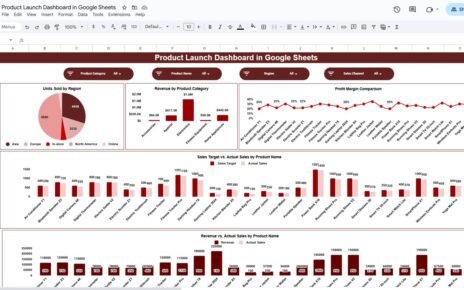
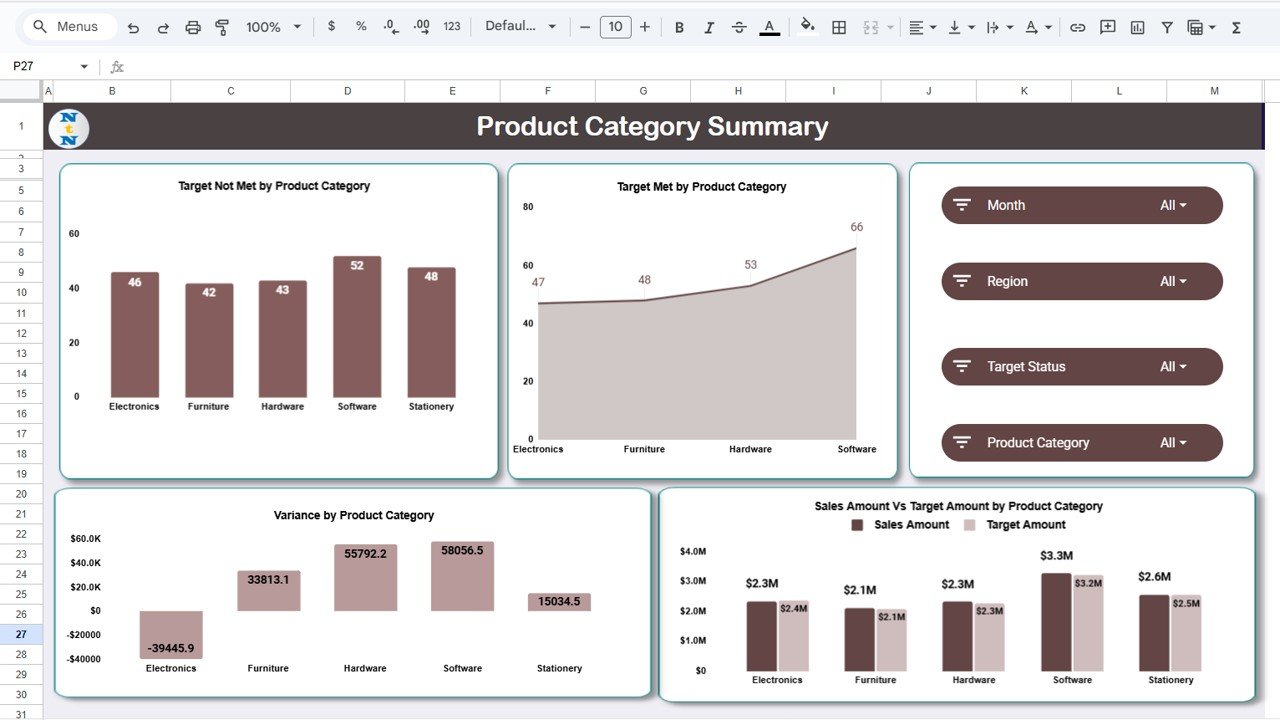
Product Category Summary
A key feature of the dashboard, this section provides insight into how different product categories contribute to sales success.
Charts Included:
-
Product Category Summary – Overall performance summary by category.
-
Target Met by Product Category – Number of categories achieving or exceeding targets.
-
Sales Amount vs Target Amount by Product Category – Comparative chart of actual vs expected revenue.
-
Variance by Product Category – Highlights overperforming and underperforming categories.
This breakdown helps product managers and marketing teams understand which categories drive the most revenue or need strategic adjustments.
Click to Buy Sales Business Intelligence Dashboard in Google Sheets
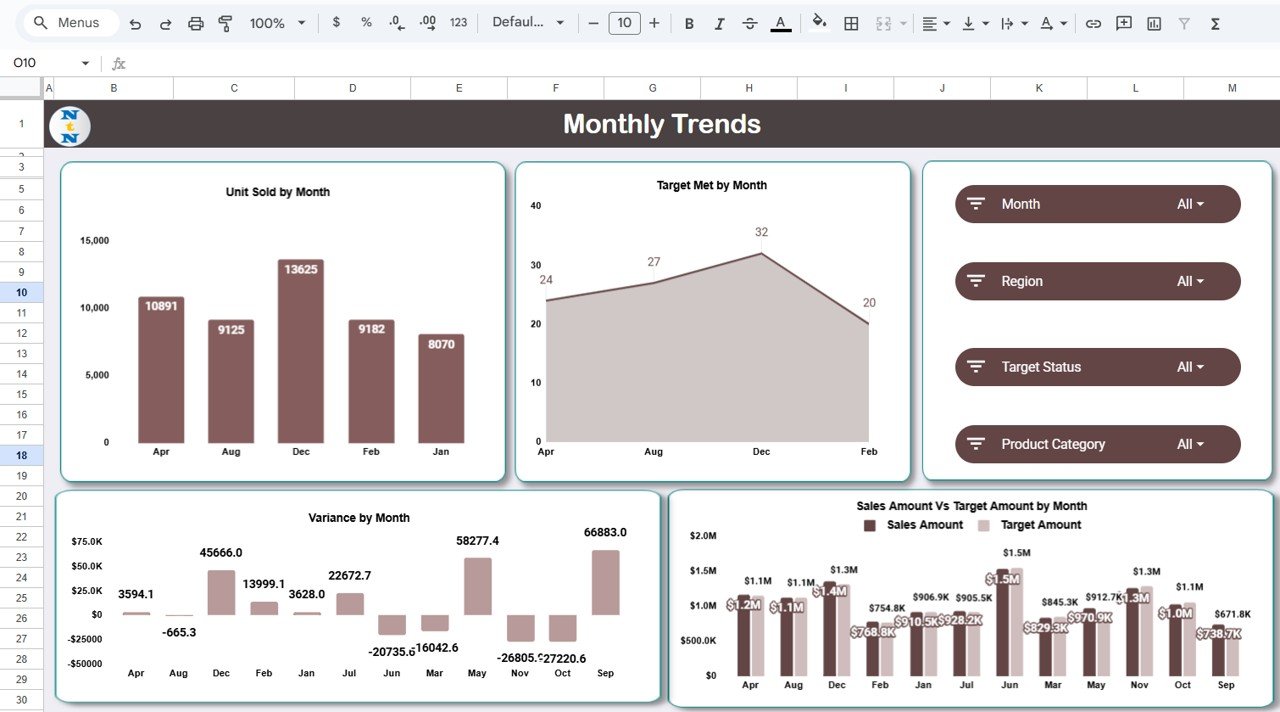
Monthly Trends
The Monthly Trends section shows performance changes over time.
Charts Included:
-
Units Sold by Month – Monitors product movement and demand trends.
-
Target Met by Month – Displays how many months met or exceeded targets.
-
Sales Amount vs Target Amount by Month – Visualizes actual vs target revenue month-over-month.
-
Variance by Month – Highlights months with profit surges or shortfalls.
This historical view helps management forecast sales, identify seasonality, and plan future targets.
Click to Buy Sales Business Intelligence Dashboard in Google Sheets
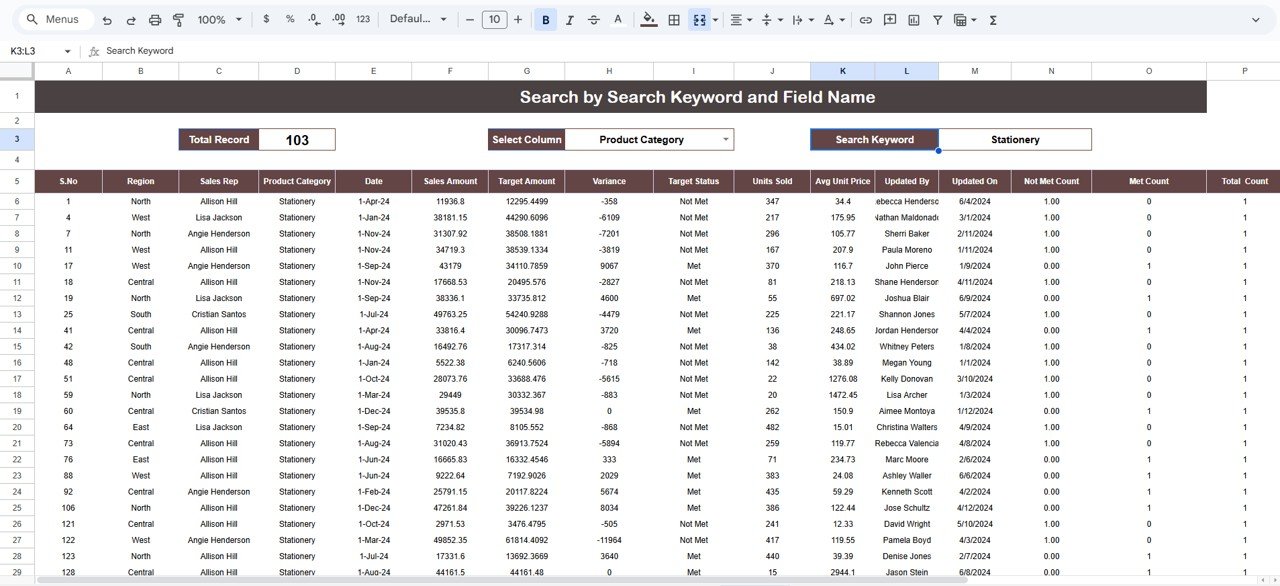
Search Tab
The Search Tab allows quick data lookups using keywords or field names.
For example:
-
Search “East Region” to filter all transactions from that area.
-
Search “John Smith” to see a specific sales rep’s performance.
-
Search “Electronics” to analyze all related product sales.
This feature eliminates manual scrolling and makes data retrieval effortless.
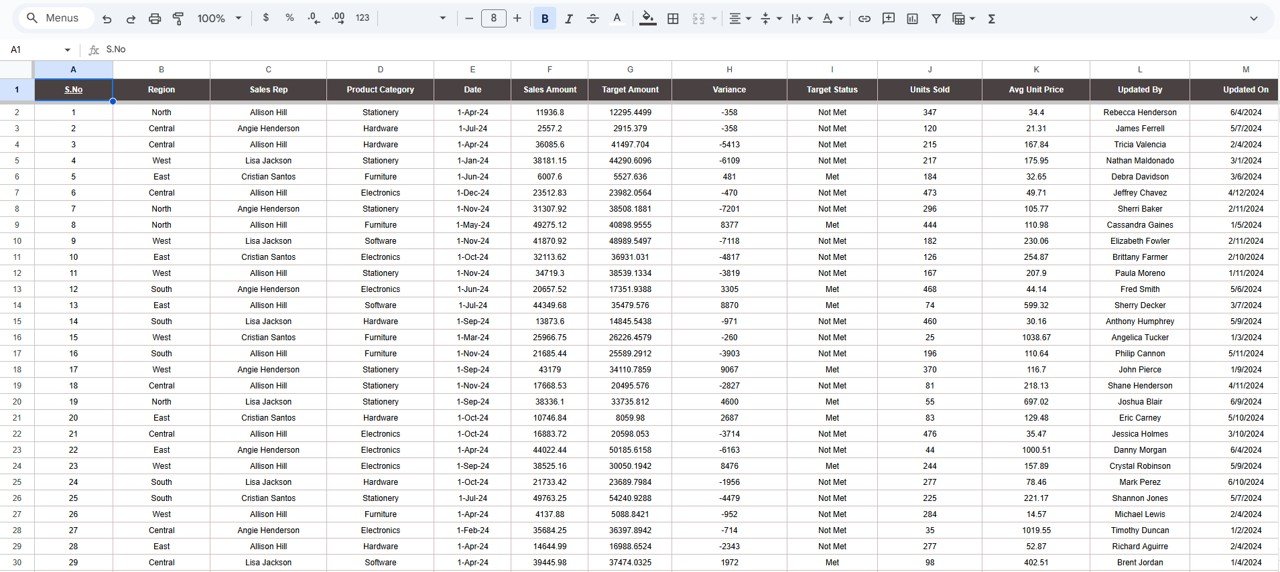
Data Sheet Tab
The Data Sheet is where you input or import all raw sales data.
Typical Columns Include:
- Date
- Region
- Sales Rep Name
- Product Category
- Sales Amount
- Target Amount
- Units Sold
- Target Status (Met / Not Met)
This sheet automatically feeds all other sections of the dashboard. Once data is updated, all visuals and KPIs refresh instantly — ensuring real-time accuracy.
Click to Buy Sales Business Intelligence Dashboard in Google Sheets
Advantages of the Sales Business Intelligence Dashboard in Google Sheets
-
Instant Data Visualization: Turn raw data into charts and summaries automatically.
-
Real-Time Collaboration: Multiple users can update and view the dashboard simultaneously.
-
Comprehensive Analysis: Covers regional, individual, product, and temporal dimensions.
-
Cost-Effective: No need for expensive BI tools — Google Sheets does it all.
-
Easy Customization: Add filters, KPIs, or charts to fit your organization’s needs.
-
Error-Free Updates: Dynamic formulas and charts reduce manual calculations.
-
Cloud-Based Access: Accessible from any device, anywhere, anytime.
Opportunities for Improvement
Click to Buy Sales Business Intelligence Dashboard in Google Sheets
Although the dashboard is powerful, a few upgrades can make it even better:
-
Automated Data Import: Link with CRM systems like HubSpot or Salesforce using Google Apps Script.
-
Email Alerts: Notify sales managers when targets are missed or exceeded.
-
Dynamic Filtering: Add interactive slicers for multi-dimensional filtering.
-
Performance Forecasting: Include a projection chart for future sales estimates.
-
Geo-Mapping: Visualize sales data on a Google Map based on regions.
Best Practices for Using the Dashboard
-
Update Data Weekly or Monthly: Keep numbers current for accurate insights.
-
Use Consistent Data Formats: Standardize date, currency, and name formats.
-
Set Realistic Targets: Align target goals with market potential.
-
Review Variance Reports: Identify areas needing improvement quickly.
-
Share Reports Regularly: Use “View Only” links for team-wide visibility.
-
Backup Data Monthly: Export copies for historical comparison.
-
Highlight Achievers: Recognize top-performing sales reps or regions using dashboard insights.
Conclusion
Click to Buy Sales Business Intelligence Dashboard in Google Sheets
The Sales Business Intelligence Dashboard in Google Sheets is a comprehensive, cost-effective solution for tracking sales performance. With visual KPIs, interactive charts, and real-time data updates, it empowers organizations to make smarter, faster decisions.
From regional trends to sales rep performance, this dashboard provides the clarity every sales manager needs to improve strategy, set realistic goals, and boost productivity.
If your goal is to turn data into insight — and insight into profit — this is the dashboard you’ve been looking for.
❓ Frequently Asked Questions (FAQ)
1. Can I import data from external sources like Google Forms or CRM?
Yes. You can automate data import using Google Apps Script or Zapier.
2. Can I customize KPIs and charts?
Absolutely. You can add or remove KPIs, regions, or products easily.
3. How do I track team vs individual performance?
Use the Sales Rep Analysis section to monitor individual progress and the Region Analysis for team-wide performance.
4. Does it update automatically?
Yes, the dashboard updates instantly when you modify the Data Sheet.
5. Can multiple users view and edit it simultaneously?
Yes. Google Sheets supports real-time collaboration with role-based permissions.
Visit our YouTube channel to learn step-by-step video tutorials
Youtube.com/@NeotechNavigators
Watch the step-by-step video Demo:
Click to Buy Sales Business Intelligence Dashboard in Google Sheets