In today’s competitive world, sales teams are often rewarded with incentives based on their performance. However, tracking and managing these incentives manually can be overwhelming. That’s where a Sales Incentive Dashboard and Tracker in Google Sheets comes in. It not only automates the process but also provides real-time insights into the performance of your sales team, making it easier for managers to make data-driven decisions.
In this article, we will guide you through creating an easy-to-use and comprehensive Sales Incentive Dashboard in Google Sheets. We’ll cover its key features, the sheets you need, and how to set it up for optimal tracking and analysis.
What is a Sales Incentive Dashboard?
A Sales Incentive Dashboard is a tool that tracks sales performance metrics and calculates payouts for sales representatives based on their achievements. It typically includes key performance indicators (KPIs) such as sales target achievement, attendance, upselling success rate, and new customer acquisition.
By setting up an incentive tracker, you can streamline the process of calculating bonuses and providing valuable insights to sales teams, ensuring that they are motivated and rewarded for their hard work.
Key Features of the Sales Incentive Dashboard and Tracker
The Sales Incentive Dashboard in Google Sheets consists of five sheet tabs, each playing a vital role in tracking and calculating performance metrics:
Click here to buy Sales Incentive Dashboard and Tracker in Google Sheets
1. Dashboard Sheet Tab
This tab offers an overview of the entire sales incentive structure. It contains cards and charts to visualize the most critical information:
Cards:
- Total Payout: Shows the total amount of incentives paid out.
- Total Head Count: Displays the number of employees eligible for incentives.
- Eligible Head Count: Shows how many employees meet the criteria for payouts.
- Eligible Percentage: A progress circle chart representing the percentage of eligible employees.
- Average Payout Per Employee: Shows the average incentive payout per employee.
Charts:
- Total Payout by Supervisor: A pie chart representing the payout distribution across supervisors.
- Head Count Percentage vs. Payout: An area chart to visualize the relationship between headcount and payouts.
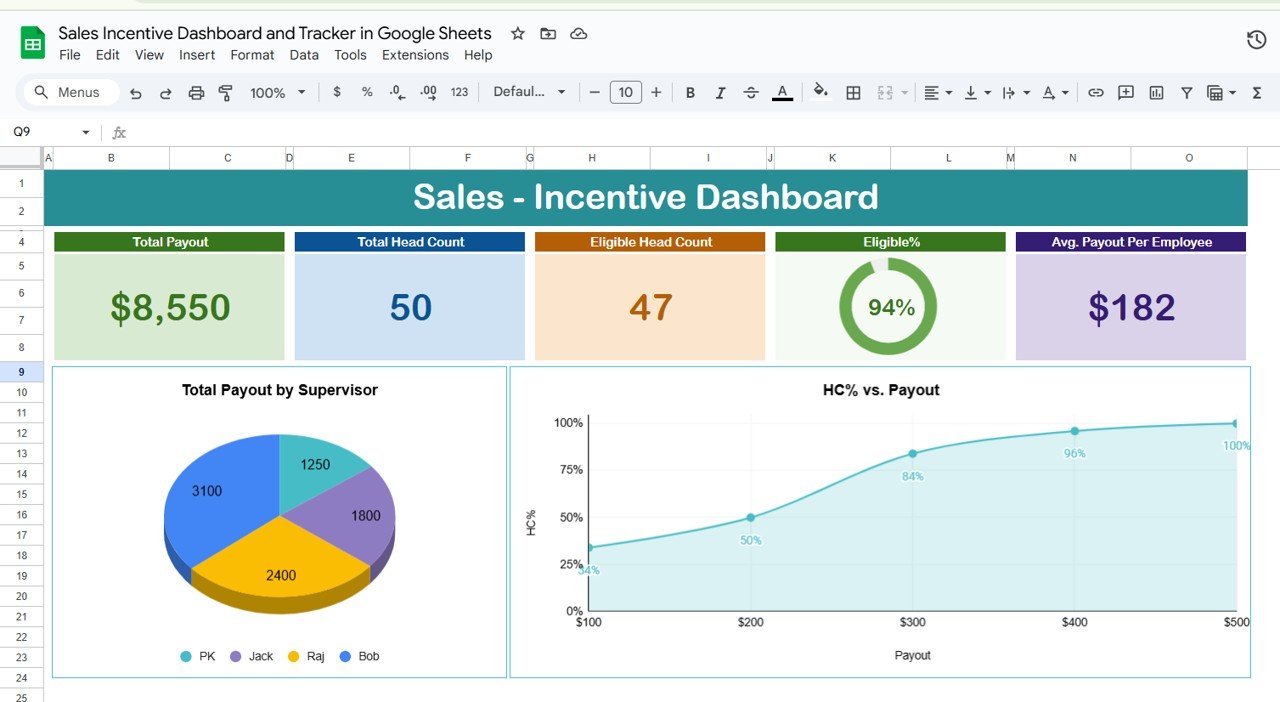
Sales Incentive Dashboard
Click here to buy Sales Incentive Dashboard and Tracker in Google Sheets
2. Employee Summary Sheet Tab
This tab provides detailed information on individual employee performance. It includes a dropdown list for employee names, and when an employee is selected, their performance data appears. Here’s an example of what the data looks like:
3. Tracker Sheet Tab
The Tracker Sheet is the input data sheet where all employee performance data is entered. It tracks the following information for each employee:
-
Employee Information: Includes details like employee ID, name, supervisor, and more.
-
Actual Values: Data like attendance, sales target achievement, and customer satisfaction scores.
-
Score Calculation: Weightages and scores are calculated based on performance metrics.
-
Payout Calculation: The payout is calculated based on the scores and eligibility.
Click here to buy Sales Incentive Dashboard and Tracker in Google Sheets
4. Weightages and Score Sheet Tab
This sheet determines how different performance metrics are weighted. For example:
-
Attendance: 20%
-
Sales Target Achievement: 40%
-
Customer Satisfaction: 15%
-
Upselling Success Rate: 15%
-
New Customer Acquisition: 10%
The sheet also includes criteria for eligibility. If an employee’s attendance is less than 75%, they may not qualify for any incentive payout.
Click here to buy Sales Incentive Dashboard and Tracker in Google Sheets
5. Support Sheet Tab
The Support Sheet contains any additional information or formulas that support the calculations in the other sheets. It could include lookup tables or additional instructions.
Click here to buy Sales Incentive Dashboard and Tracker in Google Sheets
Advantages of Using a Sales Incentive Dashboard
Implementing a Sales Incentive Dashboard brings numerous benefits to your sales operations. Here are the key advantages:
- Real-Time Tracking and Updates: The dashboard automatically updates as new data is entered, giving you real-time insights into employee performance and payouts. This reduces manual work and increases efficiency.
-
Increased Transparency: Sales teams can easily view their performance metrics, making them aware of their standing and what they need to improve. Transparency fosters a sense of fairness and motivates employees to meet their targets.
- Data-Driven Decision Making: With data at your fingertips, managers can make informed decisions about which areas need improvement. This leads to better resource allocation and targeted sales strategies.
-
Simplified Incentive Calculation: The dashboard calculates incentives based on predefined criteria, eliminating the errors and delays that typically come with manual calculations.
-
Performance Visualization: With visual representations such as charts and progress bars, employees and managers can quickly understand the data, which makes tracking progress easier.
Opportunity to Improve in Sales Incentive Tracking
While a Sales Incentive Dashboard provides many benefits, there’s always room for improvement. Here are some areas where enhancements can be made:
-
Adding More Performance Metrics: You can extend the dashboard by including additional KPIs, such as call conversion rates, lead generation success, and social media engagement. This can help create a more holistic view of employee performance.
-
Automating Data Import: To streamline the process further, consider integrating the dashboard with CRM systems or other software to automatically import employee data, eliminating the need for manual entry.
-
Customizable Payout Structure: Instead of a one-size-fits-all payout structure, you could allow for more flexibility in setting the payout rates based on specific goals, product categories, or time periods.
-
Gamification: Adding gamified elements such as leaderboards or rewards for top performers can increase motivation and drive better performance.
-
Mobile Compatibility: For easy access on-the-go, ensure that the dashboard is mobile-friendly, allowing sales teams to track their performance and incentives from anywhere.
Best Practices for Using the Sales Incentive Dashboard
To get the most out of your Sales Incentive Dashboard, follow these best practices:
- Update the Dashboard Regularly: Ensure that data is updated regularly to provide the most accurate insights. Set a schedule for manual updates or automate the process where possible.
-
Set Clear Performance Metrics: Clearly define the KPIs that will be used to calculate payouts. Make sure that the team is aware of these criteria, so they understand how their efforts will be rewarded.
-
Use Visualizations for Clarity: Take full advantage of charts and graphs. Visual aids can make complex data easier to understand and can help employees track their progress more effectively.
-
Maintain Data Integrity: Regularly review the data for accuracy. Incorrect or outdated information can lead to wrong incentive calculations, potentially affecting employee morale.
-
Ensure Employee Access to the Dashboard: Allow employees to have access to their individual performance summaries so that they can monitor their progress and be motivated to hit their goals.
Frequently Asked Questions (FAQ)
1. What is a Sales Incentive Dashboard? A Sales Incentive Dashboard is a tool used to track and manage sales performance and calculate incentive payouts for employees based on various performance metrics.
2. How do I set up a Sales Incentive Dashboard in Google Sheets? Setting up a Sales Incentive Dashboard involves creating multiple sheets for data entry, calculation, and visualization. You’ll need to input employee performance data, define performance metrics, and create charts and formulas for payout calculation.
3. Can I automate the data entry in the dashboard? Yes, you can automate the data import process by integrating the dashboard with CRM tools or other data sources. This can reduce manual effort and ensure that the data is always up to date.
4. How do I calculate the payout in the dashboard? Payouts are calculated based on performance metrics such as attendance, sales target achievement, customer satisfaction, upselling success, and new customer acquisition. Each metric has a predefined weight, and the payout is determined based on the total score.
5. How can I improve the Sales Incentive Dashboard? You can improve the dashboard by adding more KPIs, automating data import, creating a customizable payout structure, gamifying the experience, and ensuring mobile compatibility for easy access.
Conclusion
A Sales Incentive Dashboard and Tracker in Google Sheets is a powerful tool for streamlining incentive calculations and improving transparency in performance management. With the ability to track various performance metrics, visualize data, and calculate payouts automatically, this dashboard can significantly enhance the efficiency of sales operations.
By following the best practices and continually improving the dashboard, you can ensure that your sales team remains motivated and focused on achieving their goals, leading to better outcomes for your organization.
Visit our YouTube channel to learn step-by-step video tutorials
Youtube.com/@NeotechNavigators
Watch the step-by-step video tutorial:
Click here to buy Sales Incentive Dashboard and Tracker in Google Sheets