Shopify Store Dashboard in HTML is a browser-based interactive analytics template designed for Shopify store owners, e-commerce managers, and business analysts who want instant visibility into their store performance — without installing any desktop software or cloud subscriptions. This HTML Dashboard Template transforms raw Shopify order data into professional visual insights that you can access directly in your web browser. 📊🚀
Built with modern HTML, CSS, and JavaScript, this dashboard includes 5 interactive analysis pages and a searchable data view, featuring 6 KPI cards, 15+ dynamic charts, and filtering slicers across all pages. Whether you sell through a single Shopify storefront or manage multiple sales channels, this dashboard delivers actionable insights for revenue tracking, fulfillment monitoring, product analysis, and channel performance comparison — all in one self-contained HTML file.
Click here to Purchase the Shopify Store Dashboard in HTML
Key Features of Shopify Store Dashboard in HTML
The Shopify Store Dashboard in HTML comes packed with features that make it a powerful analytics companion for any Shopify business. This template includes 5 dedicated dashboard pages plus a data view, tracking 6 core KPIs across Total Revenue, Total Orders, Average Order Value, Total Customers, Fulfillment Rate, and Gross Profit. Here are the standout capabilities that set this dashboard apart:
- Multi-Page Dashboard Architecture: Five specialized analysis pages (Overview, Sales Analysis, Product Insights, Channel Performance) plus a full Data View page with search, sort, pagination, and CSV export.
- Real-Time KPI Cards: Six KPI cards update automatically when data changes, giving you instant visibility into your most critical metrics.
- 15+ Dynamic Charts: Revenue by Product Category, Orders by Sales Channel, Revenue by Region, Order Status Distribution, Monthly Revenue Trend, Revenue by Customer Type, Revenue by Payment Method, Top 10 Products by Revenue, Revenue vs Cost by Category, Quantity Sold by Category, Avg Unit Price by Category, Revenue by Category and Customer Type, and more.
- Interactive Slicers: Filter all charts and KPIs instantly by clicking on any slicer across dashboard pages.
- Browser-Based Deployment: No software installation, no server setup, no database required. Open index.html in Chrome, Firefox, Edge, or Safari and you are ready to analyze.
- Fully Customizable: Built with standard web technologies — you can modify charts, add new pages, or extend the data structure to match your unique business needs.
Dashboard Pages Explanation
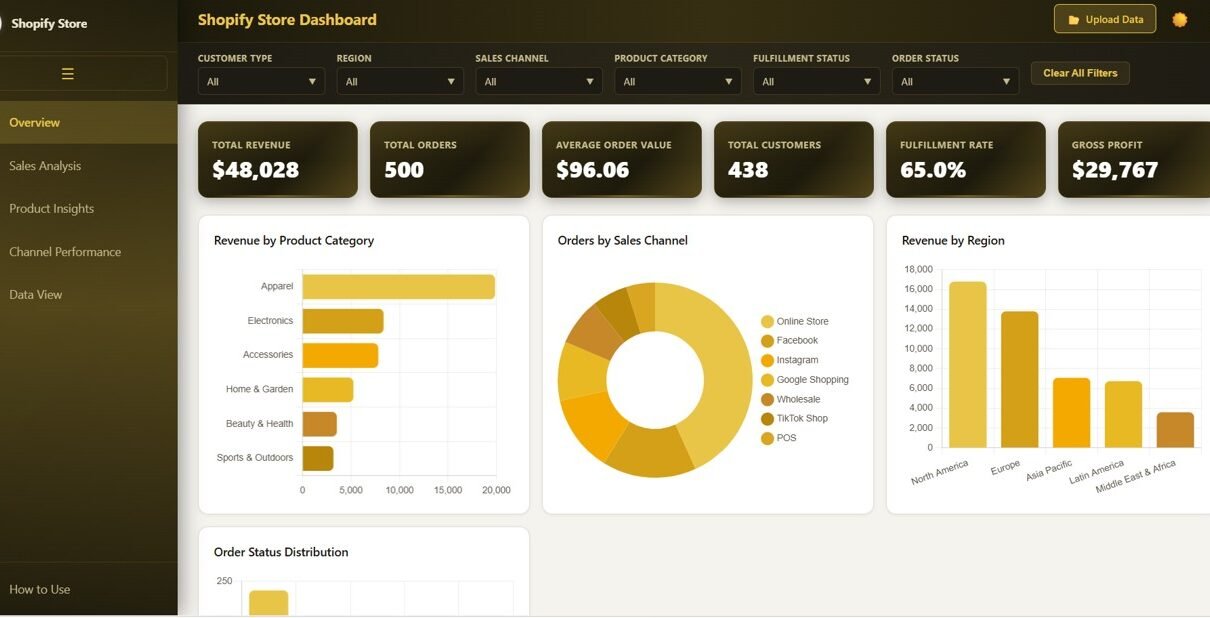
1. Overview Page — Your Shopify Command Center
The Overview Page provides a high-level snapshot of your entire Shopify store performance. At the top, six KPI cards display Total Revenue, Total Orders, Average Order Value, Total Customers, Fulfillment Rate, and Gross Profit. Below the KPI cards, dynamic charts visualize Revenue by Product Category to pinpoint your top-selling product lines, Orders by Sales Channel to compare platform-level performance, Revenue by Region for geographic sales distribution insights, Order Status Distribution showing how orders flow through processing stages, and Monthly Revenue Trend to identify seasonal patterns and growth trajectories. Multiple slicers on the right let you filter the entire page by any dimension instantly.
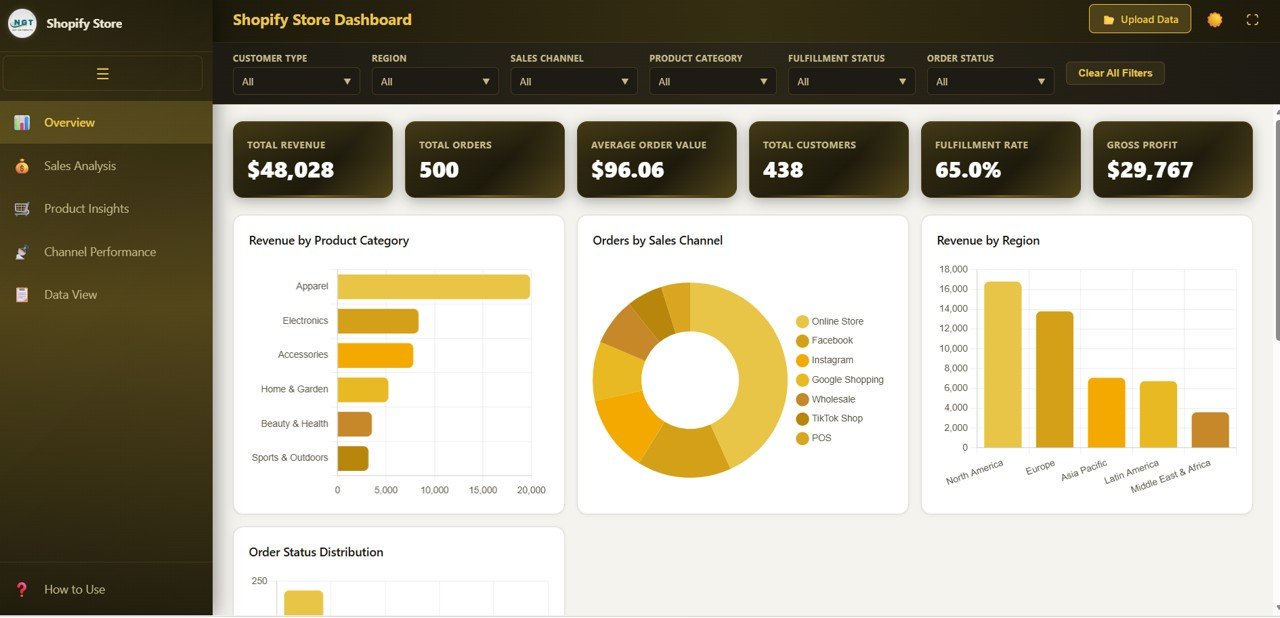
Shopify Store Dashboard Overview
2. Sales Analysis Page
The Sales Analysis page dives deeper into your Shopify sales performance with focused analytics. This page features Revenue by Customer Type to compare how new customers perform against returning buyers, Revenue by Payment Method to understand which payment options drive the most revenue, Top 10 Products by Revenue to identify your bestselling items, and Revenue vs Cost by Category to evaluate category-level profitability and margin health. These insights help you optimize pricing strategies, improve customer retention targeting, and strengthen overall revenue generation.
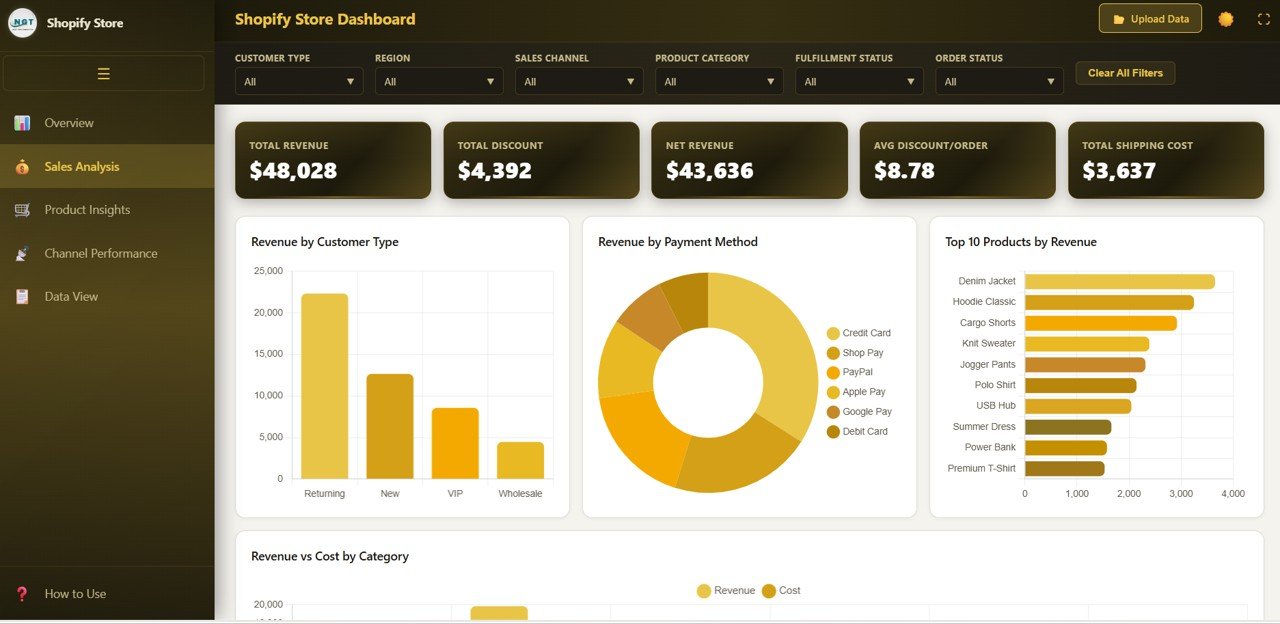
Sales Analysis
3. Product Insights Page
The Product Insights page helps you understand product performance at a granular level. It shows Quantity Sold by Category to identify volume leaders, Avg Unit Price by Category for pricing analysis across different product lines, Revenue by Category and Customer Type for segment-level revenue insights, and Top 10 Products by Quantity to track your most popular items by volume. These analytics empower you to make smarter inventory decisions, optimize product pricing, and focus marketing spend on your most profitable categories.
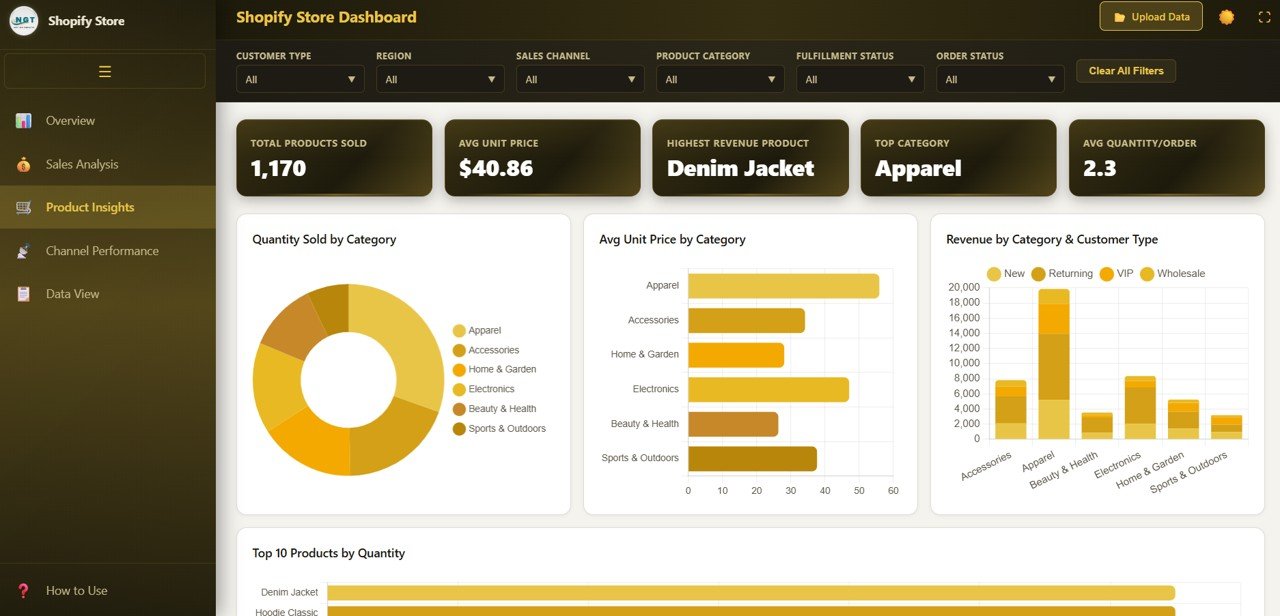
Product Insights
4. Channel Performance Page
If you sell through multiple Shopify sales channels, this page is essential for understanding which channels drive the most value. It visualizes Revenue by Sales Channel for direct revenue comparison, Orders by Channel and Region for geographic channel performance, Fulfillment Status by Channel to monitor delivery efficiency across each platform, and Avg Order Value by Channel to understand spending patterns. Compare your online store, POS, social media storefronts, and marketplace integrations side by side.
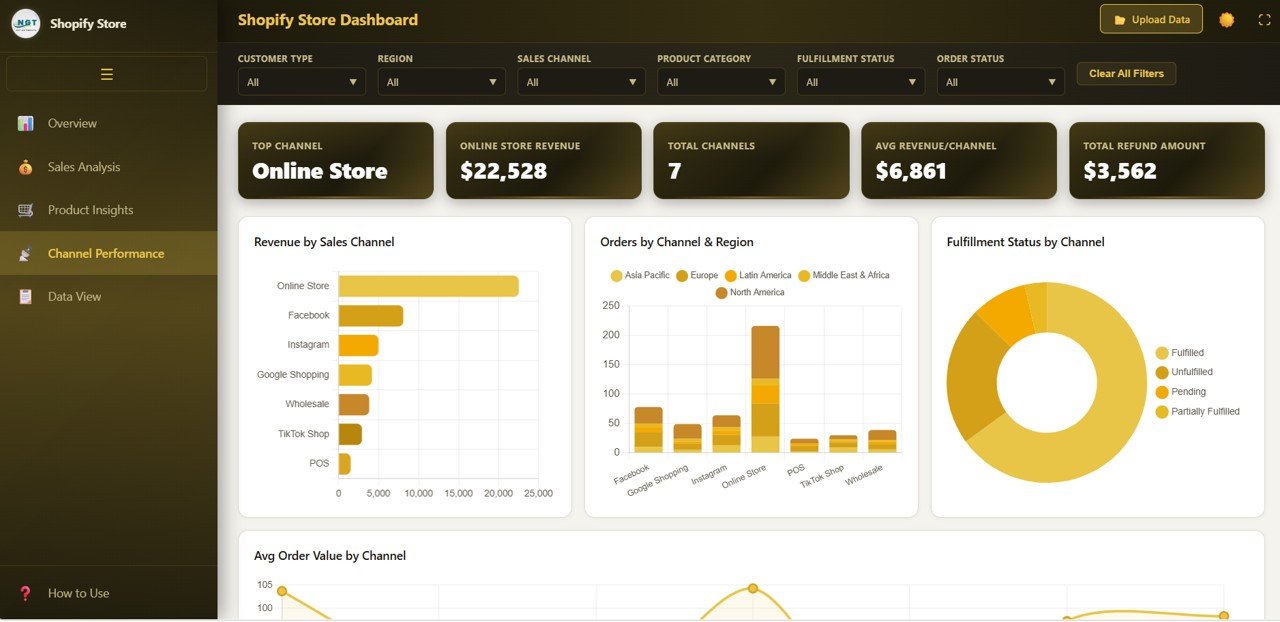
Channel Performance
5. Data View Page
The Data View page provides a detailed, searchable data table where you can browse every record in your dataset. It includes search functionality to find specific orders, column sorting to organize data by any field, pagination for easy navigation through large datasets, and a CSV export button to download filtered data for further analysis in Excel or Google Sheets. This page gives you complete transparency into every transaction.
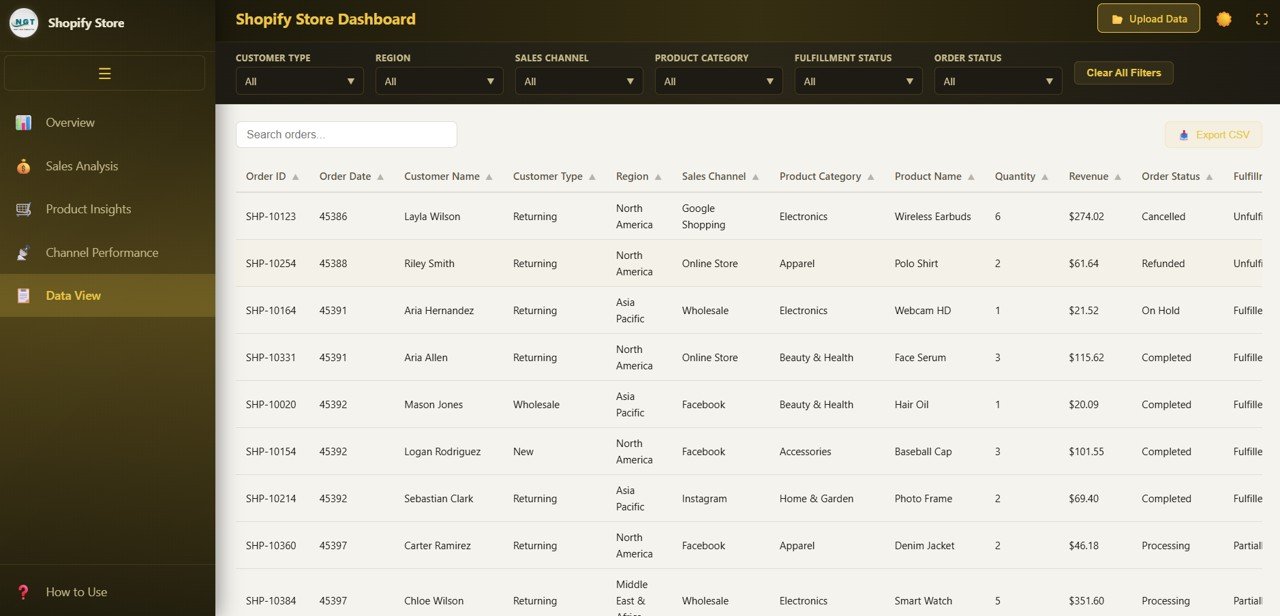
Data View
Advantages of Shopify Store Dashboard in HTML
- Zero Software Dependencies: Unlike Excel or Power BI dashboards, this template runs entirely in your browser. No licenses, no installations, no cloud subscriptions needed.
- Instant Setup: Unzip the file, open index.html, and your dashboard is ready. The entire process takes under 5 minutes.
- Cross-Platform Compatibility: Works identically on Windows, Mac, Linux, and Chromebook. Any device with a modern browser can run this dashboard.
- Modern SaaS-Style Design: Professional UI with clean layouts, color-coded charts, and intuitive navigation tabs that look like a premium analytics application.
- Data Privacy: All data stays on your local machine. Nothing is uploaded to any server or cloud service, ensuring complete privacy for your Shopify business data.
- Fully Extensible: Since the dashboard is built with standard HTML, CSS, and JavaScript, developers can easily add new charts, connect to APIs, or integrate with other tools.
Opportunities for Improvement
- API Integration: Connect the dashboard directly to your Shopify Admin API to pull live order data automatically instead of manual CSV imports.
- Date Range Picker: Add a date range filter to analyze specific time periods beyond the built-in slicer functionality.
- Email Alerts: Implement JavaScript-based notifications for KPI thresholds, such as when fulfillment rate drops below a target percentage.
- Dark Mode Support: Add a theme toggle for users who prefer dark-mode interfaces during extended analysis sessions.
- Multi-Currency Support: Extend the data model to handle stores operating in multiple currencies with automatic conversion.
Best Practices
- Update Data Weekly: Export fresh order data from Shopify Admin every week to keep your dashboard current and actionable.
- Use Slicers Strategically: Combine multiple slicer selections to drill into specific segments like a particular product category in a specific region.
- Monitor Fulfillment Rate: Keep this KPI above 95% to maintain customer satisfaction and reduce support tickets.
- Compare Channels Monthly: Use the Channel Performance page to identify underperforming channels and reallocate marketing budget accordingly.
- Bookmark the Dashboard: Save the local file path as a browser bookmark for instant one-click access every morning.
- Back Up Your Data File: Keep copies of your data file before each update so you can compare historical performance snapshots.
Explore Relevant Templates
📊 Shopify Store Dashboard in Excel — Track Shopify store performance using Excel pivot tables and dynamic charts with slicer-based filtering.
📈 Shopify Store Dashboard in Power BI — Advanced Shopify analytics with interactive Power BI visuals and DAX-powered calculations.
📋 E-Commerce Sales Performance Dashboard in Google Sheets — Cloud-based e-commerce analytics with real-time Google Sheets collaboration.
🛍️ Online Marketplaces Dashboard in Excel — Multi-platform selling analytics for Amazon, eBay, Walmart, Etsy, and Shopify.
Frequently Asked Questions
What is the best HTML dashboard template for tracking Shopify store performance?
The Shopify Store Dashboard in HTML is a purpose-built analytics template that tracks 6 KPIs including Total Revenue, Total Orders, Average Order Value, Total Customers, Fulfillment Rate, and Gross Profit across 5 interactive pages. It runs entirely in your browser with no software installation required, making it the ideal lightweight solution for Shopify store analytics.
How do I set up the Shopify Store Dashboard in HTML?
Setup takes under 5 minutes. Unzip the downloaded file, open index.html in any modern browser, and the dashboard loads instantly with sample data. Replace the sample data file with your Shopify order export and refresh the browser to see your real analytics.
Can I use this HTML dashboard without coding skills?
Yes. The dashboard is designed for non-technical users. You only need to replace the sample data file with your own Shopify data and open the HTML file in a browser. All charts, KPIs, and navigation work automatically without any coding.
What makes an HTML dashboard different from Excel or Power BI dashboards?
HTML dashboards run directly in your web browser without needing any installed software. Unlike Excel (which requires Microsoft Office) or Power BI (which requires Power BI Desktop), an HTML dashboard works on any device with a browser — Windows, Mac, Linux, or Chromebook. It also offers faster load times and modern web-based interactivity.
Can I customize the charts and add new analysis pages?
Yes. The dashboard is built with standard HTML, CSS, and JavaScript. Anyone with basic web development knowledge can modify existing charts, change color themes, add new visualizations, or create entirely new analysis pages by extending the codebase.
Is the Shopify Store Dashboard in HTML secure for business data?
Yes. The dashboard runs entirely on your local machine. No data is transmitted to any external server or cloud service. Your Shopify business data stays completely private and secure on your computer.
Conclusion
The Shopify Store Dashboard in HTML is the perfect analytics solution for Shopify store owners who want professional-grade business intelligence without the complexity of desktop software or cloud subscriptions. With 5 interactive dashboard pages, 6 real-time KPI cards, 15+ dynamic charts, and a searchable data view with CSV export, this template gives you everything you need to track sales, monitor fulfillment, analyze products, and compare channel performance — all from your web browser.
Whether you are a solo Shopify entrepreneur or managing a team of e-commerce analysts, this dashboard helps you make faster, smarter, data-driven decisions. Click here to Purchase the Shopify Store Dashboard in HTML and start analyzing your Shopify store performance today.
🎥 Visit our YouTube channel for step-by-step video tutorials: Youtube.com/@NeoTechNavigators