Click here to Purchase Subscription Business Dashboard in Google Sheets
Subscription Business Dashboard in Google Sheets is a professionally designed, ready-to-use analytics template that helps SaaS founders, subscription box operators, and membership businesses track their most critical recurring revenue metrics. Whether you need to monitor Monthly Recurring Revenue (MRR), analyze churn patterns, compare plan performance, or look up individual subscriber details, this dashboard puts everything in one place. With 6 interactive sheet tabs, 5 high-level KPI cards, and multiple chart-based analysis pages, it gives you a complete subscription analytics suite without requiring any coding, add-ons, or advanced spreadsheet skills. Just paste your data and let the dashboard do the rest.
Key Features of Subscription Business Dashboard in Google Sheets
This template includes 6 dedicated pages covering every aspect of subscription business analytics. Here is a detailed look at what each page offers and how the dashboard helps you make smarter decisions with your subscriber data.
- 5 KPI Summary Cards on Overview Page – Total Subscribers, Monthly Recurring Revenue, Total Revenue, Average Lifetime (Months), and Average NPS Score provide an instant health check of your subscription business.
- Interactive Slicers – Filter the entire Overview dashboard by plan, status, region, acquisition channel, or any other dimension using built-in Google Sheets slicers.
- Multi-Page Analysis – Separate pages for Revenue Analysis, Churn and Retention, Plan Breakdown, and Subscriber Lookup allow deep-dive investigation into specific areas.
- Subscriber-Level Search – A dedicated lookup page with dropdown selection to view all 14+ fields for any individual subscriber.
- No Macros or Add-ons – Built entirely with native Google Sheets formulas and charts. Works on any device with Google Drive access.
- Plug-and-Play Data Sheet – Structured input sheet where you replace sample data with your own and everything updates automatically.Subscription Business Dashboard in Google Sheets
Dashboard Pages Explained
Click here to Purchase Subscription Business Dashboard in Google Sheets
1. Overview Page
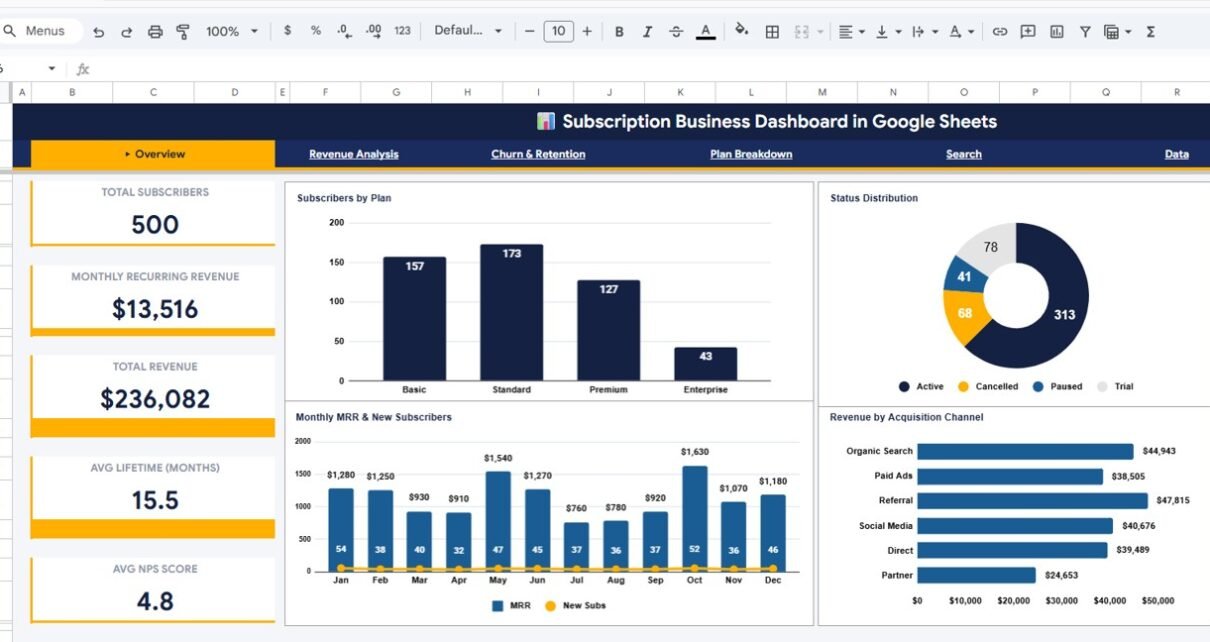
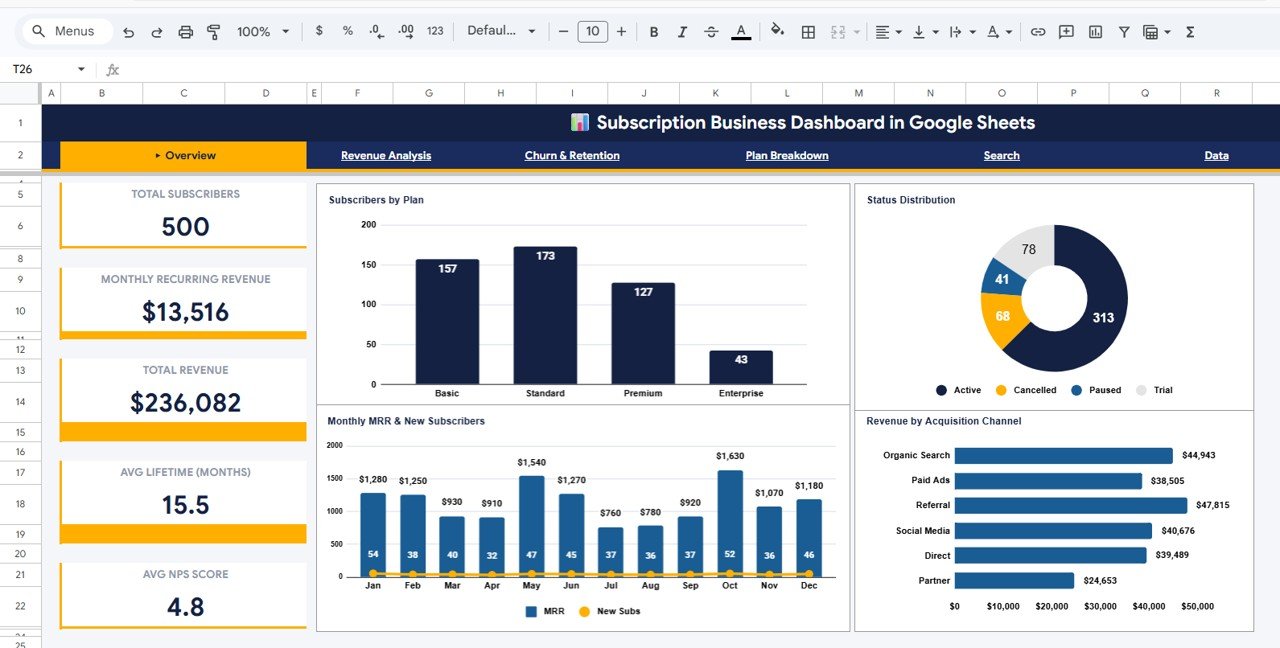
The Overview page is the main landing page of the Subscription Business Dashboard. At the top, you will find 5 KPI cards that summarize the most important subscription metrics: Total Subscribers, Monthly Recurring Revenue (MRR), Total Revenue, Average Lifetime in Months, and Average NPS Score. These cards give you an instant snapshot of your business health without scrolling through any data.
Below the KPI cards, the page displays several charts that provide visual analysis of your subscriber base. The Subscribers by Plan chart shows how your subscribers are distributed across different pricing plans. The Status Distribution chart breaks down subscribers by their current status such as active, churned, or paused. The Monthly MRR and New Subscribers chart tracks your revenue and growth trends over time on a month-by-month basis. The Revenue by Acquisition Channel chart reveals which marketing channels are driving the most revenue.
Multiple slicers are provided at the top of the page so you can quickly filter all charts and KPIs by plan, status, region, channel, or any other dimension. This makes it easy to isolate specific segments and see how they perform compared to the overall business.
Subscription Business Dashboard in Google Sheets
2. Revenue Analysis
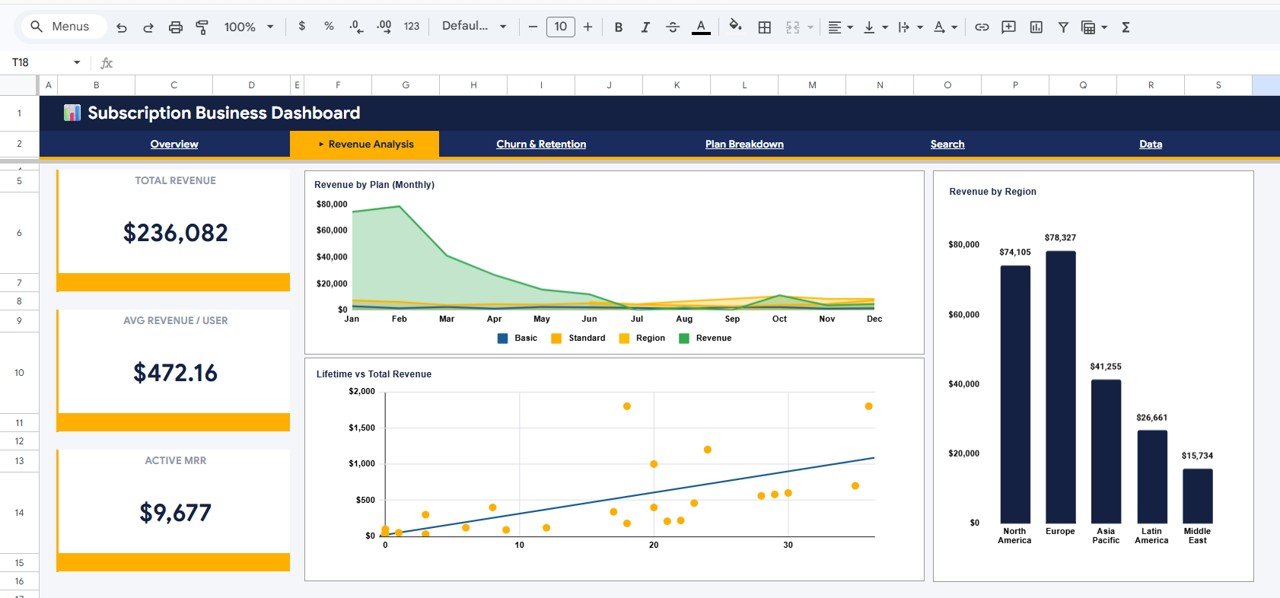
The Revenue Analysis page dives deeper into the financial performance of your subscription business. It includes three key visualizations. The Revenue by Plan (Monthly) chart shows how much revenue each pricing plan generates on a monthly basis, helping you identify your highest-earning plans. The Revenue by Region chart maps out revenue distribution across geographic regions so you can spot strong and weak markets. The Lifetime vs Total Revenue chart compares individual subscriber lifetime values against total revenue generated, helping you understand the relationship between customer longevity and revenue contribution.
Revenue Analysis
3. Churn and Retention
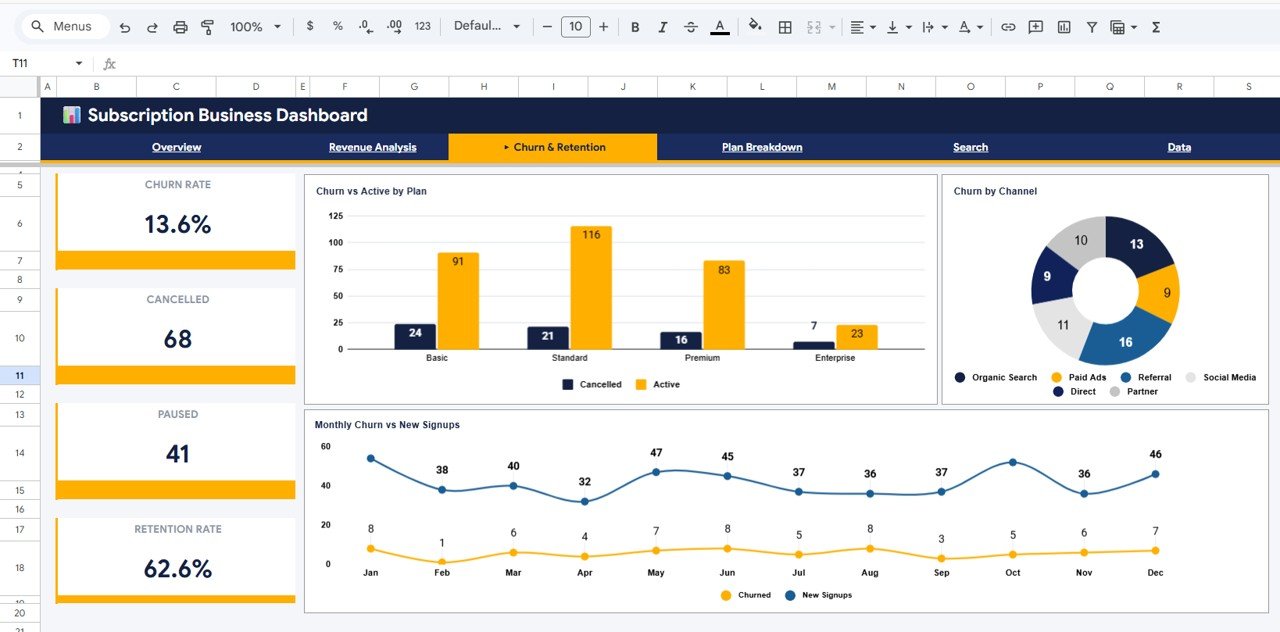
The Churn and Retention page is critical for any subscription business because it directly measures how well you are keeping your customers. The Churn vs Active by Plan chart compares the number of churned versus active subscribers for each pricing plan, revealing which plans have the highest attrition. The Churn by Channel chart shows which acquisition channels produce subscribers that are more likely to cancel. The Monthly Churn vs New Signups chart tracks the balance between subscribers leaving and new ones joining each month, giving you a clear picture of net subscriber growth or decline.
Churn and Retention
4. Plan Breakdown
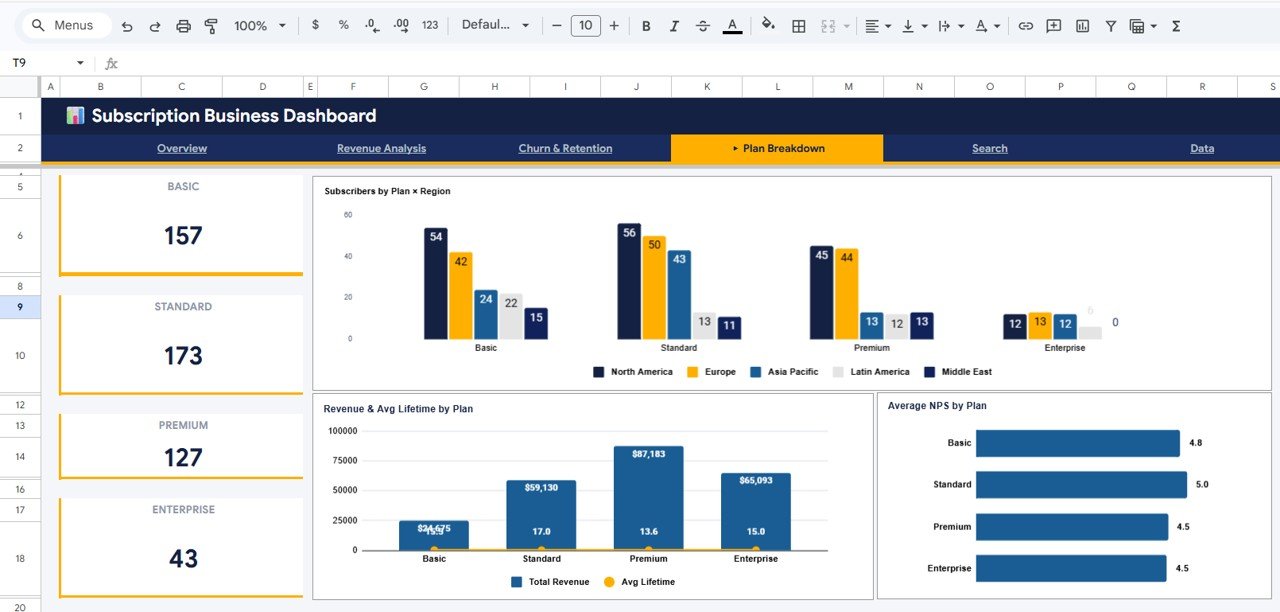
The Plan Breakdown page provides cross-dimensional analysis of your subscription plans. The Subscribers by Plan x Region chart shows how subscribers are distributed across plans and regions simultaneously, which is useful for regional marketing decisions. The Revenue and Avg Lifetime by Plan chart compares both revenue generated and average subscriber lifetime side by side for each plan. The Average NPS by Plan chart reveals customer satisfaction scores by plan type, helping you understand which plans deliver the best customer experience.
Plan Breakdown
5. Subscriber Lookup
The Subscriber Lookup page is a powerful search tool built into the dashboard. You can select any Subscriber ID from a dropdown menu and instantly view all the details for that subscriber. The fields displayed include Plan, Monthly Price, Status, Channel, Region, Industry, Lifetime Months, MRR, Total Revenue, Support Tickets, NPS Score, Last Activity, and Payment Method. This page is especially useful for customer support teams, account managers, and anyone who needs quick access to individual subscriber profiles without digging through raw data.
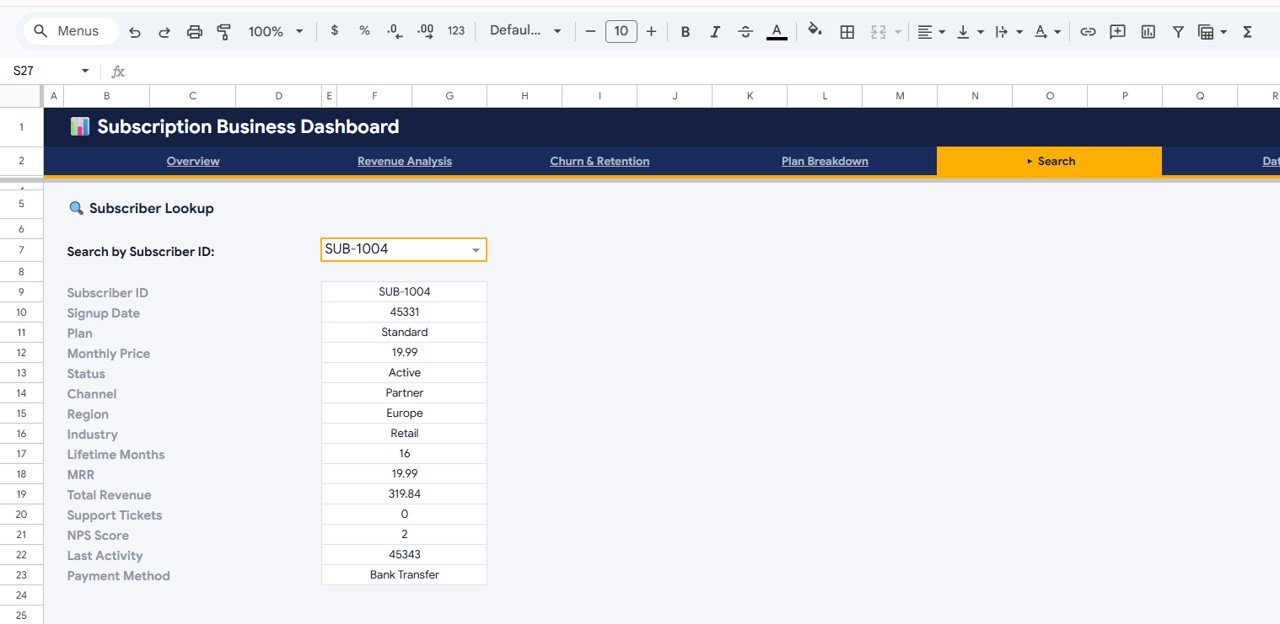
Search Sheet Tab
6. Data Sheet
The Data sheet is where all the raw subscription data lives. This is the only sheet you need to edit. Simply replace the sample data with your own subscription records, keeping the same column format, and every chart, KPI card, and analysis page in the dashboard will update automatically. The Data sheet supports fields like Subscriber ID, Plan, Monthly Price, Status, Channel, Region, Industry, Lifetime Months, MRR, Total Revenue, Support Tickets, NPS Score, Last Activity, and Payment Method.
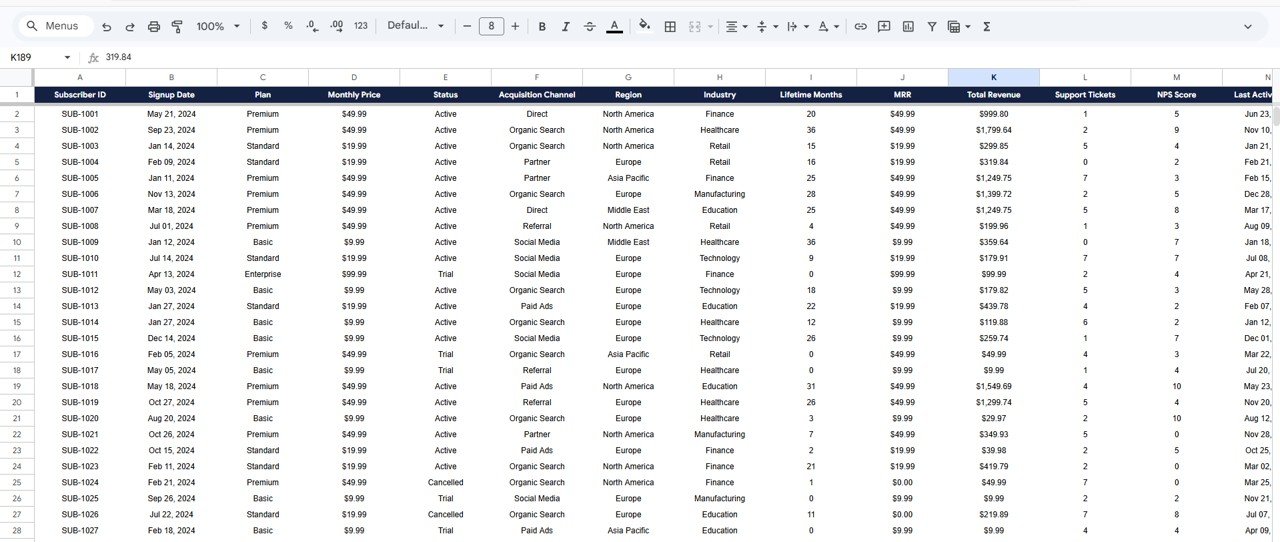
Data Sheet Tab
Advantages of Subscription Business Dashboard in Google Sheets
- All-in-One Subscription Analytics – Instead of juggling multiple tools or spreadsheets, this single template covers MRR, churn, revenue, plan performance, and subscriber details in 6 organized pages.
- Zero Learning Curve – No formulas to write, no scripts to run. Replace sample data and the dashboard works immediately.
- Cloud-Based and Collaborative – Built in Google Sheets, so you can access it from anywhere, share it with your team, and collaborate in real time.
- Professional Visualizations – Clean, well-designed charts and KPI cards that are presentation-ready for board meetings, investor updates, or team reviews.
- Cost-Effective Alternative – Get SaaS-grade subscription analytics without paying for expensive BI tools or analytics platforms.
Opportunities for Improvement
- Cohort Analysis – Adding a cohort-based retention analysis page would allow tracking of subscriber groups over time to identify when churn typically spikes.
- Automated Data Import – Integrating with Stripe, Chargebee, or Recurly via Google Apps Script could automate data refresh instead of manual paste.
- Forecasting Page – A predictive MRR forecast based on historical trends would add forward-looking planning capability.
- Custom Date Range Filters – Adding date-based slicers would allow analysis of specific time periods beyond the default full-data view.
Best Practices for Using This Subscription Dashboard
Click here to Purchase Subscription Business Dashboard in Google Sheets
- Update Data Weekly or Monthly – Regular data updates ensure your KPIs and charts reflect the latest business performance.
- Use Slicers for Segment Analysis – Apply filters on the Overview page to compare performance across plans, regions, or channels rather than just looking at aggregate numbers.
- Monitor Churn Trends Monthly – The Churn and Retention page is most valuable when reviewed on a regular cadence to spot early warning signs.
- Cross-Reference NPS with Churn – Compare the Average NPS by Plan data with churn rates to see if low satisfaction is driving cancellations.
- Use Subscriber Lookup for Support – Train your customer success team to use the Subscriber Lookup page for quick account context during support interactions.
Explore Relevant Templates
If you found this template useful, check out these related dashboards from NextGenTemplates:
- SaaS Metrics Dashboard in Google Sheets – Comprehensive SaaS metrics tracking with ARR, MRR, and customer acquisition cost analysis.
- Subscription Retention KPI Dashboard in Google Sheets – Focused retention tracking with KPI scorecards for subscription businesses.
- Etsy Seller Analytics Dashboard in Google Sheets – Track your Etsy store performance with revenue, orders, and product-level insights.
- Digital Marketing Campaign Dashboard in Google Sheets – Analyze your marketing campaigns with channel-level spend, ROI, and conversion tracking.
Browse our full collection of Google Sheets Dashboard Templates. Also check out our blog post on SaaS Metrics Dashboard in Google Sheets and Subscription Retention KPI Dashboard in Google Sheets for more subscription analytics insights.
Frequently Asked Questions
Click here to Purchase Subscription Business Dashboard in Google Sheets
What is the best Google Sheets template for tracking subscription business metrics?
The Subscription Business Dashboard in Google Sheets from NextGenTemplates is one of the best options available. It tracks 5 key KPIs including MRR, Total Revenue, and NPS Score, and provides dedicated analysis pages for revenue, churn, plan performance, and individual subscriber lookup — all in a single Google Sheets file with no coding required.
How do I track Monthly Recurring Revenue (MRR) in Google Sheets?
You can track MRR in Google Sheets by entering your subscription data into a structured spreadsheet and using formulas to sum monthly revenue by subscriber. The Subscription Business Dashboard in Google Sheets automates this process with built-in KPI cards and monthly trend charts that calculate MRR from your raw data automatically.
Can I use this subscription dashboard for a membership site?
Yes. The dashboard works for any recurring revenue model including SaaS products, subscription boxes, membership sites, and digital content platforms. As long as your data includes subscriber details, plan information, and revenue figures, the dashboard will generate all the analytics automatically.
What subscription KPIs should I track in my business?
The most important subscription KPIs include Monthly Recurring Revenue (MRR), churn rate, subscriber growth, average customer lifetime, Net Promoter Score (NPS), and revenue by plan or channel. The Subscription Business Dashboard in Google Sheets tracks all of these metrics across 6 interactive pages.
How does the Subscriber Lookup page work?
The Subscriber Lookup page uses a dropdown selector tied to your data. Select any Subscriber ID and the page instantly pulls all 14+ data fields for that person — including Plan, Monthly Price, Status, Region, Lifetime, MRR, Total Revenue, NPS Score, and Payment Method. It requires no formulas from you — everything is pre-built.
Do I need to install anything to use this Google Sheets dashboard?
No. The Subscription Business Dashboard runs entirely in Google Sheets using native formulas and charts. There are no macros, add-ons, or Google Apps Script installations required. Simply open the template via the copy link in your download, paste your data, and the dashboard updates instantly.
Conclusion
The Subscription Business Dashboard in Google Sheets is a powerful, no-code analytics solution for anyone running a subscription-based business. With 6 interactive pages, 5 KPI summary cards, deep-dive revenue and churn analysis, plan breakdowns, and a subscriber lookup tool, it gives you everything you need to understand and grow your recurring revenue. Whether you run a SaaS product, a subscription box, or a membership platform, this template helps you make data-driven decisions faster.
Click here to Purchase Subscription Business Dashboard in Google Sheets
Visit our YouTube channel for step-by-step video tutorials: Youtube.com/@NeoTechNavigators