Telecommunications Dashboard in HTML is an interactive, browser-based analytics solution for tracking network performance, customer metrics, revenue, and service quality with dynamic charts and filters.
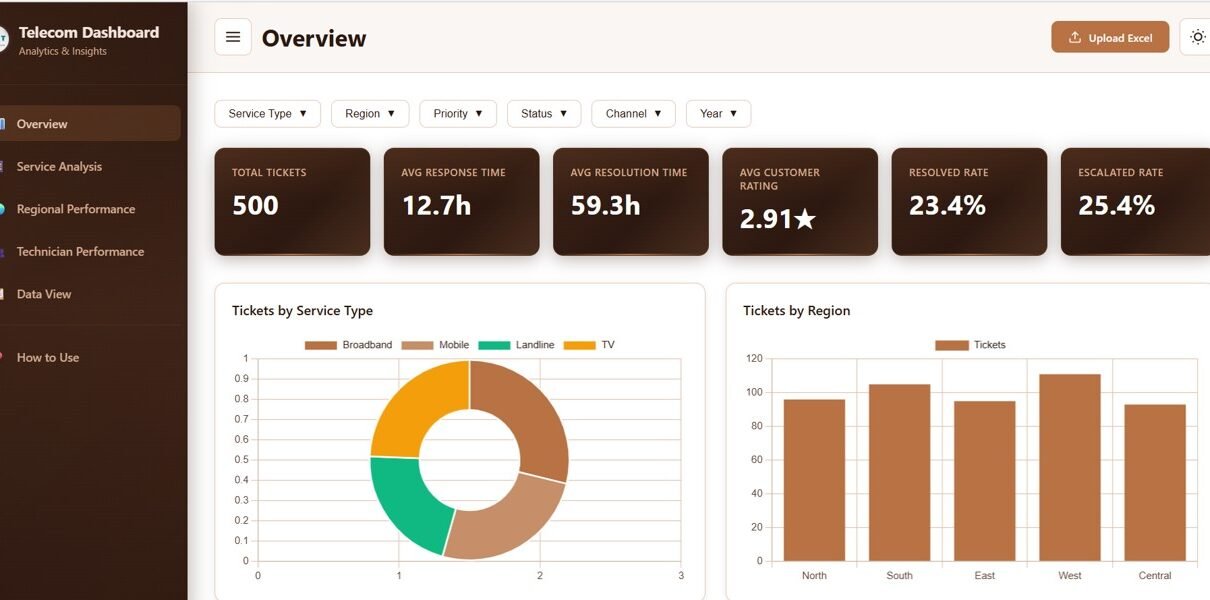
Online Tutorial for Data Analysis and Automation
Telecommunications Dashboard in HTML is an interactive, browser-based analytics solution for tracking network performance, customer metrics, revenue, and service quality with dynamic charts and filters.
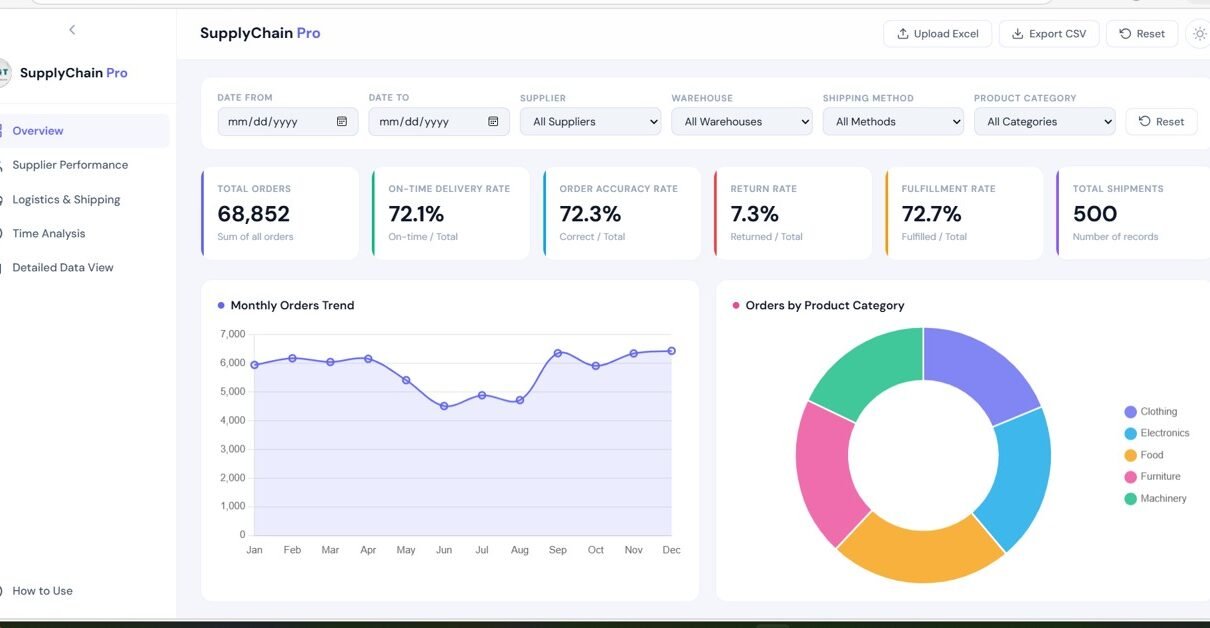
In today’s fast-paced business environment, managing supply chain operations efficiently is more important than ever. Companies deal with multiple suppliers, warehouses, shipping methods, and product categories. However, when this data is scattered across spreadsheets, it becomes difficult to gain meaningful insights. That’s exactly where the Supply Chain Analytics Dashboard in HTML comes in. This powerful, […]
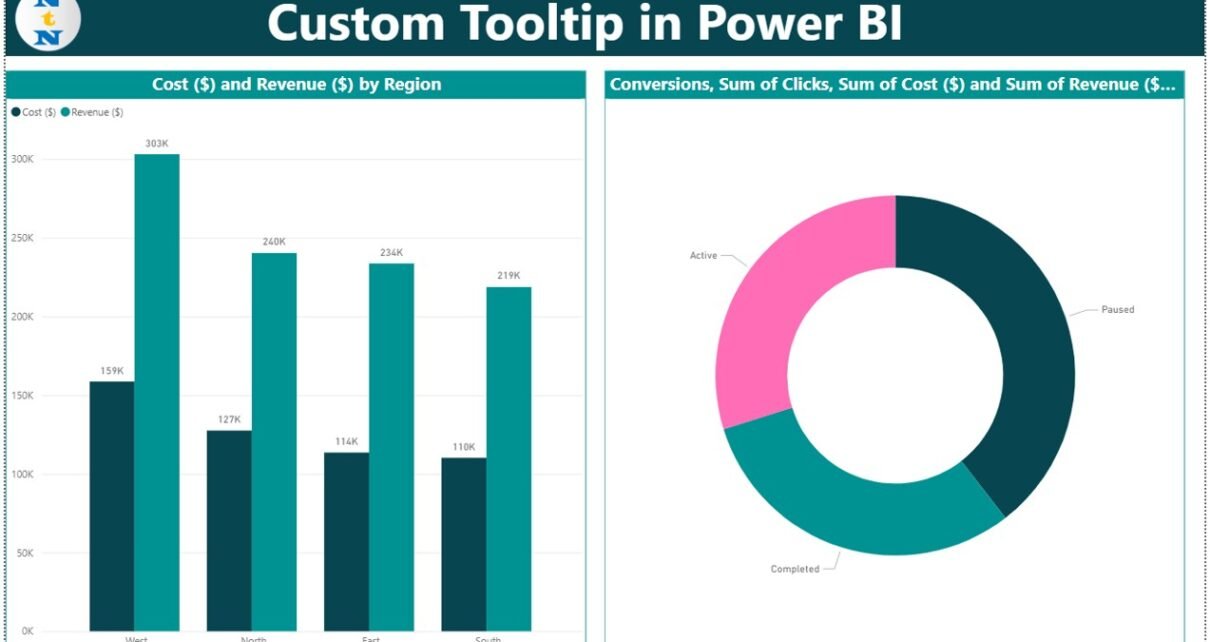
Tooltips in Power BI are more than just floating numbers. With custom tooltips, you can add meaningful visualizations that appear when a user hovers over any chart or graphic. This feature enables powerful storytelling without overwhelming your main report canvas.Custom Tooltip in Power BI In this blog post, we will explain what custom tooltips are, […]

In the world of data visualization, Microsoft Power BI has revolutionized the way users interact with their data. One powerful is Field Parameters in Power BI, which allow users to create dynamic reports and dashboards by switching between different fields in their visuals. Whether you’re a beginner or an experienced Power BI user, mastering Field […]