The Trucking and Logistics Dashboard in HTML is a browser-based analytics template that tracks 6 fleet KPIs across 5 interactive pages, powered by 13 dynamic charts and a searchable shipment data table with CSV export. Unzip the package, open index.html in any modern browser, replace the sample data with your own shipments, and the entire dashboard recalculates in under 5 minutes — no Excel, no Power BI, no login, no database.
🌍 Used by 8,400+ teams in 40+ countries, the Trucking and Logistics Dashboard in HTML replaces $30-$80/truck/month fleet SaaS subscriptions with a one-time $12.99 purchase.

Trucking and Logistics Dashboard Overview
Introduction
Trucking and logistics operations run on thin margins, and the difference between profit and loss often comes down to how quickly a dispatcher, broker, or owner can spot a slipping on-time rate, a fuel-hungry truck, or an underperforming lane. Traditional options — building a custom dashboard in Power BI, paying $30-$80 per truck per month for Samsara, or wrestling with Excel pivot tables — all come with friction: licenses, logins, hardware, or spreadsheets that break the moment data volume grows.
The Trucking and Logistics Dashboard in HTML takes a different route. It’s a single-folder, browser-based dashboard that runs on any laptop, tablet, or phone — offline, privately, and without any recurring fee. This post walks through what’s inside, how to use it, how it compares to paid alternatives, and who it’s built for.
Key Features of Trucking and Logistics Dashboard in HTML
The Trucking and Logistics Dashboard in HTML is a single-file analytics template with a small set of supporting assets — HTML, CSS, JavaScript, and a separate data file. Here are the core features:
- Browser-based: Works in Chrome, Edge, Firefox, and Safari on Windows, macOS, and Linux. No install, no login, no server.
- 6 executive KPI cards: Total Shipments, Total Revenue, Total Fuel Cost, On-Time Rate, Total Profit, and Average Weight (lbs).
- 5 interactive pages: Overview, Route Analysis, Driver Performance, Fleet and Finance, and Data View.
- 13 dynamic charts driven by client-side JavaScript — every chart recalculates when you change the data or a filter.
- Global slicers for cargo type, customer type, month, and delivery status — applied across every page simultaneously.
- Searchable data table with sort, pagination, and one-click CSV export of filtered rows.
- 100% offline and private: data never leaves your device. Ideal for regulated or confidential operations.
- Full source included: HTML, CSS, and JavaScript are unlocked and fully customizable.
- Responsive design: reflows on tablets and larger phones for on-the-road visibility.
- One-time $12.99 payment — no subscription, no per-user fees, lifetime access.
Dashboard Pages Explanation
The Trucking and Logistics Dashboard in HTML is organized into five purpose-built pages, each targeting a specific operational or financial question.
1. Overview Page
The Overview page is the first screen you see when you open index.html. At the top, six KPI cards summarize the health of the entire fleet: Total Shipments, Total Revenue, Total Fuel Cost, On-Time Rate, Total Profit, and Avg Weight (lbs). Below the cards, five charts provide a full operational snapshot:
- Revenue by Cargo Type — Ranks cargo categories (dry van, reefer, flatbed, tanker, etc.) by revenue contribution so you can see which product mix drives the business.
- Shipments by Status — Splits total shipments into Delivered, In Transit, Delayed, and Cancelled buckets for a quick service-level view.
- Monthly Revenue Trend — A 12-month line showing seasonality, growth trajectory, and any anomalous months that need investigation.
- Revenue by Customer Type — Groups revenue by customer segment (enterprise, SMB, direct shipper, broker-referred, etc.) so you can spot concentration risk.
- Top 10 Routes by Revenue — Ranks origin-destination lanes by revenue, instantly highlighting the routes worth protecting or scaling.
Slicers for cargo type, customer type, month, and delivery status sit at the top of the page and filter every chart and table on every page simultaneously.
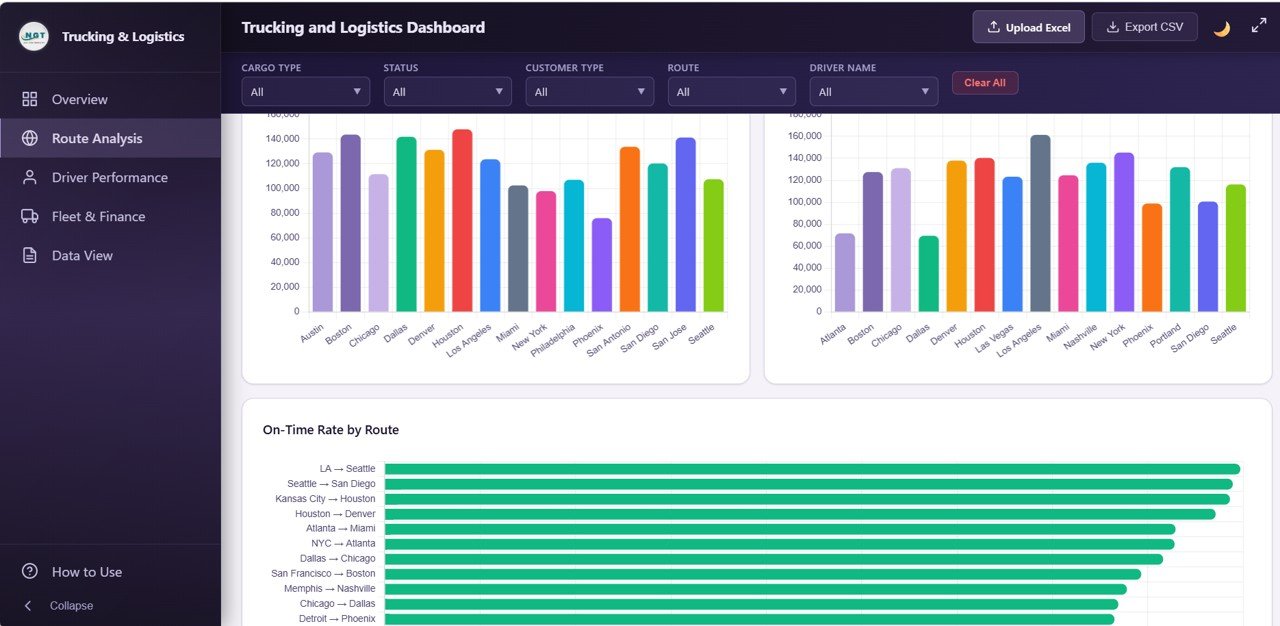
Route Analysis
2. Route Analysis
Built for dispatchers and route planners, the Route Analysis page answers lane-level questions: which routes are profitable, which origins feed the best margins, and which lanes are slipping on service level. The four charts are:
- Average Distance by Route — Useful for benchmarking fuel expectations and driver hours per lane.
- Revenue by Origin City — Shows which pickup locations drive the most revenue — critical when deciding where to place dedicated capacity.
- Revenue by Destination City — Highlights the best-paying drop-off markets, supporting backhaul and lane-pricing decisions.
- On-Time Rate by Route — Flags lanes where service is deteriorating so you can investigate traffic patterns, driver mix, or customer handoff issues.
Driver Performance
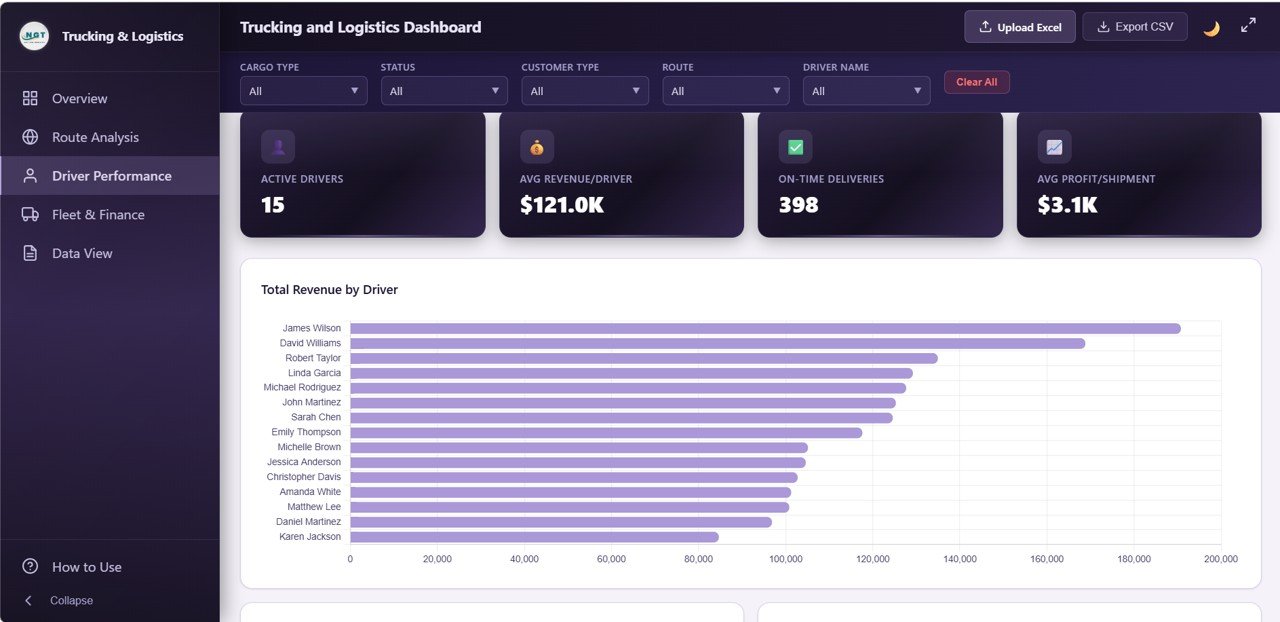
3. Driver Performance
Driver Performance is a fleet-manager page built around individual driver accountability. It includes four charts:
- Total Revenue by Driver — Ranks the roster by revenue generated, identifying top earners and lower-output drivers.
- On-Time Rate by Driver — Surfaces service-level leaders and drivers who need coaching or route reassignment.
- Avg Delivery Days by Driver — Compares delivery time efficiency across the team, controlling for lane when combined with the slicers.
- Shipment Count by Driver — Highlights workload imbalance and informs fair load assignment.
Fleet and Finance
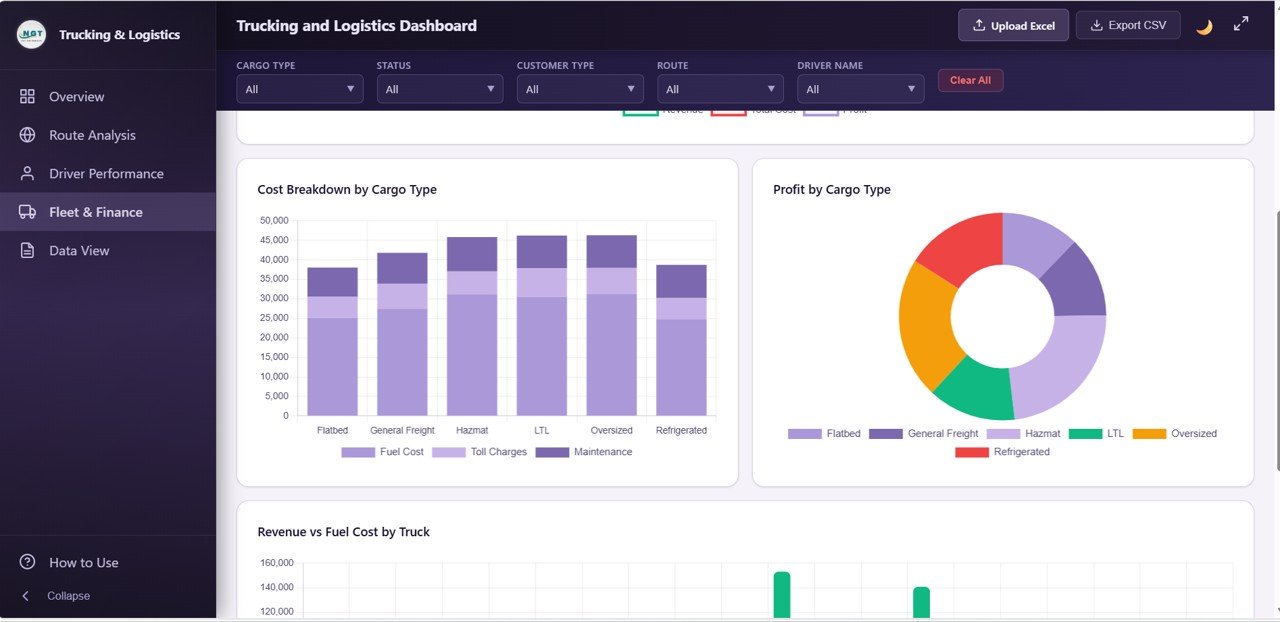
4. Fleet and Finance
Fleet and Finance is the CFO and owner page — the one that answers “are we actually making money?” Four charts tell the profitability story:
- Monthly Profit Trend — A 12-month line on profit (not just revenue), exposing months where costs outgrew revenue.
- Cost Breakdown by Cargo Type — Stacked view of fuel, toll, maintenance, and other costs per cargo category.
- Profit by Cargo Type — Paired with Revenue by Cargo Type on the Overview, this shows which categories are revenue-heavy but profit-thin.
- Revenue vs Fuel Cost by Truck — Identifies trucks burning margin on fuel relative to revenue — prime candidates for maintenance checks or route reassignment.
Data View tab
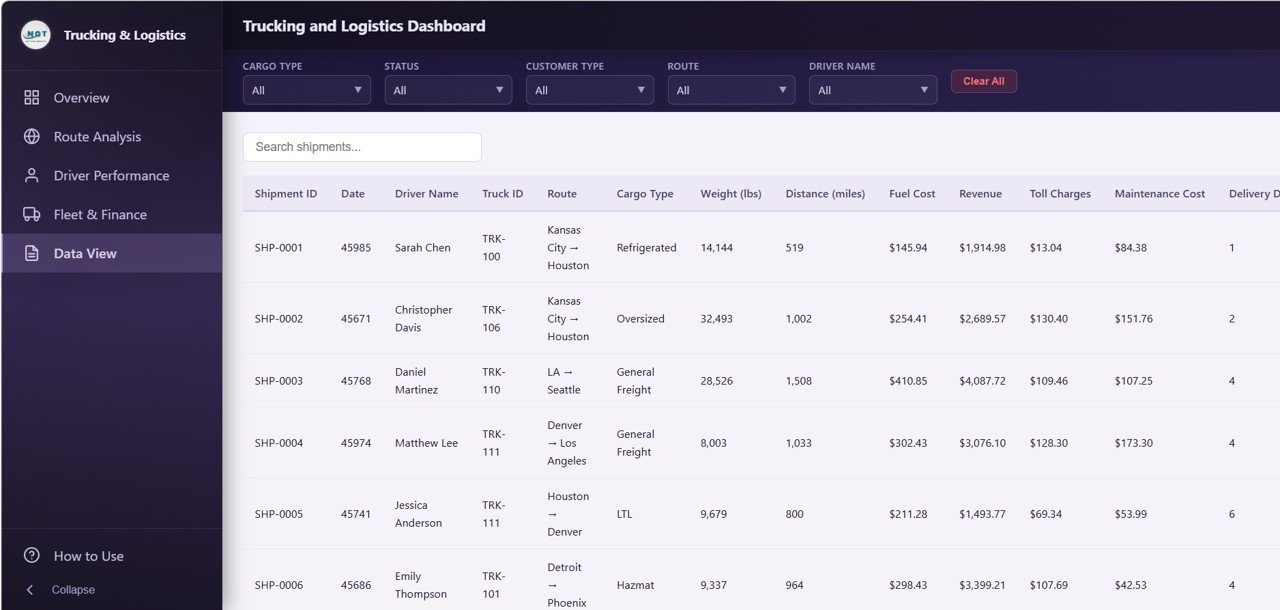
5. Data View
The Data View page is the detailed shipment-level table that powers the entire dashboard. Every record includes fields like Shipment ID, Origin City, Destination City, Driver Name, Truck ID, Cargo Type, Customer Type, Distance, Weight, Delivery Days, Status, Revenue, Fuel Cost, and Profit. It supports:
- Instant text search across every column
- Column sort ascending and descending
- Pagination so 10,000+ rows remain responsive
- CSV export of the currently filtered rows — perfect for audits, carrier invoicing, and driver payroll
Trucking and Logistics Dashboard in HTML vs. Standalone SaaS Dashboard vs. Fleet Management Software — Feature Comparison
| Feature | Trucking and Logistics Dashboard in HTML | Standalone SaaS Dashboard (Metabase Cloud / Geckoboard) | Fleet Management SaaS (Samsara / Motive) |
|---|---|---|---|
| Cost | $12.99 one-time | $50-$200 / user / month | $30-$80 / truck / month |
| Platform | Any browser — no install | Cloud-hosted, login required | Cloud + ELD hardware |
| Setup time | Under 5 minutes | 1-2 weeks | 2-6 weeks (hardware) |
| Works offline | ✅ | ❌ | ❌ |
| Data privacy | ✅ 100% local | Stored on vendor servers | Stored on vendor servers |
| Mobile responsive | ✅ | ✅ | ✅ |
| CSV export | ✅ | ✅ (paid tiers) | Limited |
| Year-1 cost (10 trucks) | $12.99 | $3,000-$12,000 | $3,600-$9,600 |
| Source code included | ✅ | ❌ | ❌ |
For owner-operators, small fleets, and logistics analysts who want live charts without paying per user or per truck, the Trucking and Logistics Dashboard in HTML sits in the sweet spot.
Who Should Use This Template
✅ Perfect for:
- Owner-operators and small trucking companies (1-50 trucks)
- Freight brokers and 3PL analysts reviewing route profitability
- Logistics consultants delivering client dashboards without custom development
- Operations managers at manufacturers or retailers tracking carrier performance
- Data analysts and MBA students needing a trucking analytics portfolio piece
❌ Not a fit if:
- You run a 500+ truck enterprise fleet needing ELD compliance and real-time GPS
- You need SOC 2, SSO, role-based permissions, or multi-user concurrent editing
- You want a dashboard embedded inside a production web app with live database connections
Real-World Use Cases
Rajesh owns a 12-truck regional trucking business in Ohio. Every month he exports his shipment log, pastes it into the data file, and opens index.html. Within two minutes he can tell which of his four drivers hit the best on-time rate, which routes are eating fuel margin, and whether monthly profit is trending up — all without paying $720 per month for a full telematics subscription.
Priya is a freight broker managing 30 carrier partners. She uses the Trucking and Logistics Dashboard in HTML every Friday to benchmark revenue per route, identify her top 10 revenue-generating lanes, and flag origin cities where on-time rate has dropped below 90%. She filters the Data View page by underperforming lanes and emails a CSV export to her operations team to take action.
Marcus is a supply chain analyst at a $200M mid-market distributor. He uses the Data View page to audit carrier invoices, sort by delivery days and fuel cost, and export filtered rows into his monthly carrier scorecard. The HTML dashboard replaced a $150/month Geckoboard subscription that only offered static KPIs — and his CFO now has a filterable view instead of a frozen report.
Advantages of Trucking and Logistics Dashboard in HTML
- Cost savings of 95-99% compared to per-truck SaaS platforms over a 12-month horizon.
- No vendor lock-in — you own the source code and your data forever.
- Runs anywhere — on a laptop, tablet, USB stick, or internal network drive.
- Private by design — shipment records, customer names, and pricing never leave your device.
- Customizable — add charts, rename KPIs, change colors, or embed inside your own intranet page.
- Fast feedback loop — edit data, hit refresh, see results. No pivot table rebuild, no Power BI refresh timeout.
Opportunities for Improvement
In the interest of a balanced assessment, a few areas where the Trucking and Logistics Dashboard in HTML is not the right tool:
- No real-time GPS or ELD integration. If you need minute-by-minute truck location or regulatory hours-of-service tracking, you still need a telematics SaaS like Samsara or Motive.
- Single-user editing model. Because data lives in a local file, there’s no built-in multi-user sync. Teams that need concurrent editing should pair this with shared storage or move to Google Sheets.
- No automated alerts. The dashboard is a viewer — not an alerting system. Add a scheduled email or Slack alert separately if you need proactive notifications.
- Chart library fixed. Charts are pre-built; adding new visualizations requires basic HTML/CSS/JavaScript knowledge.
Best Practices
- Standardize your shipment data schema before loading — consistent cargo type, status, and customer type values make the slicers far more useful.
- Refresh monthly at minimum. Weekly is better for brokerages and high-volume fleets.
- Use the filters, then export. Filter to the specific driver, month, or route you care about, then export to CSV for payroll, invoicing, or executive reports.
- Back up the data file separately from the dashboard files. Your historical shipment data is the real asset.
- Customize colors to your brand — editing the CSS takes minutes and instantly makes the dashboard client-presentable.
- Pair with a telematics tool if you need real-time GPS; use this dashboard for weekly and monthly analysis where rich cross-filtering matters.
Explore Relevant Templates
🚚 Trucking and Logistics Dashboard in Excel — The Excel version of this dashboard with pivot-powered charts for desktop users.
🚚 Trucking and Logistics Dashboard in Power BI — A Power BI edition for teams standardized on Microsoft Fabric.
🚚 Trucking and Logistics Dashboard in Google Sheets — A cloud-based Google Sheets version with shared editing and a Shipment Lookup search sheet.
🚚 Fleet Management Dashboard in HTML — A broader fleet analytics dashboard covering vehicle health and maintenance.
🚚 Supply Chain Analytics Dashboard in HTML — End-to-end supply chain KPI tracker in a single HTML dashboard.
🚚 Browse the full HTML Dashboard Templates collection for more browser-based dashboards.
Frequently Asked Questions
What is the Trucking and Logistics Dashboard in HTML?
The Trucking and Logistics Dashboard in HTML is a browser-based analytics template with 5 interactive pages, 6 KPI cards, and 13 dynamic charts for tracking shipments, revenue, fuel cost, on-time rate, driver performance, and fleet profitability. It runs entirely in a web browser with no server, no login, and no subscription.
Do I need a web server or any special software to use this dashboard?
No. The Trucking and Logistics Dashboard in HTML runs 100% client-side. Just unzip and open index.html in any modern browser. No web server, no Node.js, no database, and no internet connection is required after the initial download.
How do I load my own shipment data?
Open the included data file in a text editor or Excel, replace the sample rows with your own shipment records while keeping the column headers intact, and save. Refresh the dashboard in your browser and every chart and KPI recalculates automatically.
How does this compare to Samsara or Geckoboard?
The Trucking and Logistics Dashboard in HTML is a one-time $12.99 purchase, while Samsara and Motive charge $30-$80 per truck per month and Geckoboard charges per user. It is ideal for analysis and reporting — for real-time GPS and ELD hours-of-service, a telematics SaaS is still required.
Can I customize the dashboard for my brand?
Yes. All HTML, CSS, and JavaScript source is included and fully unlocked. You can edit colors, fonts, chart types, add your company logo, rename KPIs, or add entirely new charts. Basic web development knowledge is helpful for deeper changes.
Will this work on mobile devices?
Yes. The Trucking and Logistics Dashboard in HTML is responsive and reflows on tablets and larger phones. Dispatchers and owners can check on-time rate and profit from the road in any modern mobile browser.
Is my shipment data secure?
Yes. The dashboard runs entirely on your device. Shipment records, customer names, and pricing never leave your computer and are never sent to any third-party server — ideal for confidential or regulated operations.
About the Author
Built by PK — Microsoft Certified Professional with 15+ years of Excel, Google Sheets, Power BI, and HTML dashboard experience. Founder of NextGenTemplates, reaching 300K+ subscribers across YouTube channels. Every template is hand-built and tested before release.
Conclusion
For owner-operators, freight brokers, logistics analysts, and small-fleet managers, the Trucking and Logistics Dashboard in HTML delivers genuine operational visibility without subscriptions, installations, or learning curves. Five purpose-built pages, thirteen charts, global slicers, and a searchable data table cover the full trucking analytics workflow — from executive overview to driver coaching to CFO-grade profitability review.
👉 Click here to Purchase the Trucking and Logistics Dashboard in HTML
✅ Instant download · One-time payment · No subscription · Works offline · Full source code included.
🎥 Visit YouTube.com/@NeoTechNavigators for step-by-step HTML dashboard tutorials.
📅 Last updated: April 2026