The world of medical research relies heavily on precision, transparency, and efficiency. From tracking clinical trial timelines to analyzing funding utilization, every metric contributes to better outcomes and accountability. The Medical Research KPI Dashboard in Google Sheets is designed to provide a comprehensive, real-time view of performance indicators across all research activities — in a simple, automated, and visually engaging format.Medical Research KPI Dashboard in Google Sheets
This ready-to-use dashboard helps research organizations, medical institutions, and pharmaceutical teams monitor performance across projects, departments, and funding streams without the need for complex tools or coding.Medical Research KPI Dashboard in Google Sheets
What Is a Medical Research KPI Dashboard in Google Sheets?
A Medical Research KPI Dashboard in Google Sheets is a dynamic data management and visualization tool that consolidates key metrics — such as research funding, publication count, ethical compliance, and clinical trial progress — into one centralized platform.
It simplifies the process of monitoring Month-to-Date (MTD) and Year-to-Date (YTD) performance against set targets and previous year’s data.
Through color-coded visuals, conditional formatting, and automatic trend tracking, users can instantly identify successes and improvement areas.
Dashboard Structure
Click to Buy Medical Research KPI Dashboard in Google Sheets
The Medical Research KPI Dashboard is organized into six interconnected worksheets, each serving a unique analytical function:
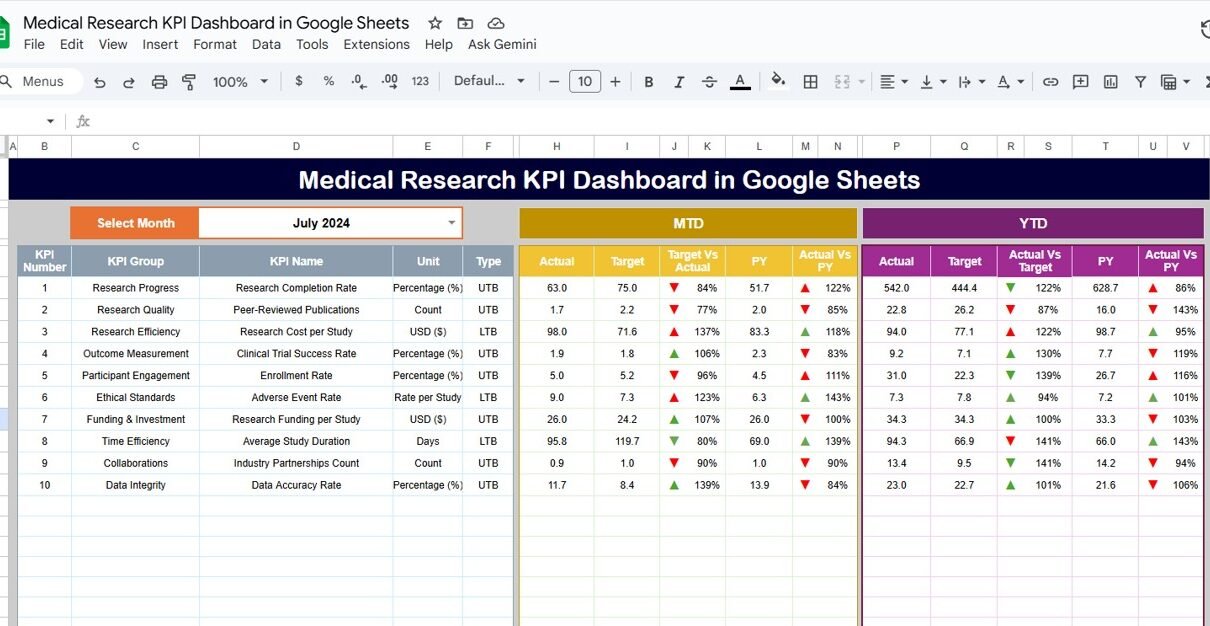
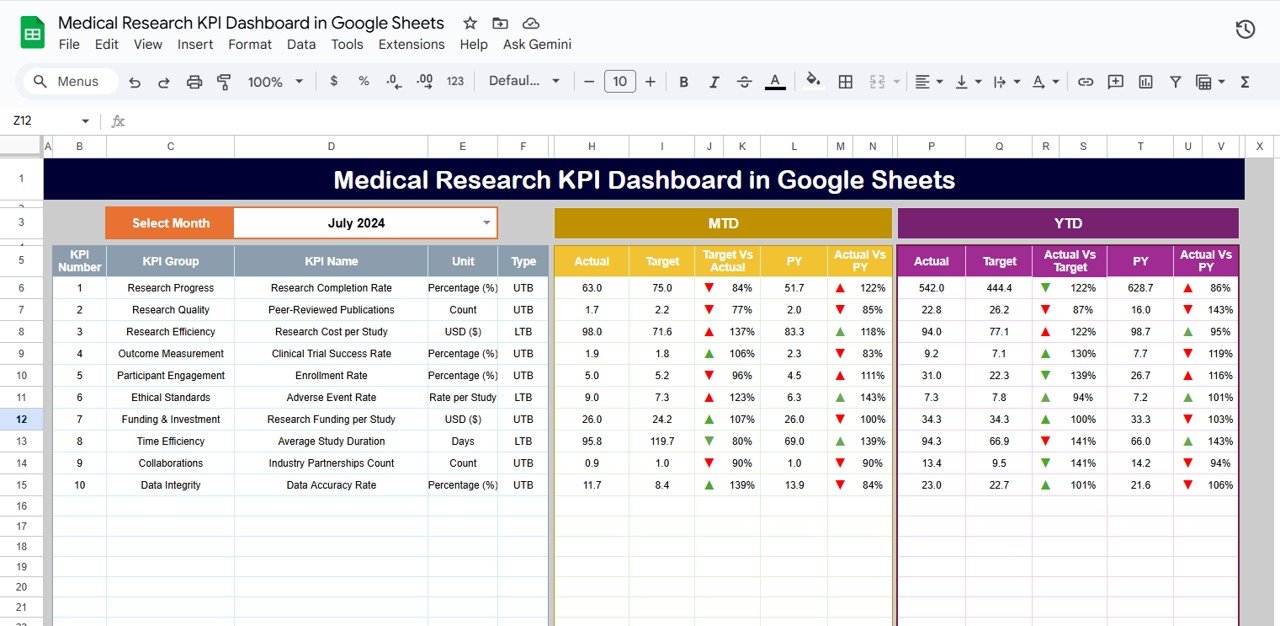
Dashboard Sheet Tab
This is the main summary page of the dashboard, where all performance indicators are displayed in visual cards and comparison tables.
-
The Month Selector (cell D3) allows users to switch between months easily.
-
All MTD and YTD values are updated automatically based on the selected month.
-
Color indicators (green/red) and up/down arrows show performance versus target and previous year.
Click to Buy Medical Research KPI Dashboard in Google Sheets
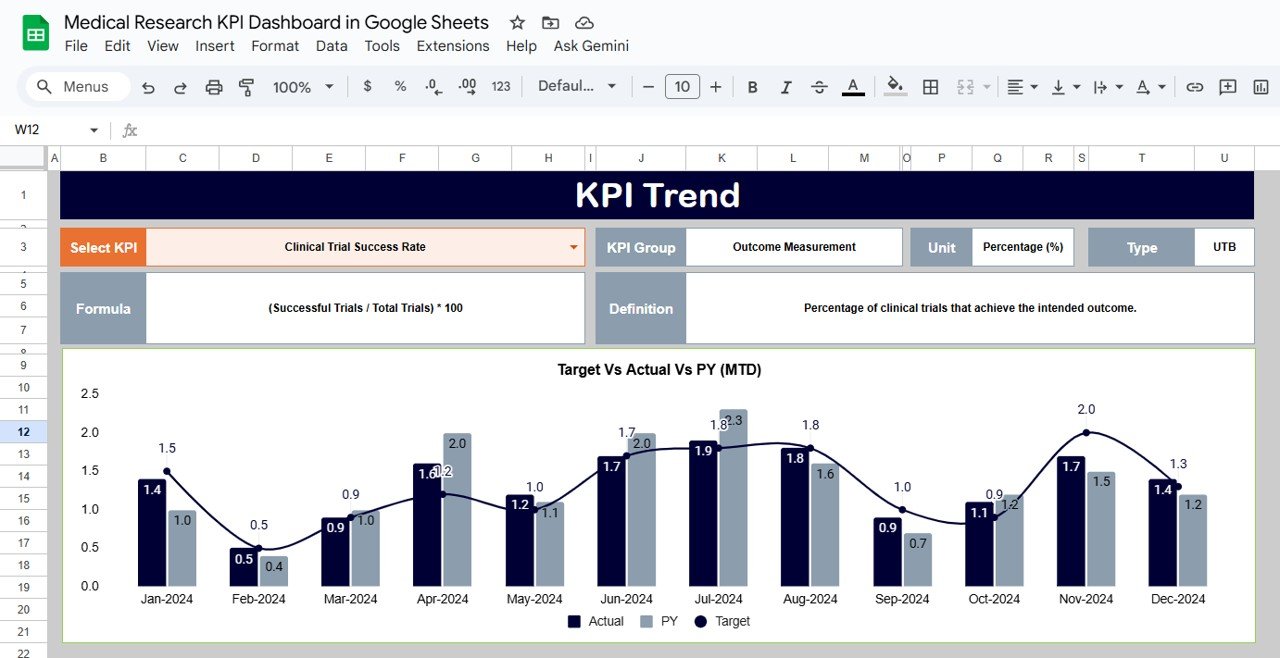
KPI Trend Sheet Tab
The KPI Trend Sheet provides an analytical view of each KPI’s performance over time.
-
Select the KPI name from the dropdown in Range C3.
-
View its KPI Group, Unit, Formula, Definition, and Type (UTB/LTB).
-
Graphical trendlines display MTD and YTD movement across months for deeper analysis.
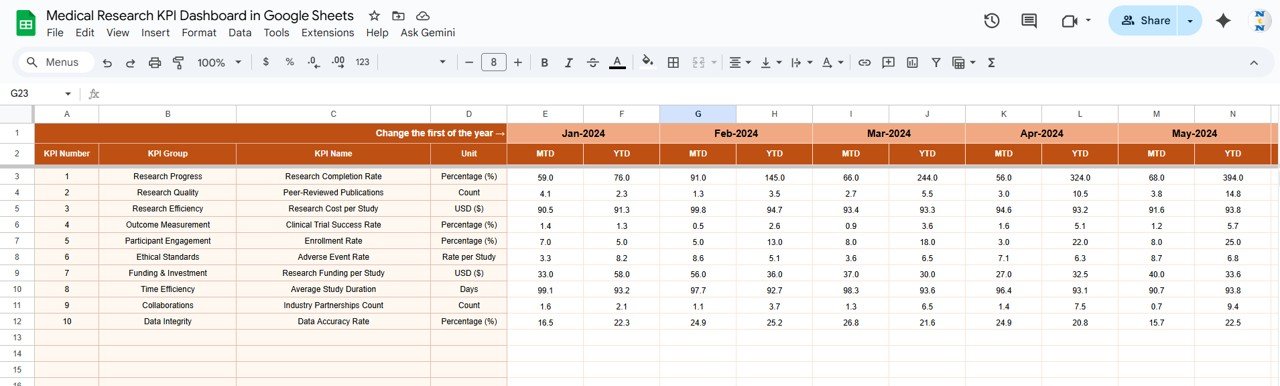
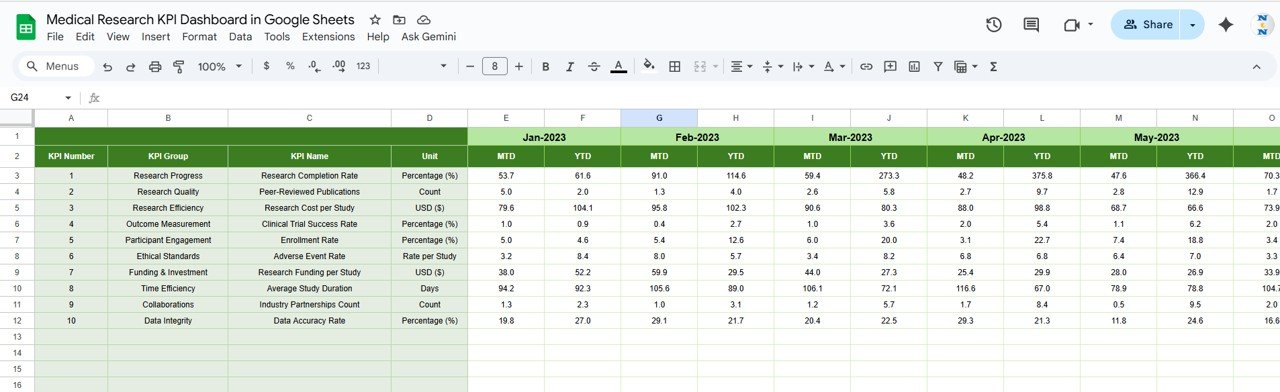
Actual Number Sheet Tab
This sheet contains actual values for each KPI, both MTD and YTD.
-
Users can input the month in Range E1 to update reporting automatically.
-
The sheet captures the data used for real-time comparison in the dashboard.
Click to Buy Medical Research KPI Dashboard in Google Sheets
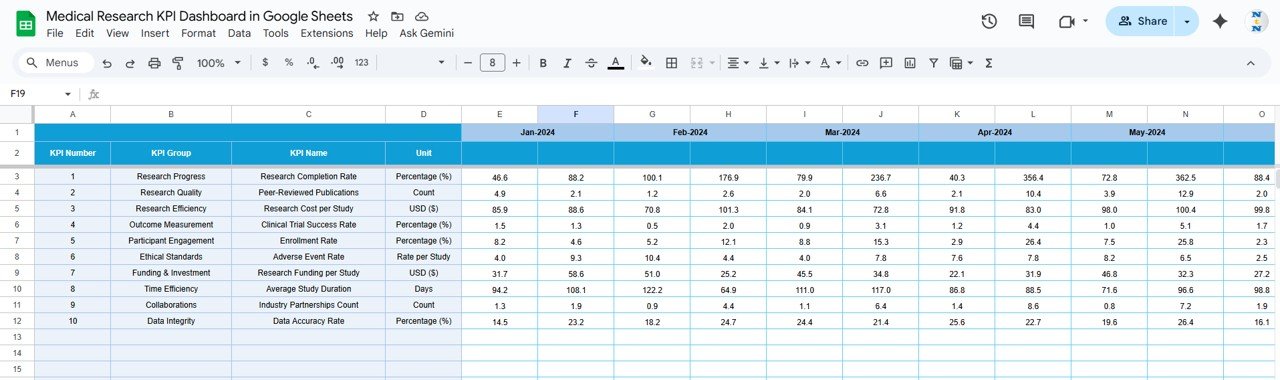
Target Sheet Tab
Here, users define monthly and yearly targets for all KPIs.
These targets serve as benchmarks for evaluating performance in the main dashboard.
Previous Year Number Sheet Tab
Stores previous year’s actual data for each KPI, allowing year-over-year analysis to identify long-term trends and improvements.
Click to Buy Medical Research KPI Dashboard in Google Sheets
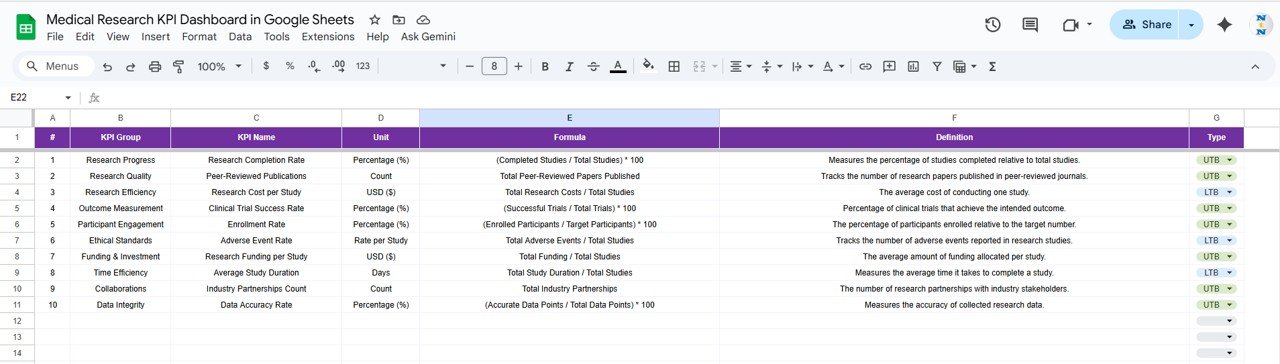
KPI Definition Sheet Tab
This tab provides complete KPI documentation, including KPI name, category, formula, definition, unit, and whether a higher or lower value indicates better performance.
Advantages of the Medical Research KPI Dashboard
-
🧾 Comprehensive Monitoring: Tracks everything from funding to publication success.
-
⚙️ Automated Updates: Data updates dynamically for every selected month.
-
📈 Performance Comparison: Highlights progress vs. targets and previous year.
-
🧩 Collaboration Ready: Google Sheets makes it accessible to teams across departments.
-
💡 Transparency & Reporting: Ideal for management reviews, funding agencies, and audit reporting.
Opportunities for Improvement
Click to Buy Medical Research KPI Dashboard in Google Sheets
-
Add automated reminders for ethical review renewals using Google Apps Script.
-
Include project-level Gantt charts for timeline visualization.
-
Connect with Google Forms for real-time data submission from researchers.
-
Introduce KPIs by Department or Researcher for detailed accountability.
-
Integrate impact visualization for research outcomes and social reach.
Best Practices
-
Update KPI data monthly to ensure accurate tracking.
-
Maintain consistent project naming and classification across sheets.
-
Review ethical compliance and funding utilization quarterly.
-
Protect formula cells to prevent unintentional changes.
-
Use conditional icons and filters for quick performance visualization.
Conclusion
Click to Buy Medical Research KPI Dashboard in Google Sheets
The Medical Research KPI Dashboard in Google Sheets is a practical, insightful, and interactive tool designed to help research organizations streamline project management, optimize funding, and ensure compliance — all within a single, cloud-based platform.
With automated calculations, trend analysis, and visually intuitive reports, this dashboard empowers decision-makers to achieve operational excellence and accelerate scientific innovation.
Visit our YouTube channel to learn step-by-step video tutorials
Youtube.com/@NeotechNavigators
Watch the step-by-step video Demo:
Click to Buy Medical Research KPI Dashboard in Google Sheets