As industries shift toward sustainability, monitoring renewable material performance becomes vital for tracking progress and environmental impact. The Renewable Material KPI Dashboard in Google Sheets offers a complete performance management system to measure efficiency, waste reduction, renewable sourcing, and cost-effectiveness — all in one interactive file.Renewable Material KPI Dashboard in Google Sheets
This ready-to-use dashboard simplifies KPI tracking for organizations aiming to increase their use of renewable materials and reduce their environmental footprint through structured, automated analytics.Renewable Material KPI Dashboard in Google Sheets
What Is a Renewable Material KPI Dashboard in Google Sheets?
Click to Buy Renewable Material KPI Dashboard in Google Sheets
The Renewable Material KPI Dashboard is a data visualization and performance tracking tool that consolidates renewable material usage, cost efficiency, waste metrics, and sustainability performance indicators into a single interface.Renewable Material KPI Dashboard in Google Sheets
It is built entirely in Google Sheets and provides Month-to-Date (MTD) and Year-to-Date (YTD) comparisons of actual vs. target vs. previous year data — all automatically updated through formulas and conditional formatting.Renewable Material KPI Dashboard in Google Sheets
Whether you’re managing material procurement, supply chain efficiency, or environmental compliance, this dashboard offers real-time insights at a glance.
Dashboard Structure
This KPI dashboard consists of six structured worksheets:
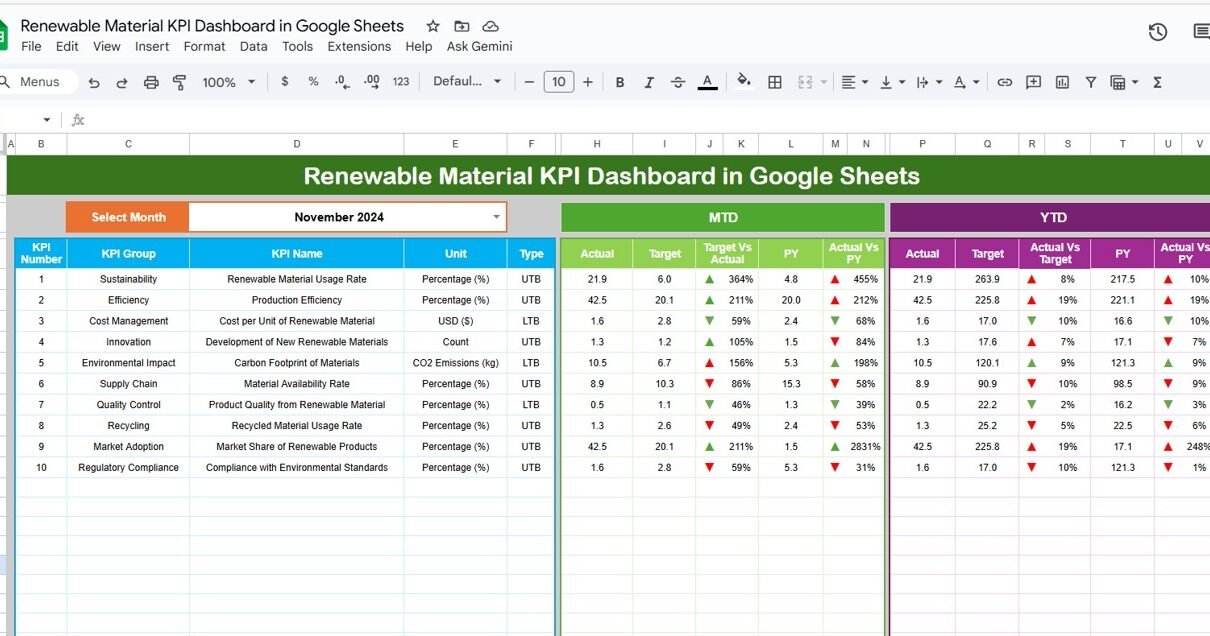
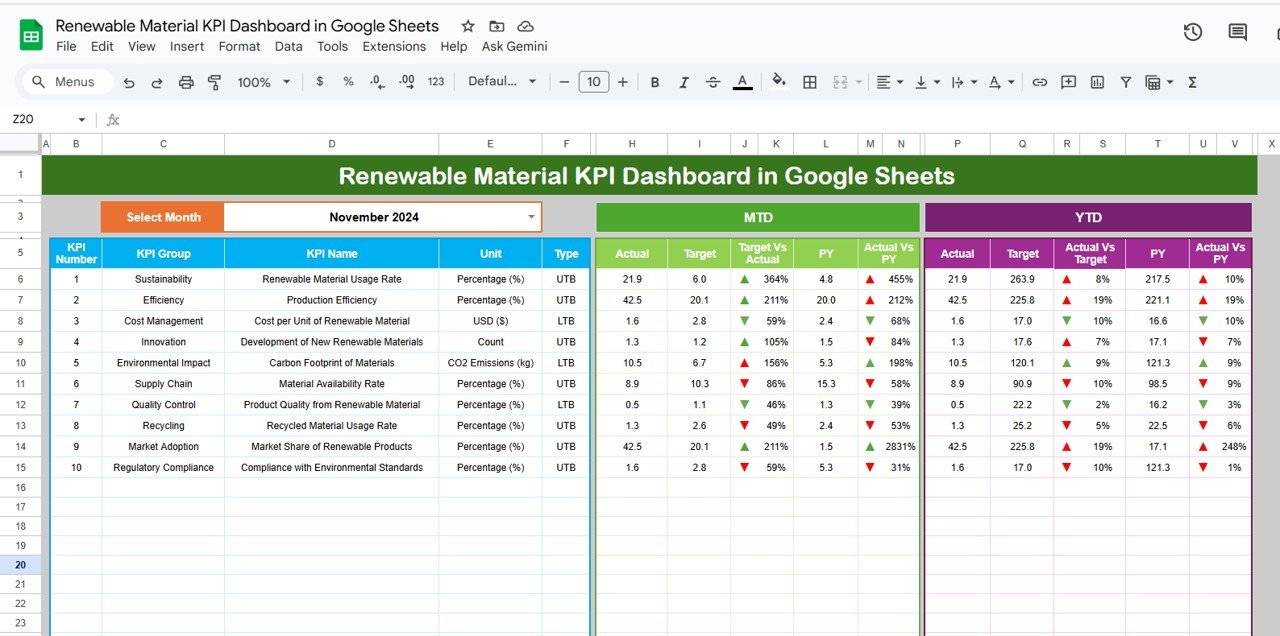
Dashboard Sheet Tab
The main visualization tab summarizes all critical KPIs in an intuitive layout.
-
A month selector (cell D3) lets users toggle months easily.
-
Displays both MTD and YTD performance automatically.
-
Uses conditional arrows and colors (green ↑ for improvement, red ↓ for decline) to visualize performance vs. target and previous year.
KPI Cards Displayed:
-
Total Renewable Material Used (tons)
-
Renewable Material Percentage (%)
-
Recycled Content Ratio (%)
-
Material Waste (%)
-
Energy Usage per Unit (kWh/unit)
-
CO₂ Emissions (tons)
-
Procurement Cost per Ton ($)
-
Supplier Compliance (%)
-
Cost Savings through Renewable Sourcing ($)
-
Sustainability Rating (Index)
Click to Buy Renewable Material KPI Dashboard in Google Sheets
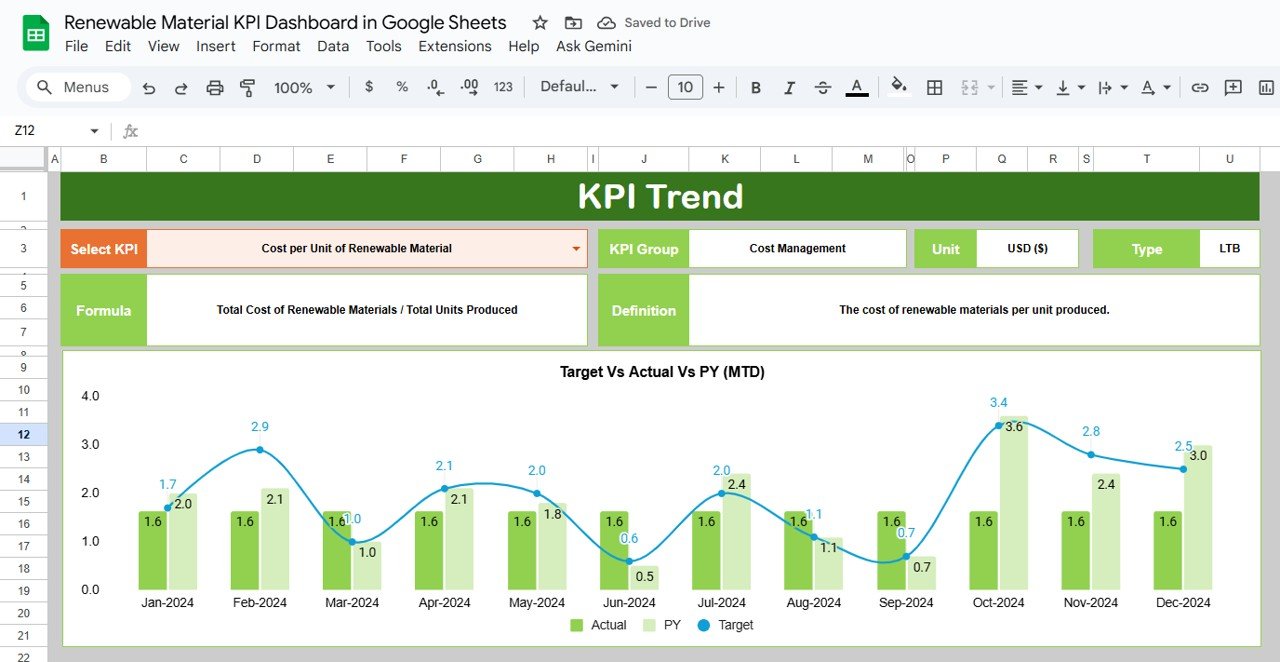
KPI Trend Sheet Tab
This tab allows users to analyze performance trends for each KPI over time.
-
Select the KPI from a dropdown in Range C3.
-
Displays KPI Group, Unit, Type (UTB/LTB), Formula, and Definition.
-
Includes MTD/YTD trend charts to evaluate long-term performance.
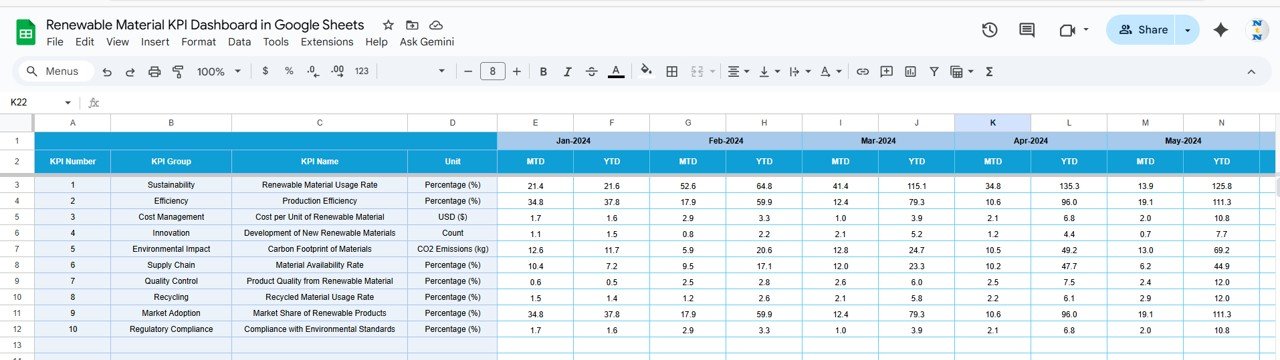
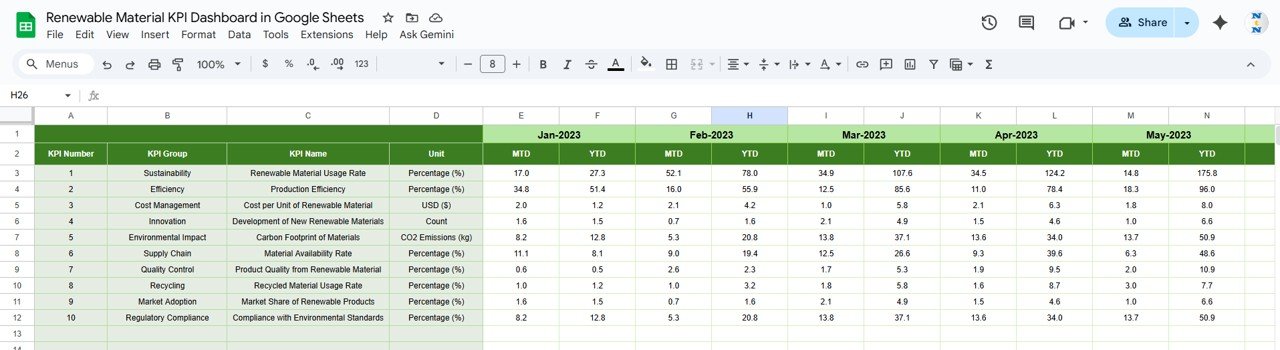
Actual Number Sheet Tab
This is the data entry sheet for monthly performance inputs.
-
Enter MTD and YTD actuals for each KPI.
-
Adjust the current month using cell E1 to refresh dashboard results.
Click to Buy Renewable Material KPI Dashboard in Google Sheets
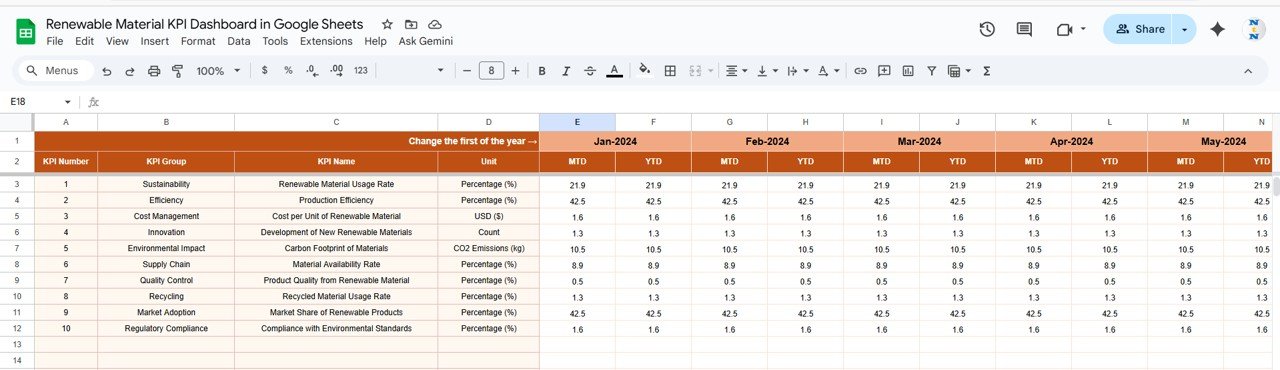
Target Sheet Tab
Here, users input target values for every KPI — both MTD and YTD.
Targets are automatically compared with actual values to calculate achievement percentages.
Previous Year Number Sheet Tab
This sheet holds previous year’s data, enabling side-by-side YoY analysis.
Click to Buy Renewable Material KPI Dashboard in Google Sheets
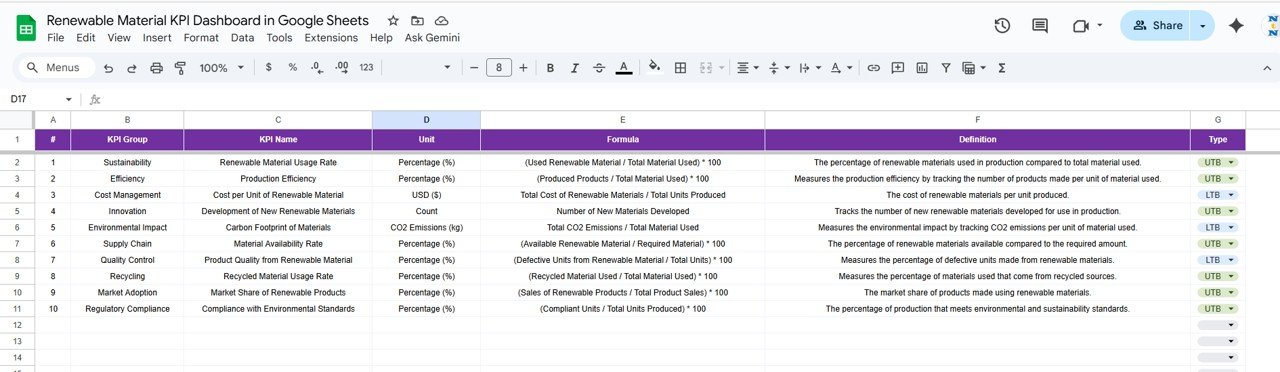
KPI Definition Sheet Tab
A detailed listing of all KPIs — including group, unit, formula, definition, and performance direction — ensures clarity for all users.
Advantages
-
🌿 Comprehensive Sustainability Tracking: Measures renewable usage, energy, waste, and carbon impact.
-
⚙️ Automated Calculations: No manual formulas needed — everything updates dynamically.
-
📊 Performance Benchmarking: Compares actuals with targets and previous year data.
-
☁️ Collaborative Platform: Works across departments in Google Sheets.
-
💰 Cost & Efficiency Optimization: Tracks both environmental and financial KPIs.
Opportunities for Improvement
Click to Buy Renewable Material KPI Dashboard in Google Sheets
-
Add real-time emission tracking with IoT or external APIs.
-
Introduce forecasting models for future renewable material needs.
-
Incorporate supplier-level analytics to improve sourcing transparency.
-
Add regional KPIs for sustainability reporting.
-
Automate email alerts when key KPIs fall below thresholds.
Best Practices
-
Update actual and target data monthly.
-
Keep units consistent (e.g., tons, kWh).
-
Use dropdowns for supplier and region entries to reduce data errors.
-
Conduct quarterly reviews for energy and emission KPIs.
-
Backup data regularly for audit and compliance reporting.
Conclusion
Click to Buy Renewable Material KPI Dashboard in Google Sheets
The Renewable Material KPI Dashboard in Google Sheets is an essential sustainability tool that enables businesses to measure renewable material efficiency, waste reduction, compliance, and cost-effectiveness in one interactive environment.
It empowers organizations to make informed, eco-conscious decisions that align with environmental goals and corporate sustainability strategies.
Visit our YouTube channel to learn step-by-step video tutorials
Youtube.com/@NeotechNavigators
Watch the step-by-step video Demo:
Click to Buy Renewable Material KPI Dashboard in Google Sheets