Organizations today operate in a highly regulated environment where compliance performance directly influences risk exposure, audit readiness, and overall business stability. Tracking compliance tasks manually leads to delays, errors, and increased risk.Compliance Operations & Risk Insights Dashboard in Google Sheets
The Compliance Operations & Risk Insights Dashboard in Google Sheets provides a complete, ready-to-use solution to monitor compliance activities, identify risks early, and improve operational governance. This dashboard turns raw compliance data into smart, real-time insights through KPI cards, automated charts, and department-wise analysis.Compliance Operations & Risk Insights Dashboard in Google Sheets
What Is a Compliance Operations & Risk Insights Dashboard in Google Sheets?
A Compliance Operations & Risk Insights Dashboard is a centralized monitoring tool designed to help organizations track compliance performance across departments, priorities, and compliance areas.Compliance Operations & Risk Insights Dashboard in Google Sheets
Built in Google Sheets, this dashboard gives real-time visibility into deadlines, compliance performance, urgency levels, and risk indicators — without the need for expensive compliance software.
It is ideal for:
-
Compliance & Risk Management Teams
-
Internal Audit Departments
-
Quality Assurance Teams
-
IT Security and Operations Departments
-
HR, Legal, Finance Compliance Units
Overview Sheet Tab
Click to Buy Compliance Operations & Risk Insights Dashboard in Google Sheets
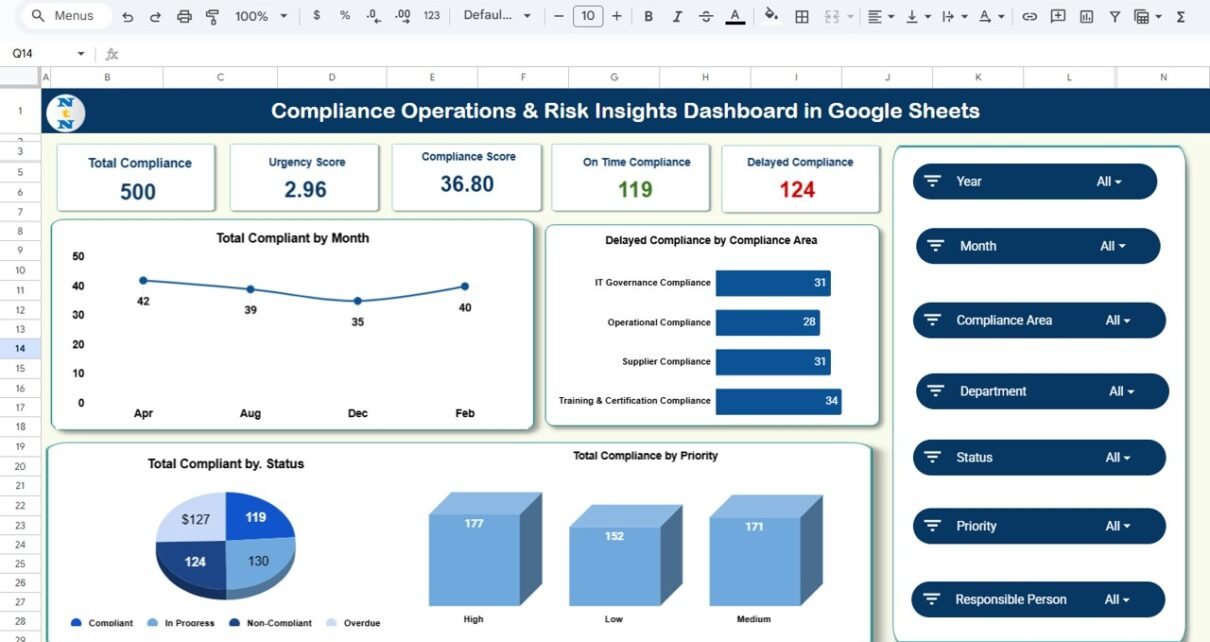
The Overview Sheet Tab provides high-level compliance insights to help organizations quickly assess their overall compliance health.
KPI Cards
The dashboard displays the following KPIs at the top:
-
Total Compliance – Total number of compliance tasks or items tracked.
-
Urgency Score – Average urgency level across all compliance activities.
-
Compliance Score – A performance indicator based on timely and quality completion.
-
On Time Compliance – Count of compliance tasks completed within deadline.
-
Delayed Compliance – Number of tasks that missed their due date.
These KPIs immediately highlight whether risk is increasing or under control.
Overview Dashboard Charts
The Overview Tab also includes essential charts for a quick performance scan:
Total Compliance by Month
Shows month-by-month compliance workload and completion volume.
Delayed Compliance by Compliance Area
Visualizes which compliance categories (HR, IT Security, Finance, Legal, Safety, etc.) are experiencing the most delays — a critical risk indicator.
Total Compliance by Priority
Breaks down compliance tasks into High, Medium, and Low priority.
Total Compliance by Status
Tracks statuses such as:
-
Completed
-
In Progress
-
Delayed
-
Pending
-
Rejected
This helps management assess the operational risk level across the organization.

Click to Buy Compliance Operations & Risk Insights Dashboard in Google Sheets
Compliance Analysis
This tab provides compliance performance insights broken down by Compliance Area.
Charts Included:
-
Total Compliance by Compliance Area
-
On Time Compliance by Compliance Area
-
Compliance Score by Compliance Area
-
Average Urgency Score by Compliance Area
This analysis helps identify high-risk zones and underperforming compliance categories.

Click to Buy Compliance Operations & Risk Insights Dashboard in Google Sheets
Department Analysis
Each department contributes differently to compliance performance. This tab highlights department-level insights.
Charts Included:
-
Total Compliance by Department
-
On Time Compliance by Department
-
Compliance Score by Department
These visuals help compliance leaders understand department-specific performance — enabling targeted training or escalations.

Click to Buy Compliance Operations & Risk Insights Dashboard in Google Sheets
Priority Analysis
Priority plays a major role in assessing risk and workload planning.
Charts Included:
-
Total Compliance by Priority
-
On Time Compliance by Priority
-
Compliance Score by Priority
High-priority compliance tasks are often tied to risk and regulatory deadlines.
This analysis helps ensure they are not falling behind.

Monthly Trends
The Monthly Trends tab explains how compliance performance changes over time.
Charts Included:
-
Total Compliance by Month
-
On Time Compliance by Month
-
Compliance Score by Month

Monthly Trends
Click to Buy Compliance Operations & Risk Insights Dashboard in Google Sheets
Search Tab
The Search Tab helps users quickly locate compliance records.

Data Sheet Tab
The Data Sheet contains all compliance records and drives every metric in the dashboard.
Typical Columns Include:
- Compliance ID
- Compliance Area
- Department
- Priority
- Responsible Person
- Due Date
- Completion Date
- Status (On Time, Delayed, In Progress, etc.)
- Compliance Score
- Urgency Score
- Notes / Description
Updating this sheet automatically refreshes all charts and summary tables in the dashboard.

Click to Buy Compliance Operations & Risk Insights Dashboard in Google Sheets
Advantages of the Compliance Operations & Risk Insights
Dashboard
-
Real-time monitoring of compliance tasks
-
Department-wise and area-wise risk insights
-
Early identification of delayed and high-risk compliance tasks
-
KPI-based evaluation of operational compliance health
-
Easy-to-understand charts for reporting and meetings
-
Cloud-based collaboration across teams and departments
-
Completely customizable and scalable
-
No additional software cost — built entirely on Google Sheets
Opportunities for Improvement
Click to Buy Compliance Operations & Risk Insights Dashboard in Google Sheets
You can enhance this dashboard with the following optional features:
-
Automated email alerts for upcoming due dates or delayed tasks
-
Google Forms integration for compliance updates submitted through forms
-
Risk Severity Index combining urgency, priority, and delay impact
-
Compliance Calendar View with color-coded deadlines
-
Audit Document Links directly attached to each compliance record
-
Trend predictions using simple forecasting formulas
Best Practices for Compliance Management
-
Update compliance tasks regularly to maintain accuracy
-
Avoid inconsistent naming across departments
-
Use conditional formatting to highlight overdue tasks
-
Analyze monthly trends to improve future performance
-
Maintain detailed notes for audit trails
-
Conduct compliance meetings using dashboard visuals
-
Review high-priority and delayed items weekly
-
Assign clear ownership for each compliance area
Conclusion
Click to Buy Compliance Operations & Risk Insights Dashboard in Google Sheets
The Compliance Operations & Risk Insights Dashboard in Google Sheets is a robust tool for managing compliance tasks and understanding organizational risk. With real-time KPIs, automated charts, and department-wise insights, it empowers compliance teams to act quickly, improve efficiency, and maintain strong regulatory alignment.
It is the perfect, cost-effective solution for organizations that want clarity, visibility, and control over their compliance operations.
Frequently Asked Questions (FAQ)
1. Can this dashboard replace compliance software?
Yes — for small to medium organizations, this dashboard covers most compliance needs.
2. Can I add more KPIs related to risk?
Absolutely. You can add risk severity, probability score, and impact level.
3. Does it support multiple departments?
Yes, you can track unlimited departments, areas, and tasks.
4. Can this be used for internal audits?
Yes — use the Search tab and trends for audit preparation.
5. Does the dashboard update automatically?
Yes, all charts refresh instantly when you enter or modify data.
Visit our YouTube channel to learn step-by-step video tutorials
Youtube.com/@NeotechNavigators
Click to Buy Compliance Operations & Risk Insights Dashboard in Google Sheets