Compliance is one of the most important pillars of operational integrity in any enterprise. From regulatory requirements to internal policies, organizations must ensure that every compliance task is completed accurately and on time. However, tracking hundreds of compliance activities manually can lead to delays, missed deadlines, and audit failures.Enterprise Compliance Management Dashboard in Google Sheets
The Enterprise Compliance Management Dashboard in Google Sheets solves this problem with a structured, automated, and visual solution. It provides real-time visibility into compliance performance, helping teams identify risks early, improve accountability, and maintain full regulatory alignment.Enterprise Compliance Management Dashboard in Google Sheets
Get the Enterprise Compliance Management Dashboard in Google Sheets
In this article, we explain the complete dashboard, its features, analysis sections, best practices, and frequently asked questions — making it your go-to guide for enterprise compliance tracking.Enterprise Compliance Management Dashboard in Google Sheets
What Is an Enterprise Compliance Management Dashboard in Google Sheets?
An Enterprise Compliance Management Dashboard is a centralized monitoring system that helps organizations track compliance tasks across departments, priorities, and compliance areas.
This ready-to-use Google Sheets dashboard includes KPI cards, automated charts, searchable data, and detailed analysis tabs, allowing compliance teams to measure performance accurately and efficiently.
It is ideal for:
-
Compliance Managers
-
Risk Management Teams
-
Internal Audit Departments
-
HR & Legal Teams
-
Operations & Quality Assurance
Overview Sheet Tab
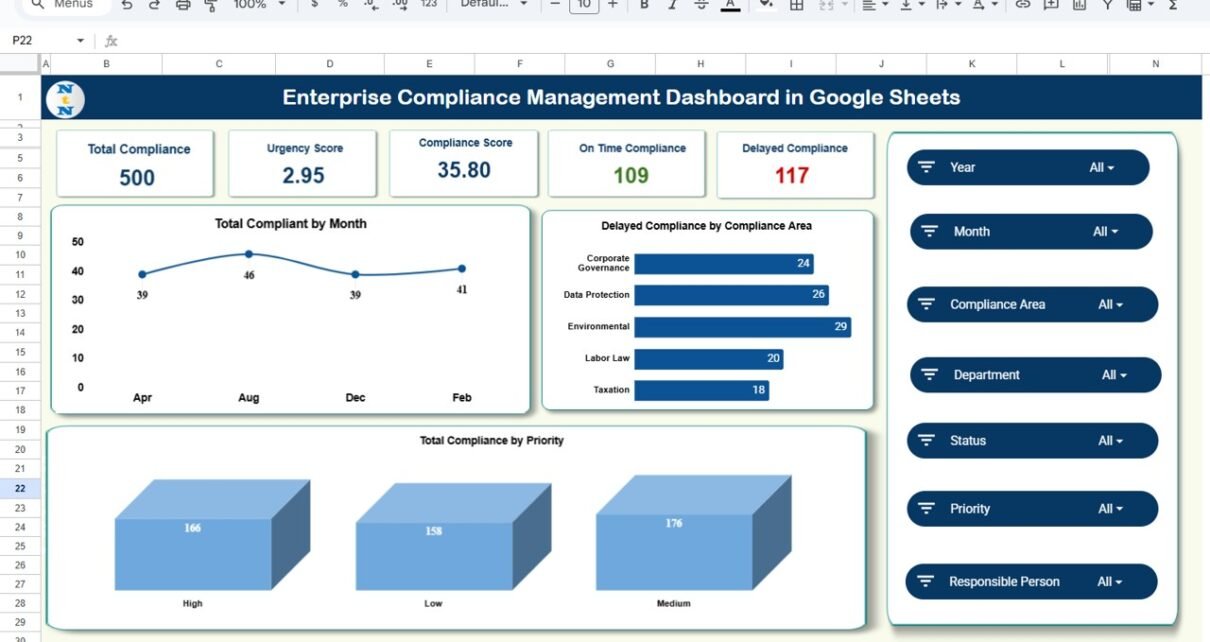
The Overview sheet tab provides a complete snapshot of enterprise-wide compliance performance.
KPI Cards
At the top of the dashboard, the following KPIs offer quick insights:
-
Total Compliance – Total number of compliance tasks recorded.
-
Urgency Score – Indicates the level of urgency across compliance tasks.
-
Compliance Score – Average score based on compliance success and completion quality.
-
On Time Compliance – Total number of compliance tasks completed within deadline.
-
Delayed Compliance – Tasks that missed their due date.
These KPIs help leadership quickly assess organizational health and risk exposure.
Overview Dashboard Charts
The dashboard visualizes key compliance trends through interactive charts:
1️⃣ Total Compliance by Month
Shows month-wise compliance activity and helps identify peak workload periods.
2️⃣ Total Compliance by Priority
Highlights the volume of High, Medium, and Low priority compliance items.
3️⃣ Delayed Compliance by Compliance Area
Displays which compliance categories (Safety, Finance, HR, IT Security, etc.) are facing delays — crucial for risk mitigation.

Compliance Analysis
This section focuses on evaluating compliance performance by category or compliance area.
Charts Included:
-
Total Compliance by Compliance Area
-
On Time Compliance by Compliance Area
-
Compliance Score by Compliance Area
You can easily spot high-performing areas and compliance zones with recurring delays.

Department Analysis
This section helps you understand compliance distribution and performance across departments.
Charts Included:
-
Total Compliance by Department
-
On Time Compliance by Department
-
Compliance Score by Department
This is especially useful for identifying departments that require training or additional resources.

Priority Analysis
Priority plays a major role in risk management. This section analyzes compliance based on urgency levels.
Charts Included:
-
Total Compliance by Priority
-
On Time Compliance by Priority
-
Compliance Score by Priority
This helps organizations ensure that high-priority compliance issues are not falling behind.

Monthly Trends
The Monthly Trends tab highlights overall performance trends over time.
Charts Included:
-
Total Compliance by Month
-
On Time Compliance by Month
-
Compliance Score by Month
This long-term view helps with forecasting, planning, and annual compliance reviews.

Search Tab
The Search tab allows users to quickly locate specific compliance records.
You can search by:
-
Compliance ID
-
Compliance Area
-
Department
-
Responsible Person
-
Priority
-
Status
-
Month
This feature improves audit preparation, internal reviews, and reporting workflows.

Data Sheet Tab
The Data sheet tab is the foundation of the dashboard. All compliance tasks are recorded here.
Typical fields include:
- Compliance ID
- Compliance Area
- Priority
- Department
- Responsible Person
- Due Date
- Completion Date
- On Time / Delayed Status
- Compliance Score
- Urgency Score
- Notes / Description
Updating this sheet automatically reflects changes across all charts and KPIs.
Advantages of Using This Compliance Dashboard
-
Centralized Compliance Monitoring
-
Improved Visibility Across Departments
-
Quick Identification of Delays or High-Risk Areas
-
Interactive Dashboards with Real-Time Updates
-
Search and Filter for Fast Audits
-
Better Planning with Trend Analysis
-
100% Customizable and Cloud-Based
-
Cost-Effective — No Paid Software Needed
Opportunities for Improvement
You can enhance this dashboard further with additional features:
-
Automated Email Alerts for upcoming or overdue compliance tasks.
-
Google Forms Integration for collecting compliance updates from teams.
-
Severity Level Indicator separate from priority score.
-
Compliance Calendar View for better planning.
-
Attachment Links to evidence documents or audit reports.
-
Heatmaps for visualizing high-risk compliance areas.
Best Practices for Compliance Tracking
-
Update compliance tasks daily or weekly.
-
Use consistent naming for compliance areas and departments.
-
Review delay patterns every month.
-
Maintain backup copies monthly.
-
Assign clear responsible persons for each compliance task.
-
Use conditional formatting to highlight overdue items.
-
Train departments on how to update their compliance logs.
-
Share view-only dashboards with leadership teams.
Want to build compliance dashboards like this yourself? The Excel Pivot Tables & Dashboards course on NextGenTemplates Academy covers the reporting and charting skills involved, with practice files.
Get the Enterprise Compliance Management Dashboard in Google Sheets
Conclusion
The Enterprise Compliance Management Dashboard in Google Sheets is a powerful, flexible, and structured tool that simplifies compliance oversight. With real-time insights into urgency scores, compliance scores, delays, and departmental performance, it empowers organizations to make informed decisions and stay compliant with regulatory standards.Enterprise Compliance Management Dashboard in Google Sheets
If your goal is to strengthen compliance transparency, reduce risk, and improve accountability across departments — this dashboard is the perfect solution.Enterprise Compliance Management Dashboard in Google Sheets
Frequently Asked Questions (FAQ)
1. Can this dashboard support multiple departments?
Yes, it is designed to track compliance across all departments in an organization.
2. Can multiple users update the dashboard at once?
Yes, Google Sheets allows real-time collaboration.
3. Can I add more KPIs like severity or financial impact?
Absolutely — the dashboard is fully customizable.
4. Can this be used for internal audits?
Yes, the Search feature and trend charts make it ideal for audit preparation.
5. Does it automatically calculate On Time vs Delayed?
Yes, formulas calculate status based on due date and completion date.