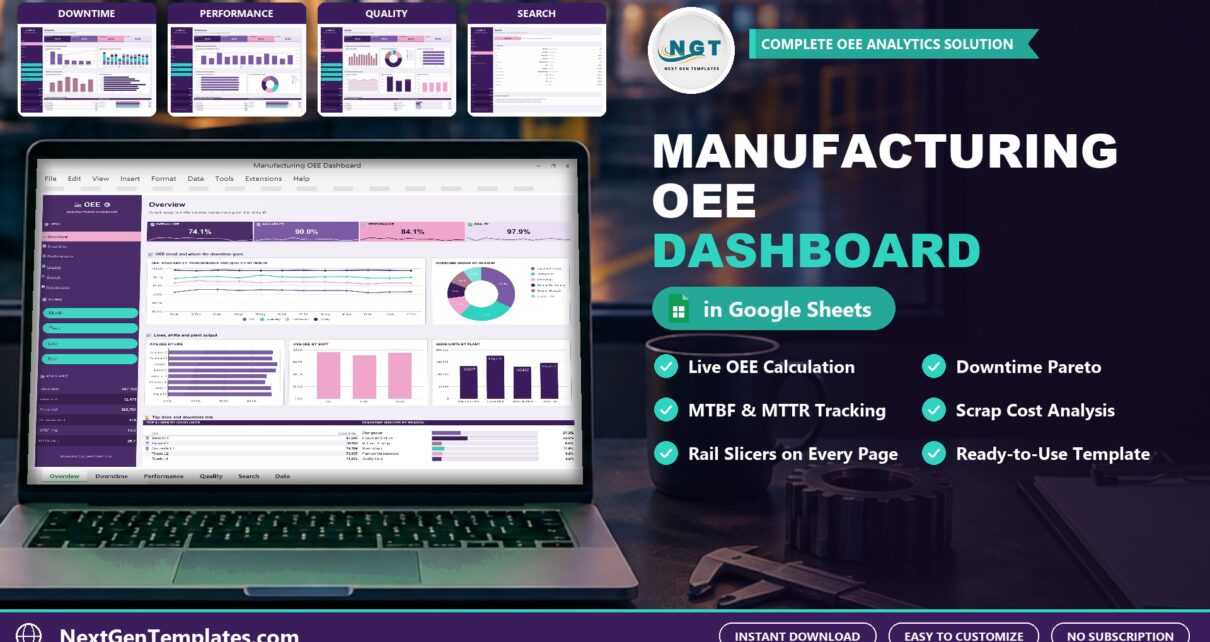
Overall equipment effectiveness, or OEE, is the single number that tells you how much of your planned production time is truly productive. This post walks through the Manufacturing OEE Dashboard in Google Sheets, a ready-made template that calculates OEE from your shift records and shows where the losses are.
Watch the Manufacturing OEE Dashboard in Google Sheets: Track Downtime, Scrap and OEE walkthrough
What OEE Measures
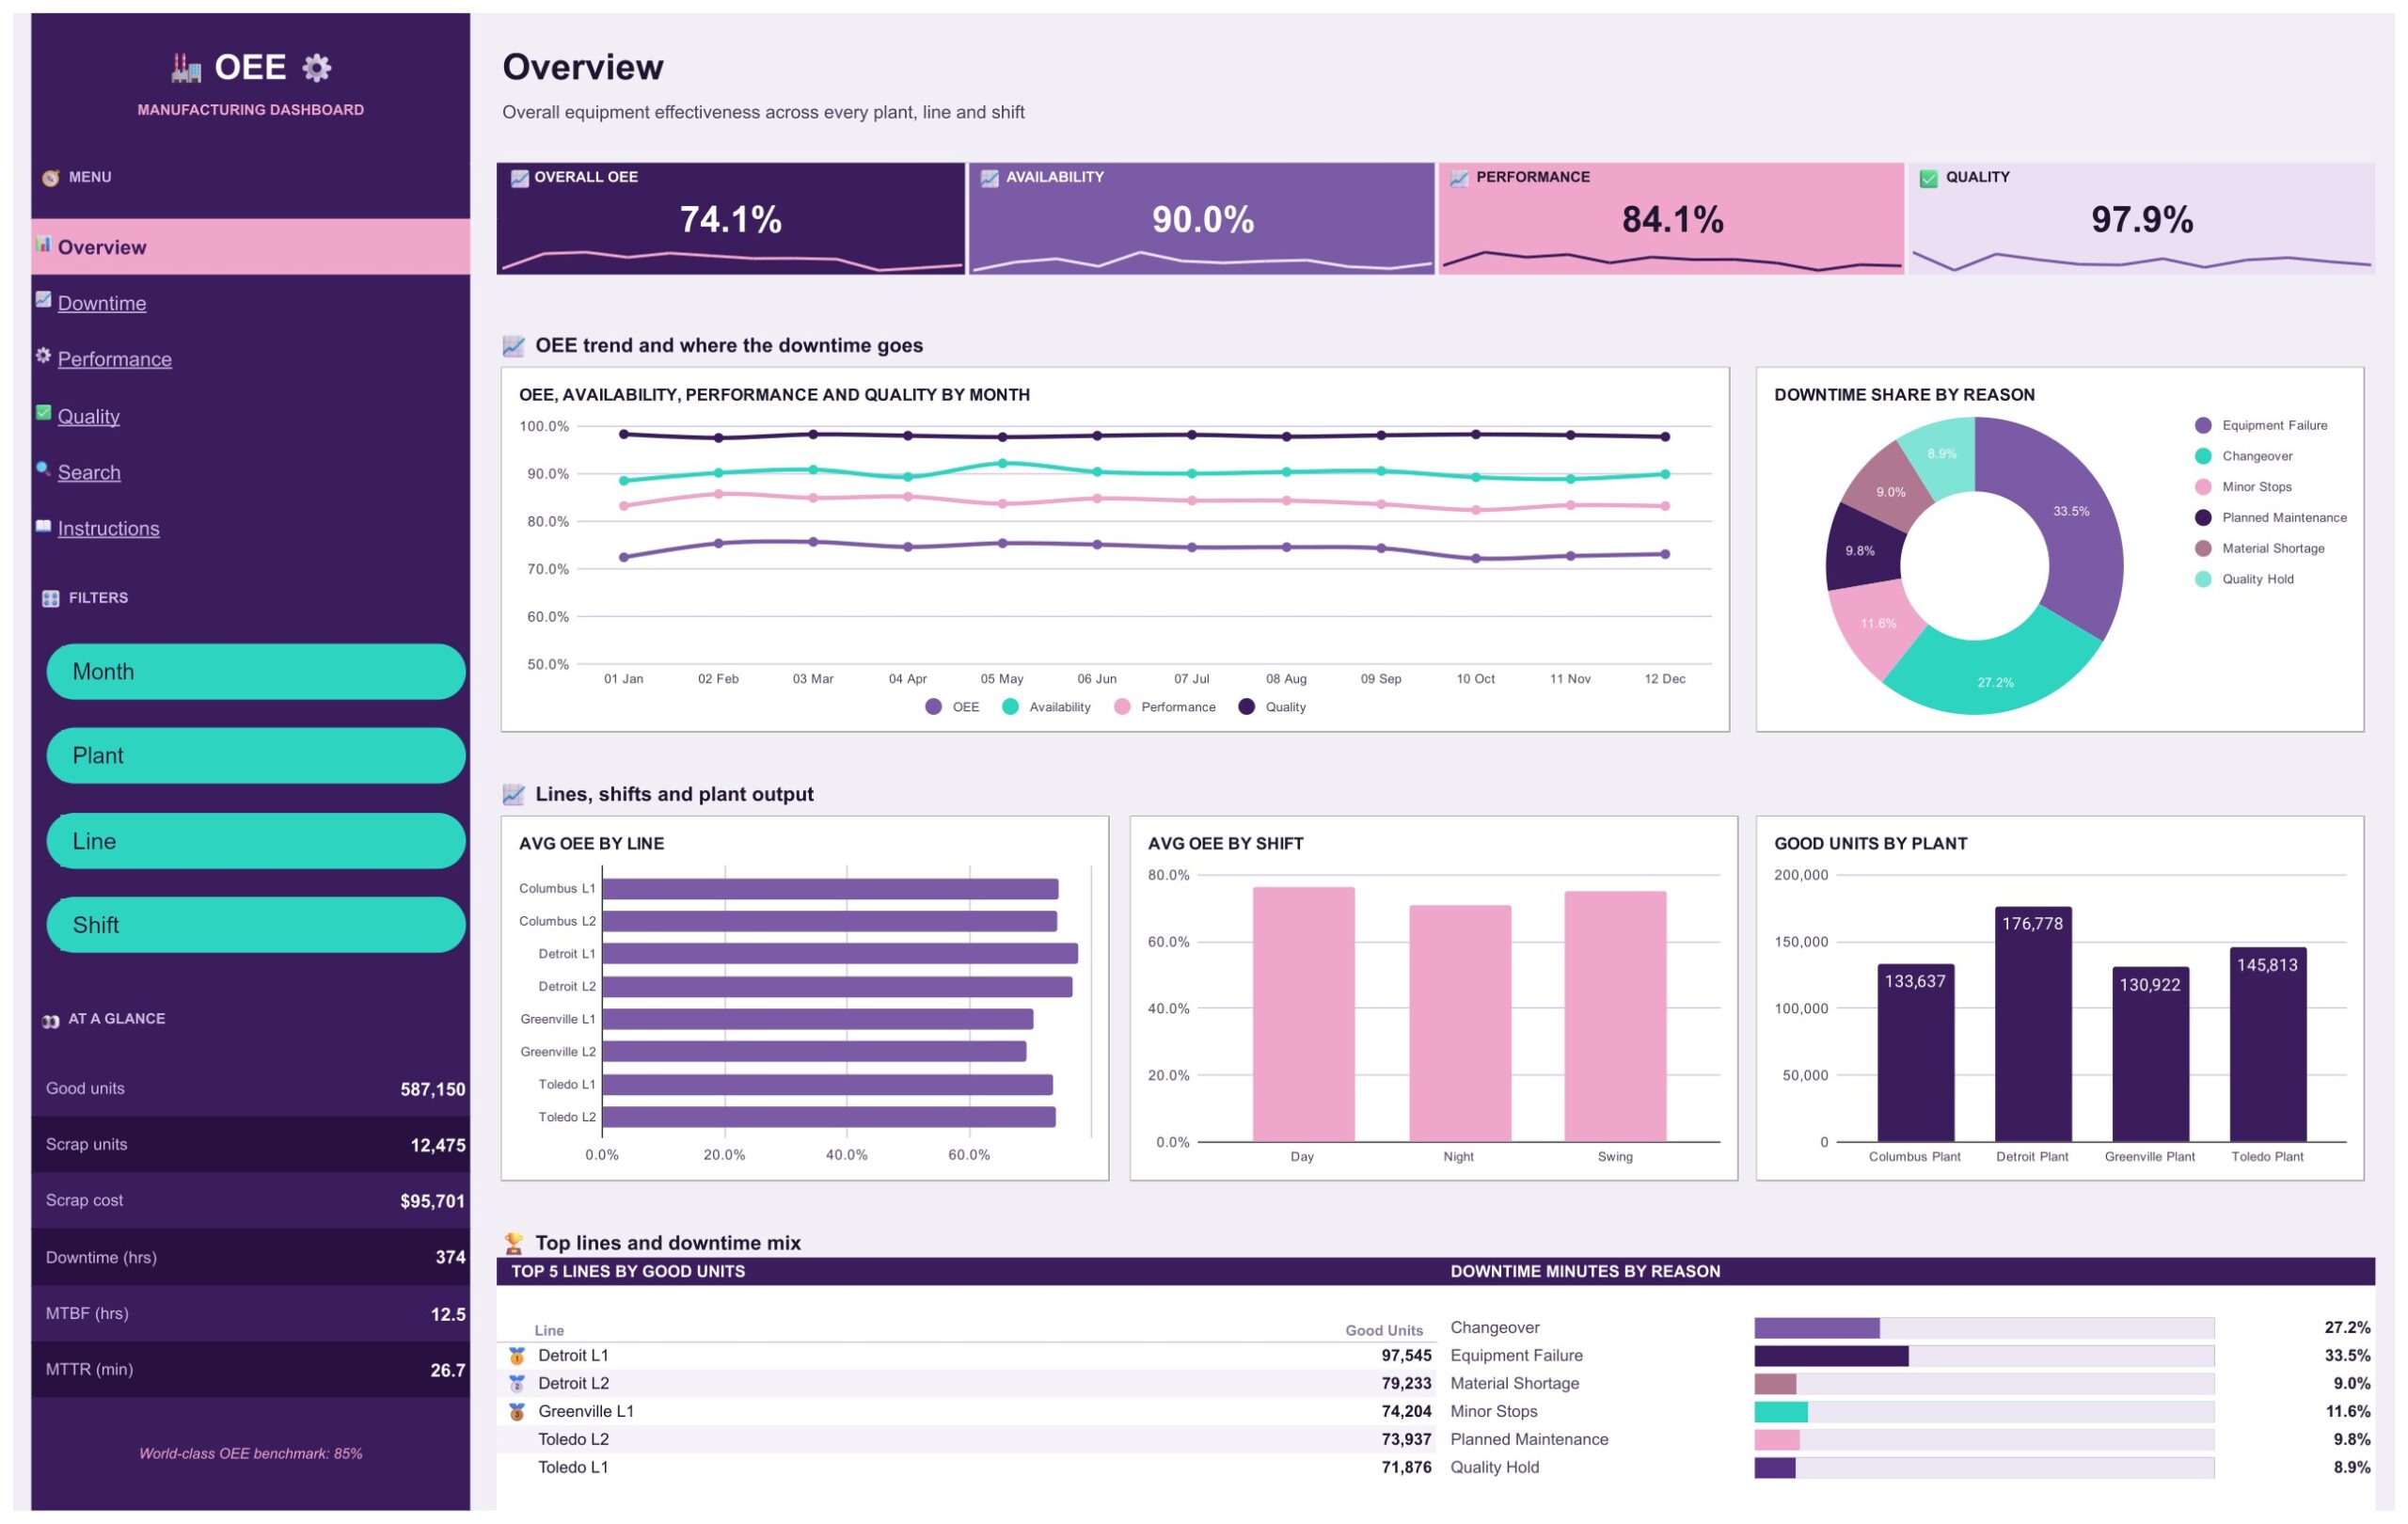
OEE multiplies three factors. Availability is the share of planned time the machine actually ran. Performance compares the units you made with what the ideal cycle time allows. Quality is the share of units that were good the first time. Multiply the three and you get OEE. In the sample data the dashboard shows an Overall OEE of 74.1%, built from 90.0% availability, 84.1% performance and 97.9% quality, with an 85% benchmark note on the side panel.
What the Dashboard Gives You
The template has four dashboard pages, a Search page, an Instructions page and a Data tab. Every dashboard page keeps the same four OEE tiles and the same At a Glance panel (good units, scrap units, scrap cost, downtime hours, MTBF and MTTR), so the headline numbers never move out of sight.
Overview
The Overview page shows OEE, availability, performance and quality by month, the share of downtime by reason, average OEE by line and by shift, and good units by plant. It is the page you open in a morning meeting.
Downtime
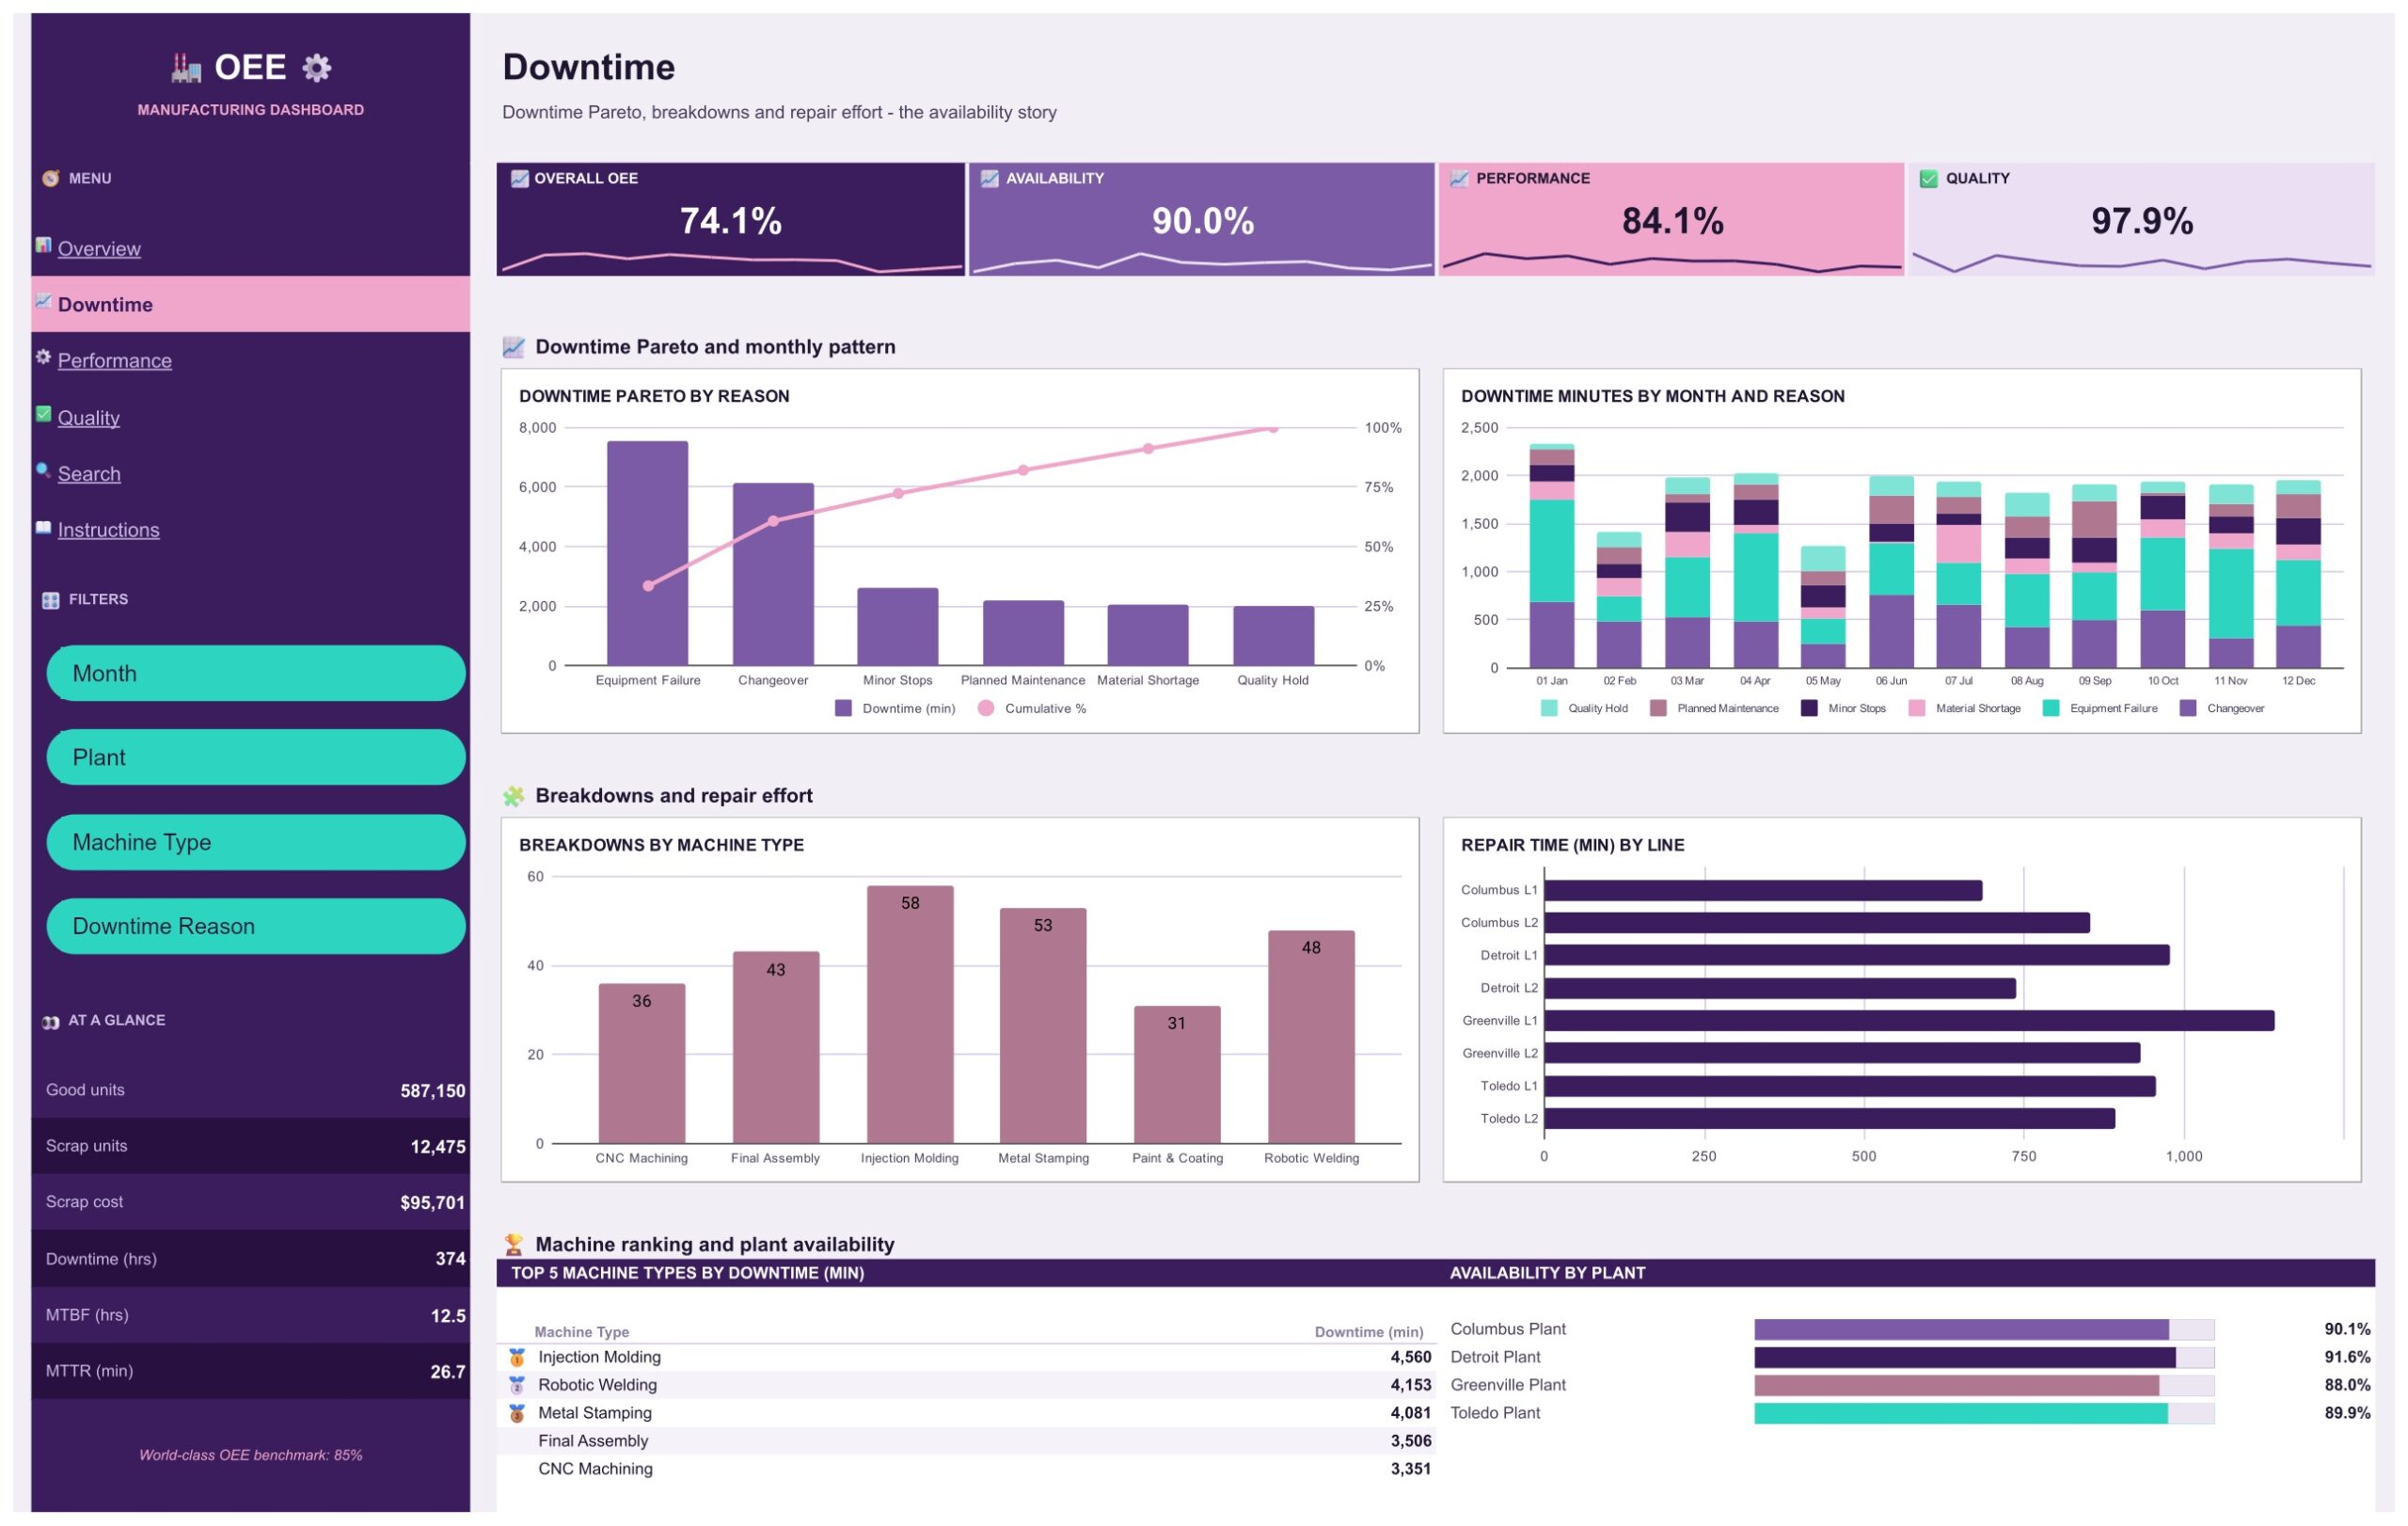
Availability losses are usually the biggest lever, so this page ranks downtime reasons in a Pareto chart with a cumulative percentage line. Below it you will find downtime minutes by month and reason, breakdowns by machine type and repair time by line. In the sample data, Equipment Failure and Changeover account for the largest share of lost minutes, which is exactly the kind of pattern a Pareto is built to expose.
Performance
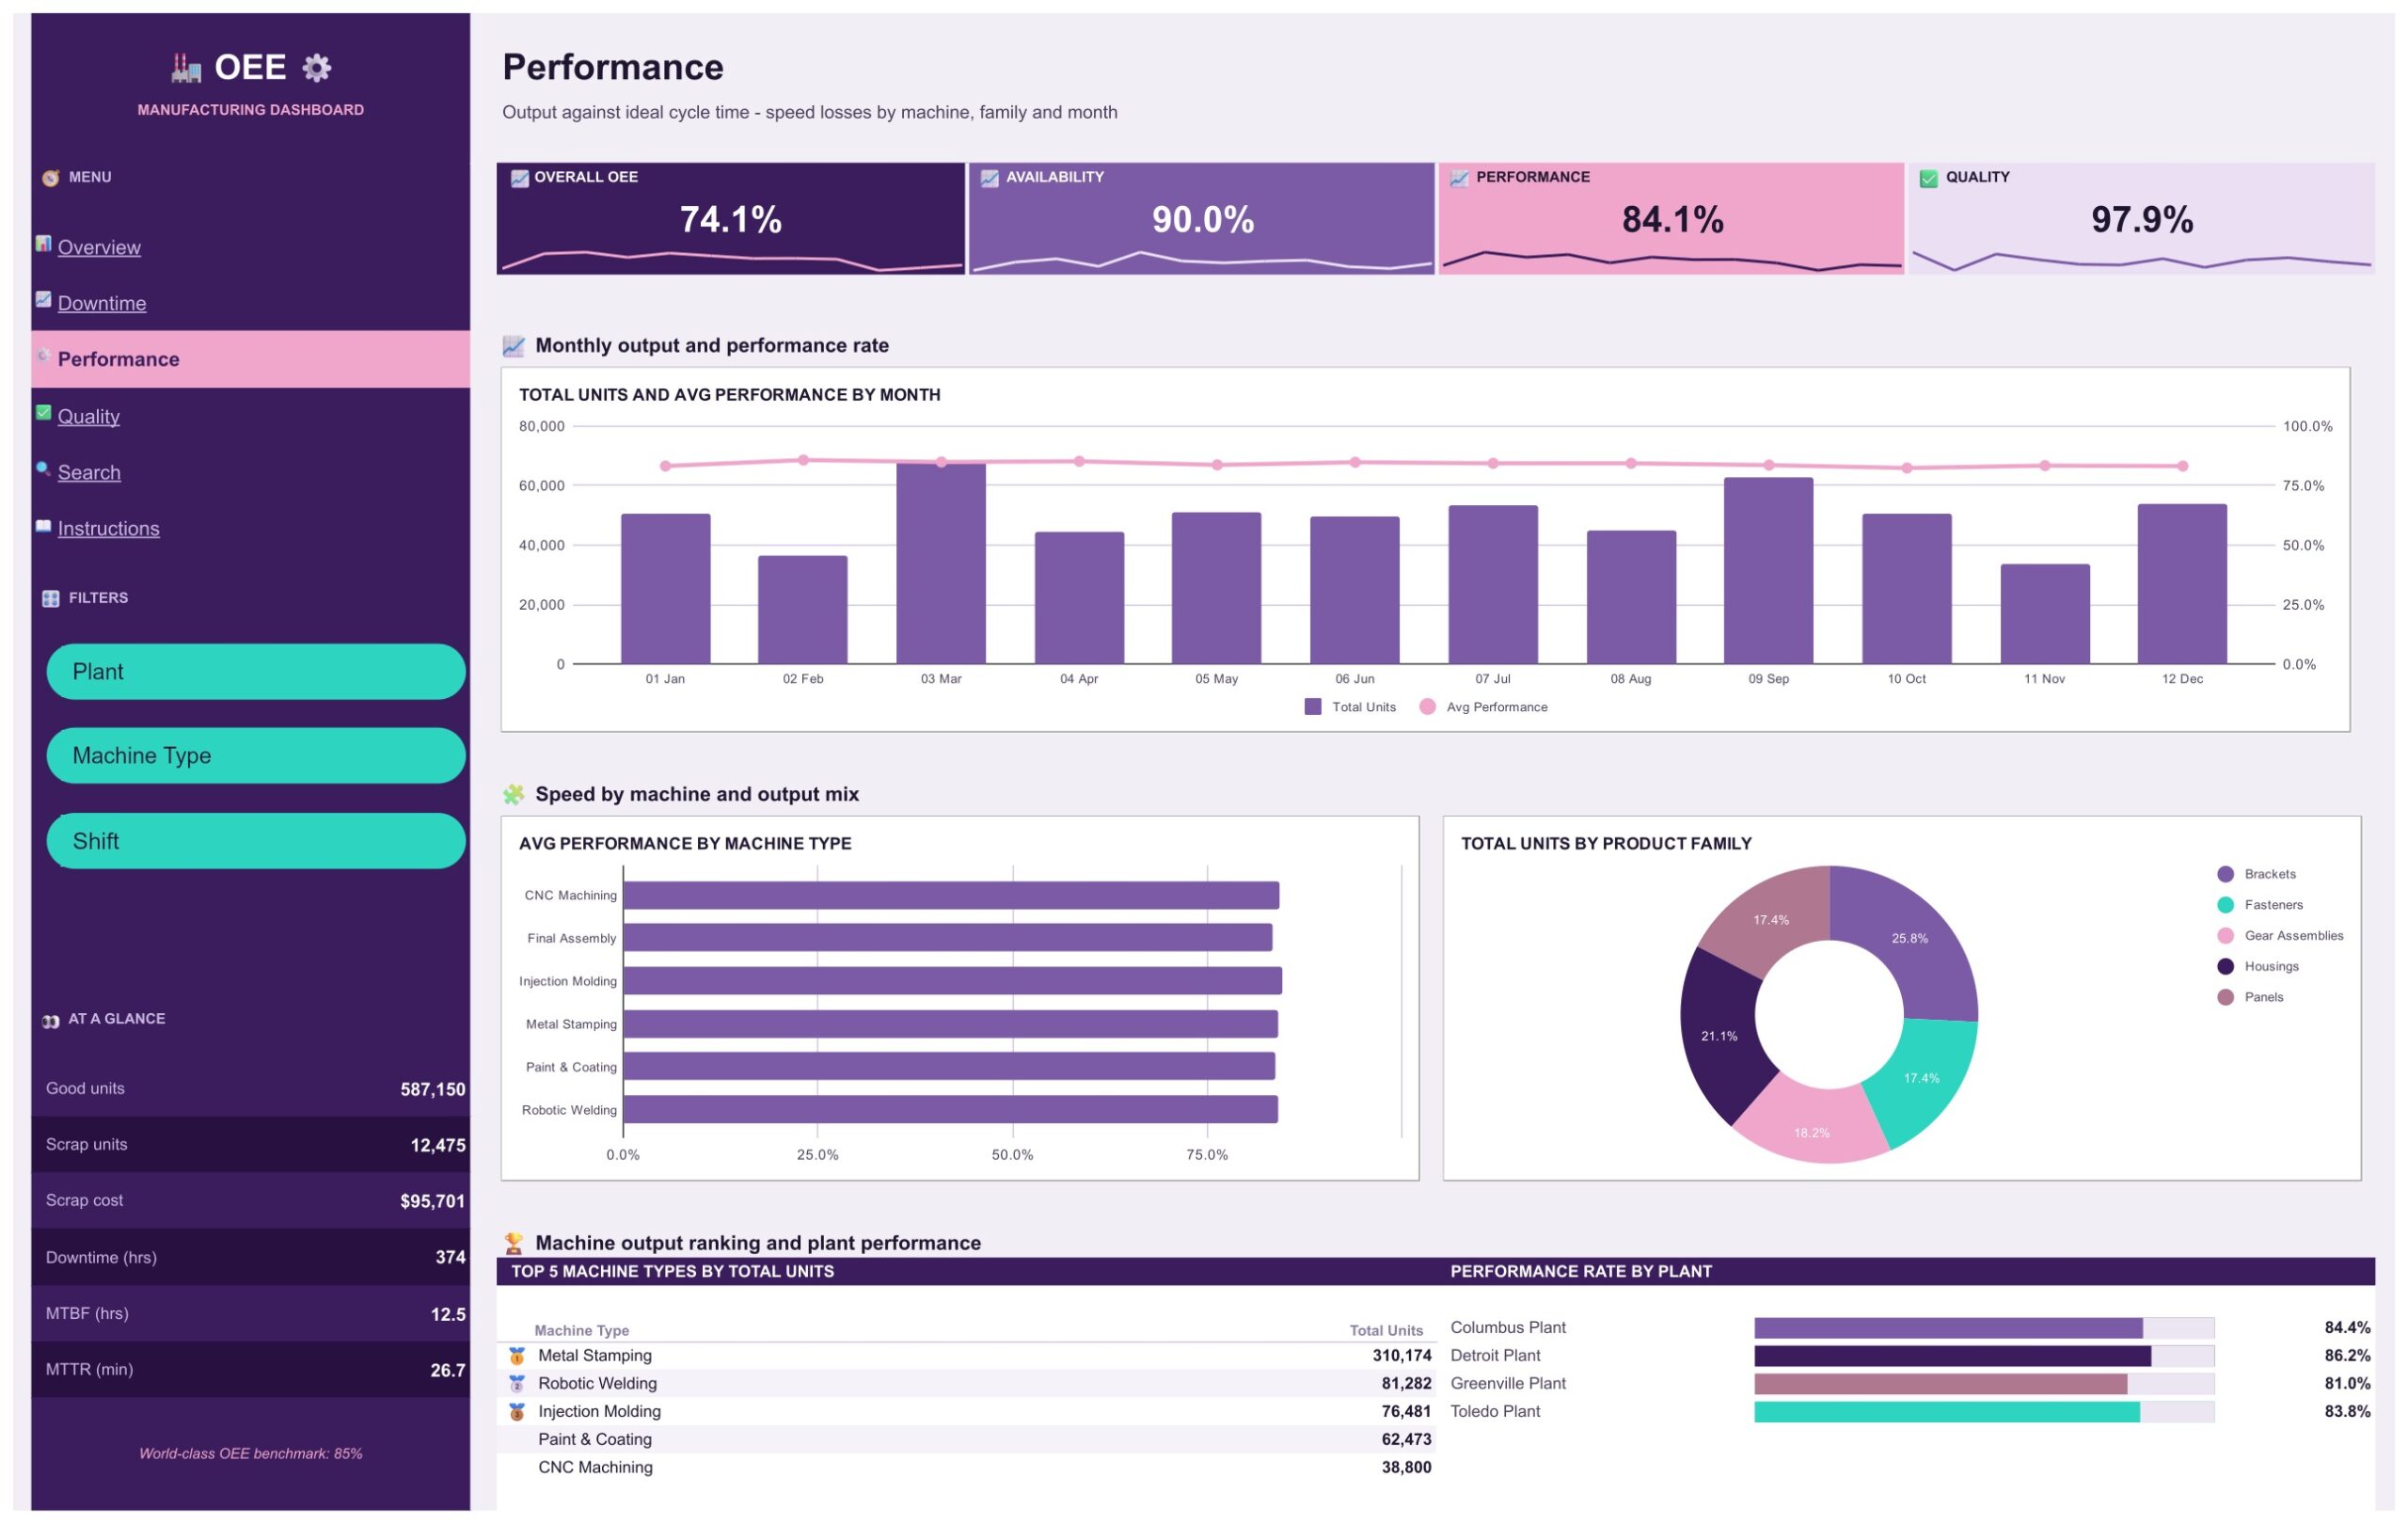
The Performance page compares output with ideal cycle time. It shows total units and average performance by month, average performance by machine type, units by product family and a performance rate by plant. Use it to find speed losses that hide inside a shift that looks fine on availability alone.
Quality
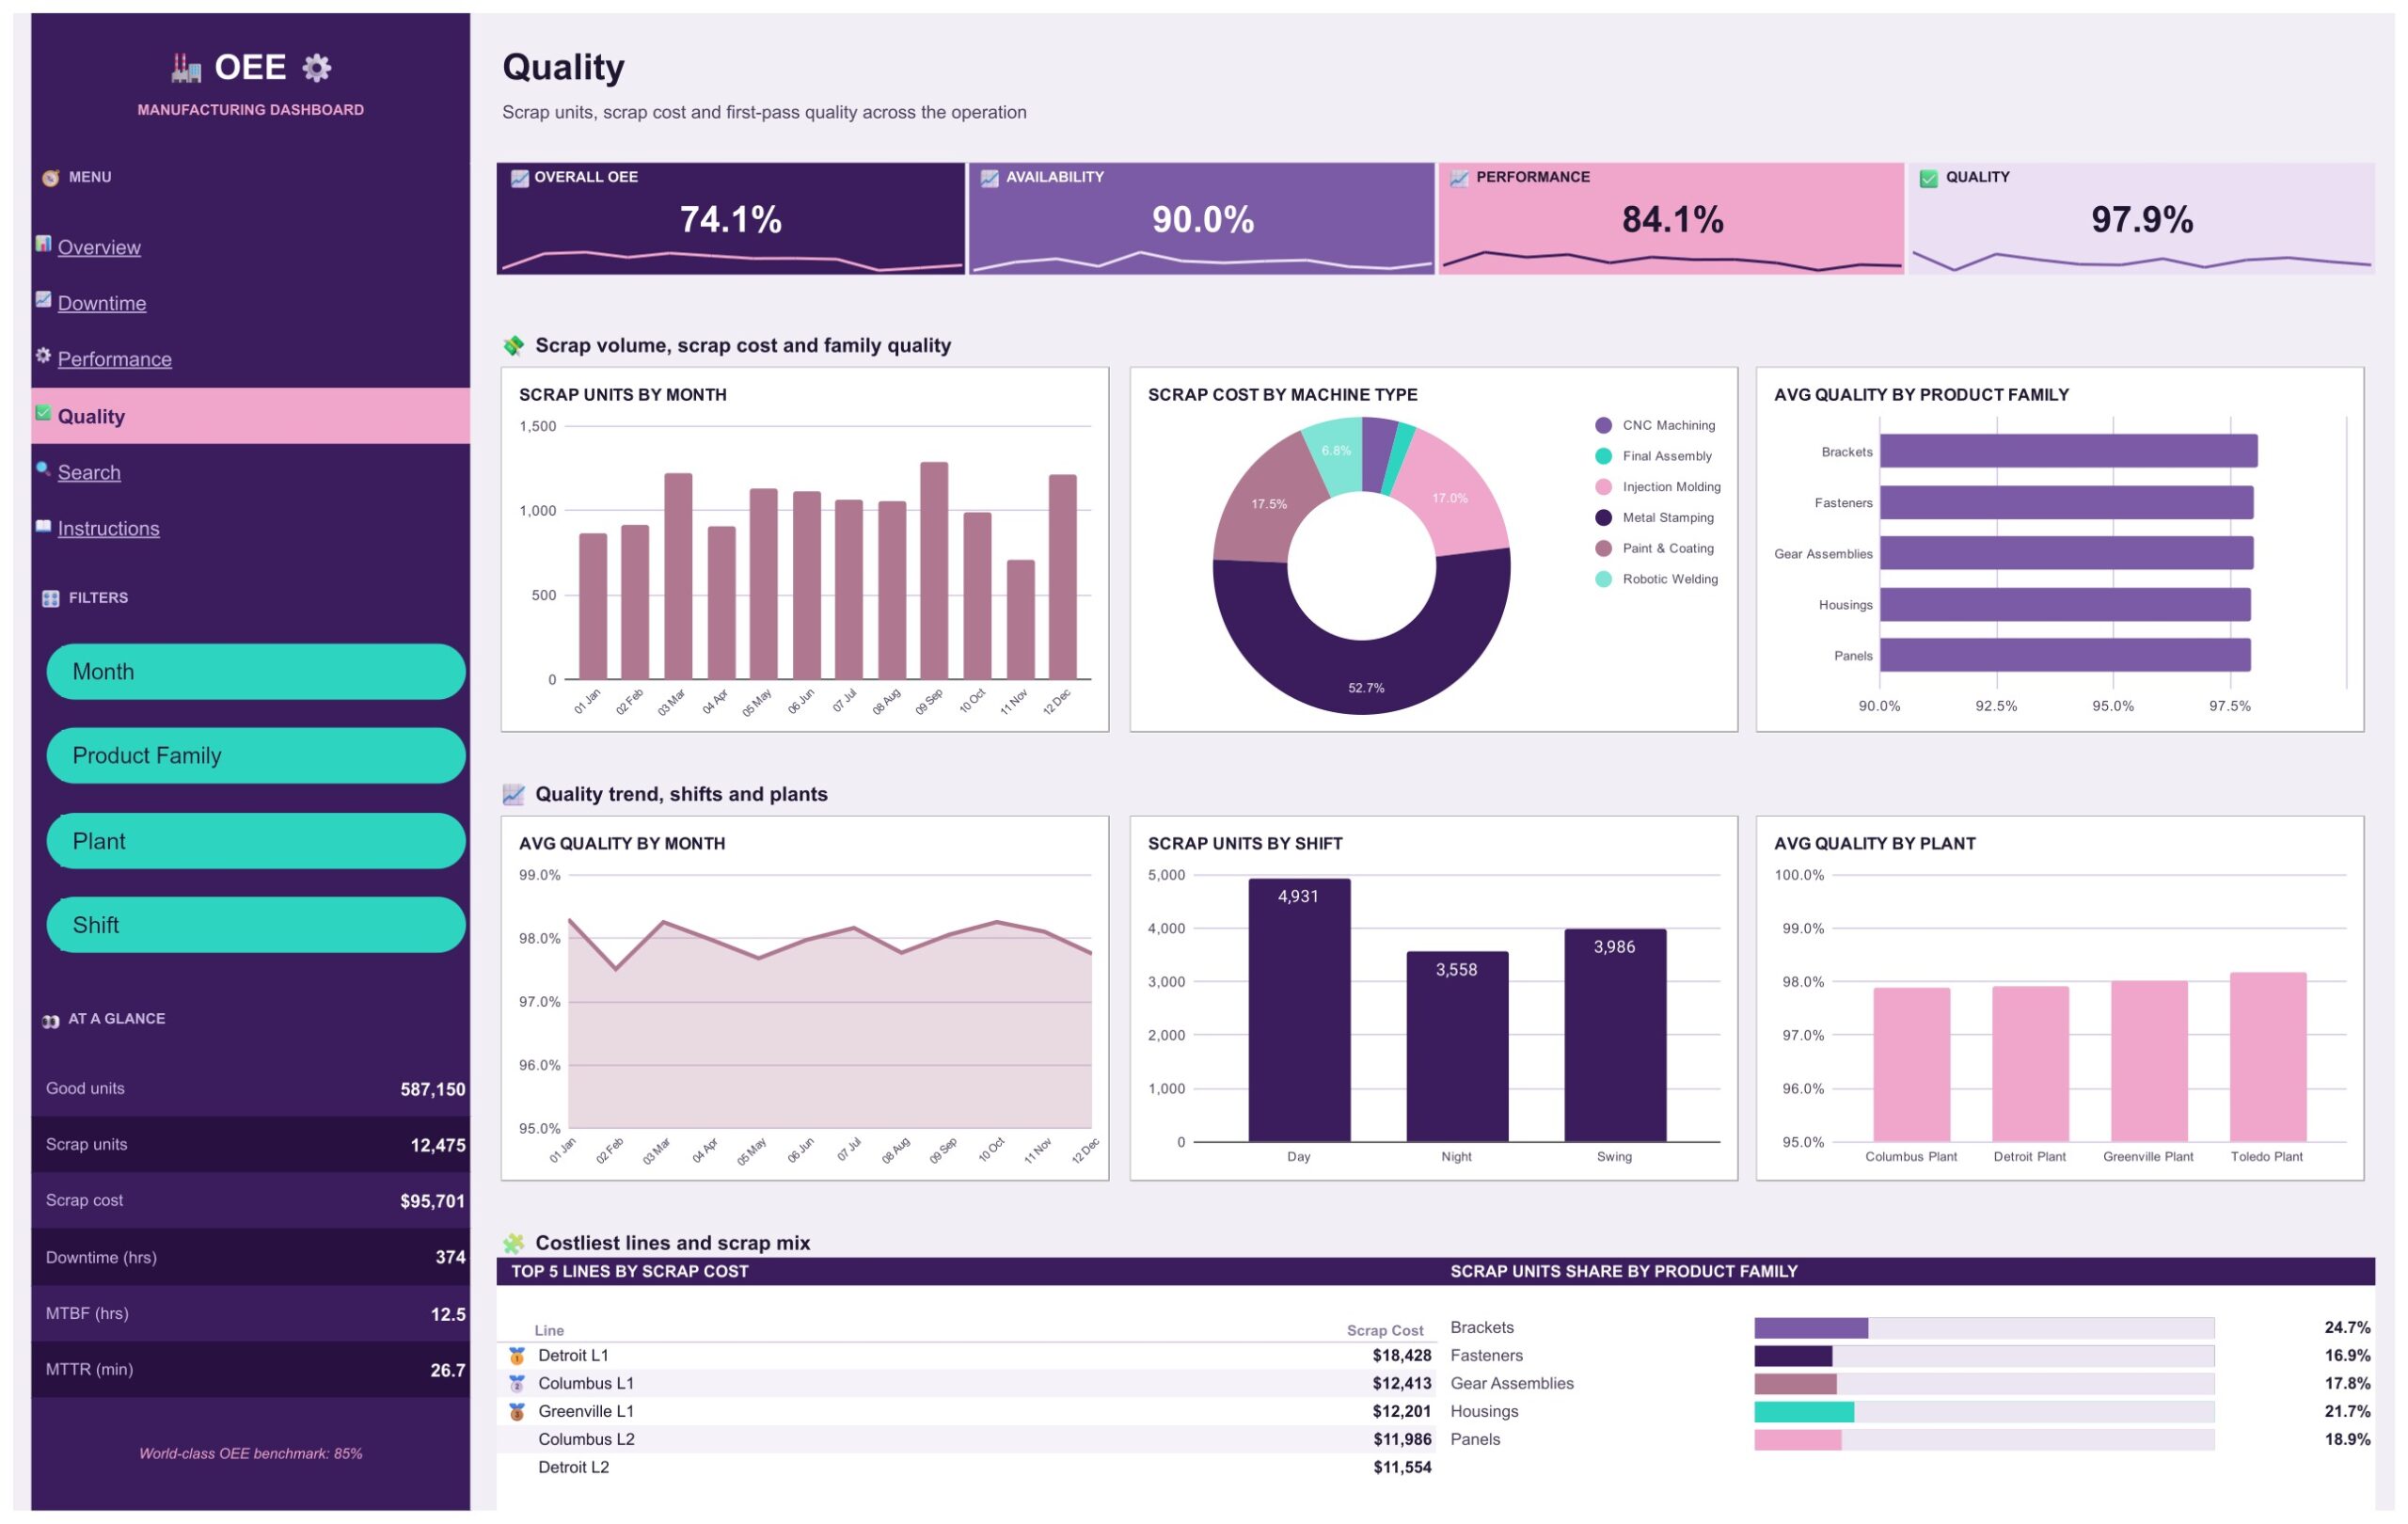
Scrap units by month, scrap cost by machine type, average quality by product family, month, plant and shift, and the five lines with the highest scrap cost. Putting a cost next to every scrapped unit makes the quality conversation much easier to have with finance.
Search
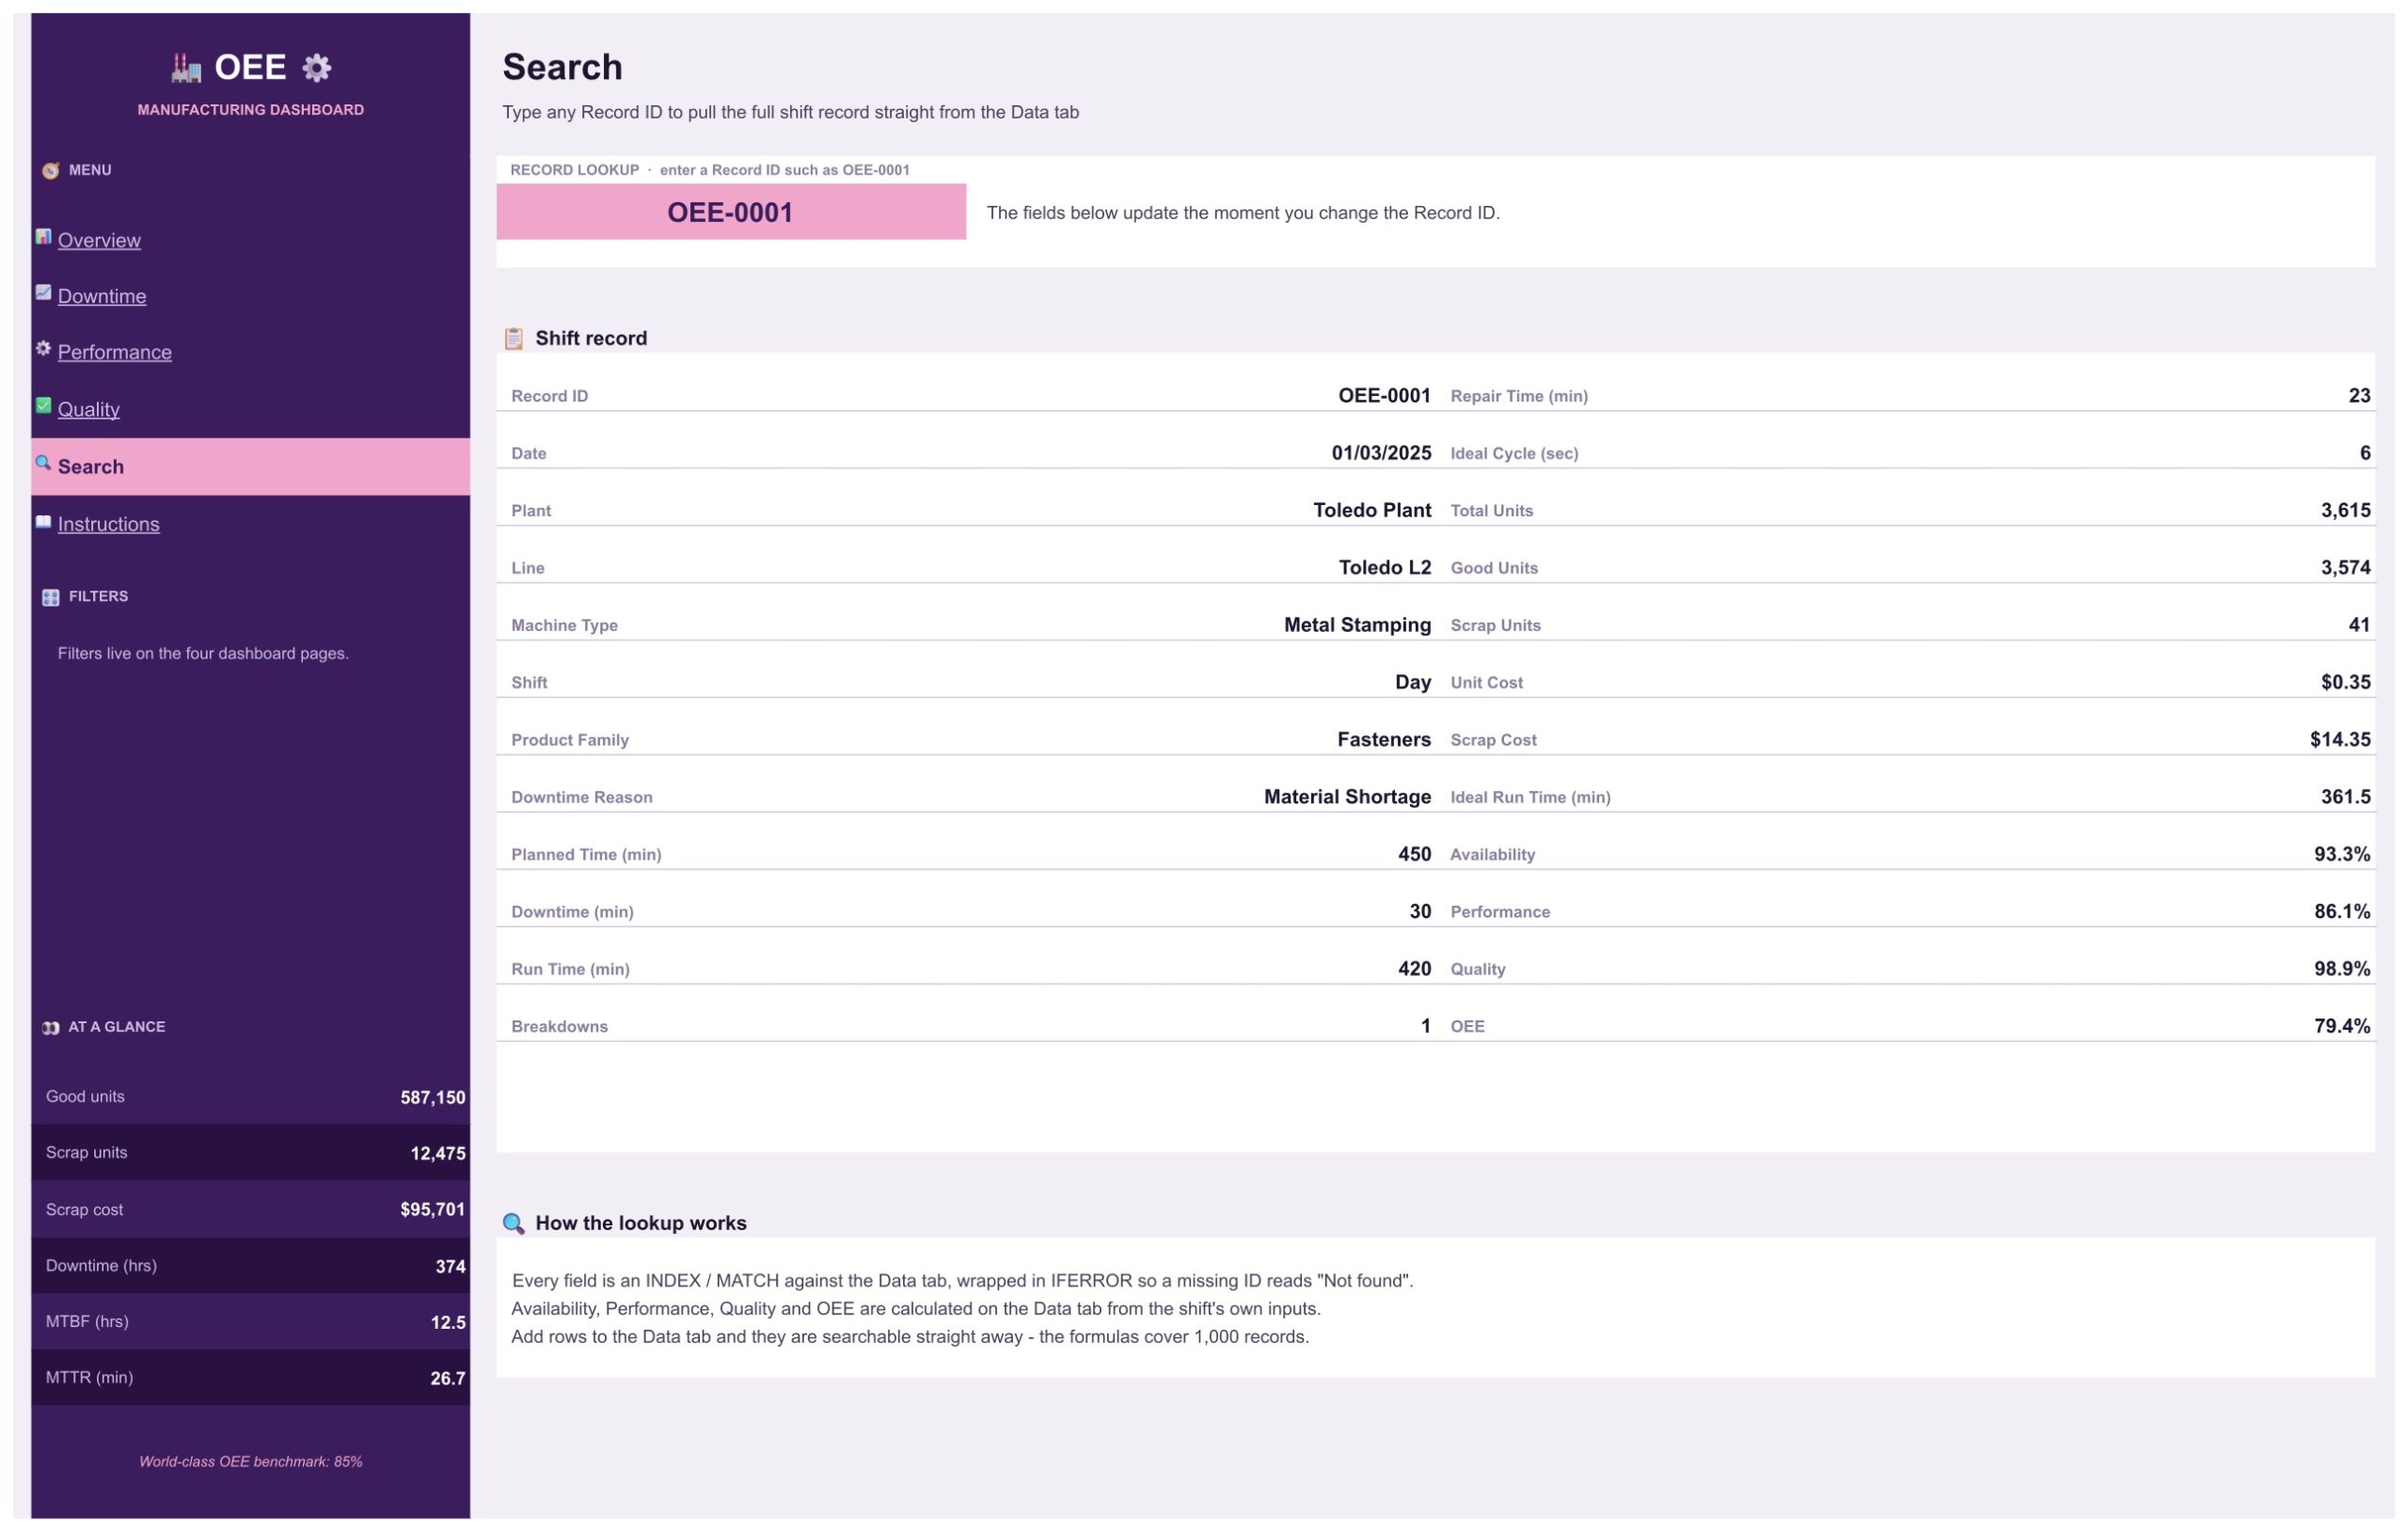
Type a Record ID such as OEE-0001 and the whole shift record appears: plant, line, machine type, shift, product family, downtime reason, planned time, downtime, run time, breakdowns, repair time, ideal cycle, units, scrap, unit cost and the calculated availability, performance, quality and OEE.
How to Set It Up with Your Own Data
- Make your own copy of the Google Sheet using the link in the PDF you download.
- Open the Data tab and replace the sample rows with your shift records, keeping the column order.
- Make sure the shaded formula columns are filled for each new row. The formulas cover 1,000 records.
- Use the filters on the left of each page to look at one plant, line, shift or month at a time.
Why Track OEE in a Spreadsheet
Many plants start OEE tracking in a spreadsheet because it needs no software project and no approval cycle. A supervisor can log each shift, and once a month the team reviews availability, performance and quality together instead of arguing about output alone. A dashboard on top of that log removes the monthly chart rebuilding. If you also keep other Google Sheets tools, browse the Google Sheets guides and templates on NeoTech Navigators for more ideas.
Strengths and Limits
The strengths are clear: one place for OEE, downtime, breakdowns and scrap cost, filters by seven fields, and nothing to install. The limits are just as clear. This is a reporting dashboard, so it has no live connection to your machines or to an MES, and you enter or paste the shift records yourself. All plants, lines and figures in the template are fictional sample data.
Frequently Asked Questions
Do I need Excel?
No. It is built for Google Sheets and uses formulas, pivot tables and slicers that Google Sheets already provides.
How many shift records fit?
The formulas cover 1,000 records, one per machine shift.
Can I rename plants and lines?
Yes. Replace the sample names in the Data tab with yours and the pages follow.
Get the Template
You can get the Manufacturing OEE Dashboard in Google Sheets from NextGenTemplates. For more manufacturing dashboards, see the Heavy Machinery Dashboard, the Steel and Metals Dashboard and the Chemical Manufacturing Dashboard.