Sponsorship plays a huge role in business growth, brand visibility, and event success. Whether you run sports events, exhibitions, conferences, concerts, or brand partnerships, sponsorship revenue helps you scale your operations. As the industry becomes more competitive, businesses want to measure sponsorship value more accurately. Because of this, a Sponsorship KPI Dashboard in Google Sheets becomes an essential tool.
This dashboard helps you track revenue, conversions, sponsor engagement, activation cost, impressions, audience reach, and overall ROI. Since everything stays organized inside Google Sheets, you gain instant clarity without using complex systems.
In this detailed guide, you will learn everything about this dashboard. You will see worksheet structures, KPI definitions, formulas, advantages, and best practices. By the end of this article, you will know exactly how to use the Sponsorship KPI Dashboard in Google Sheets and how it improves your sponsorship process.
What Is a Sponsorship KPI Dashboard in Google Sheets?
Click to Buy Sponsorship KPI Dashboard in Google Sheets
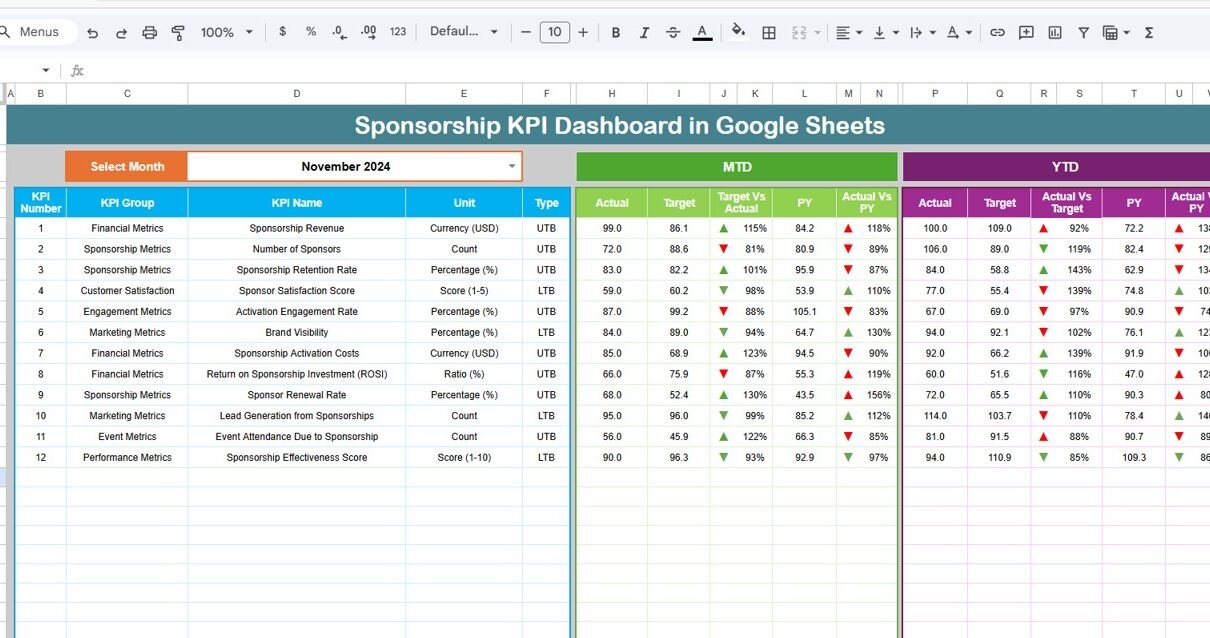
A Sponsorship KPI Dashboard in Google Sheets is a ready-to-use reporting tool that captures the full picture of your sponsorship performance. It tracks key metrics such as revenue, cost, exposure, engagement, event performance, lead generation, and sponsor satisfaction. Because of this, you measure exactly how your sponsorship deals perform month after month.
The dashboard displays:
-
MTD (Month-To-Date) Actual
-
MTD Target
-
MTD Previous Year
-
MTD Target vs Actual
-
MTD PY vs Actual
-
YTD (Year-To-Date) Actual
-
YTD Target
-
YTD Previous Year
-
YTD Target vs Actual
-
YTD PY vs Actual
All values update automatically when you change the selected month in the dashboard.
You can use this dashboard across industries:
-
Sports Organizations
-
Event Management Companies
-
Non-profit Organizations
-
Exhibitions & Trade Shows
-
Media Houses
-
Entertainment Companies
-
Digital Content Creators
-
Corporate CSR Sponsorships
Because everything stays in Google Sheets, you get live updates, cloud access, real-time collaboration, and automatic calculations.
Key Features of the Sponsorship KPI Dashboard in Google Sheets
This dashboard contains 6 worksheets, each with an important purpose. Let us explore them in detail.
Dashboard Sheet Tab – The Main KPI Summary
This is the primary sheet of the entire dashboard. It offers a clean, visual layout where you can see all sponsorship KPIs in one place.
Month Selection (Cell D3)
You select the month from a dropdown located in cell D3. Once you select a month:
-
All KPIs update
-
All comparisons refresh
-
All arrows change automatically
This gives you instant, real-time performance insights.

Click to Buy Sponsorship KPI Dashboard in Google Sheets
KPI Trend Sheet Tab – Deep Dive into Every KPI
This sheet helps you understand KPI movement throughout the year.
KPI Selection (Cell C3)
You select the KPI name from a dropdown. Once you select it, the sheet displays:
-
KPI Group
-
KPI Unit
-
KPI Type (Upper the Better / Lower the Better)
-
KPI Formula
-
KPI Definition
Trend Chart
The line chart next to the KPI information shows month-wise performance movement. Because of this, you understand seasonal patterns, spikes, dips, and performance changes.
This sheet helps decision-makers identify:
-
Issues early
-
Growth opportunities
-
Seasonal changes
-
ROI improvements
-
Cost fluctuations

Click to Buy Sponsorship KPI Dashboard in Google Sheets
Actual Number Sheet Tab – Enter Current Performance
This is where you enter MTD Actual and YTD Actual for each KPI.
Month Control (Cell E1)
You select the first month of the year to align calculations properly.
Purpose
-
Store real performance
-
Feed data to dashboard
-
Feed data to trend charts
You must update this sheet regularly for accurate reporting.

Target Sheet Tab – Monthly & Yearly Targets
This sheet stores target values for each KPI.
Includes:
-
MTD Target
-
YTD Target
Targets help you measure success and compare how well your sponsorship efforts perform.

Click to Buy Sponsorship KPI Dashboard in Google Sheets
Previous Year Number Sheet Tab – Last Year’s Data
This sheet stores your previous year’s numbers in the same structure as the current year.
Why It Matters?
-
Shows year-over-year improvement
-
Helps evaluate long-term growth
-
Helps understand sponsor retention value
-
Measures cost efficiency compared to last year

KPI Definition Sheet Tab – Full KPI Reference
This sheet contains the master list of KPIs.
Includes:
- KPI Name
- KPI Group
- Unit
- Formula
- Definition
- KPI Type (UTB/ LTB)
This becomes helpful for training teams, explaining formulas to management, and maintaining consistent reporting.

Click to Buy Sponsorship KPI Dashboard in Google Sheets
Advantages of the Sponsorship KPI Dashboard
Let us look at the benefits of using this Google Sheets dashboard.
- Full Clarity of Sponsorship Performance: You see revenue, cost, deliverables, impressions, and ROI clearly.
- Perfect for Monthly & Yearly Tracking: The MTD and YTD structure gives real-time progress.
- Better Sponsor Relationship Management: You measure satisfaction, renewal rates, and deliverable completion.
- Helps in Budget Allocation: Cost KPIs show where you overspend.
- Helps Identify High-Value Sponsors: Revenue-based KPIs help track best-performing partnerships.
- Saves Hours of Manual Reporting; The dashboard updates automatically.
Best Practices for Using This Dashboard
Click to Buy Sponsorship KPI Dashboard in Google Sheets
Use the following methods to get maximum results.
- Update the Actual Sheet Regularly: This keeps the dashboard accurate.
- Use Clear and Measurable Targets; Targets must match your sponsorship goals.
- Review Trends Monthly: Trend sheet reveals performance patterns.
- Analyze Year-over-Year Growth; PY comparison shows long-term improvements.
- Track Deliverables Carefully: Deliverables completion impacts sponsor satisfaction.
Conclusion
The Sponsorship KPI Dashboard in Google Sheets is a powerful, structured, and real-time reporting tool that gives clarity, transparency, and insight into your sponsorship performance. It helps you track revenue, cost, visibility, deliverables, leads, and ROI across all events and campaigns. Moreover, with its simple design, dropdowns, dynamic charts, and clear KPI definitions, this dashboard makes sponsorship management easier and more data-driven.
Visit our YouTube channel to learn step-by-step video tutorials
Youtube.com/@NeotechNavigators
Watch the step-by-step video Demo: