Every business wants to grow consistently, improve revenue quality, and understand what drives performance. Because markets shift fast and customer behavior changes often, leaders need real-time insights that support quick and confident decisions. A Revenue Growth KPI Dashboard in Google Sheets does exactly that. It turns raw financial numbers into simple visuals, clear comparisons, and monthly trends that help you stay ahead.
What Is a Revenue Growth KPI Dashboard in Google Sheets?
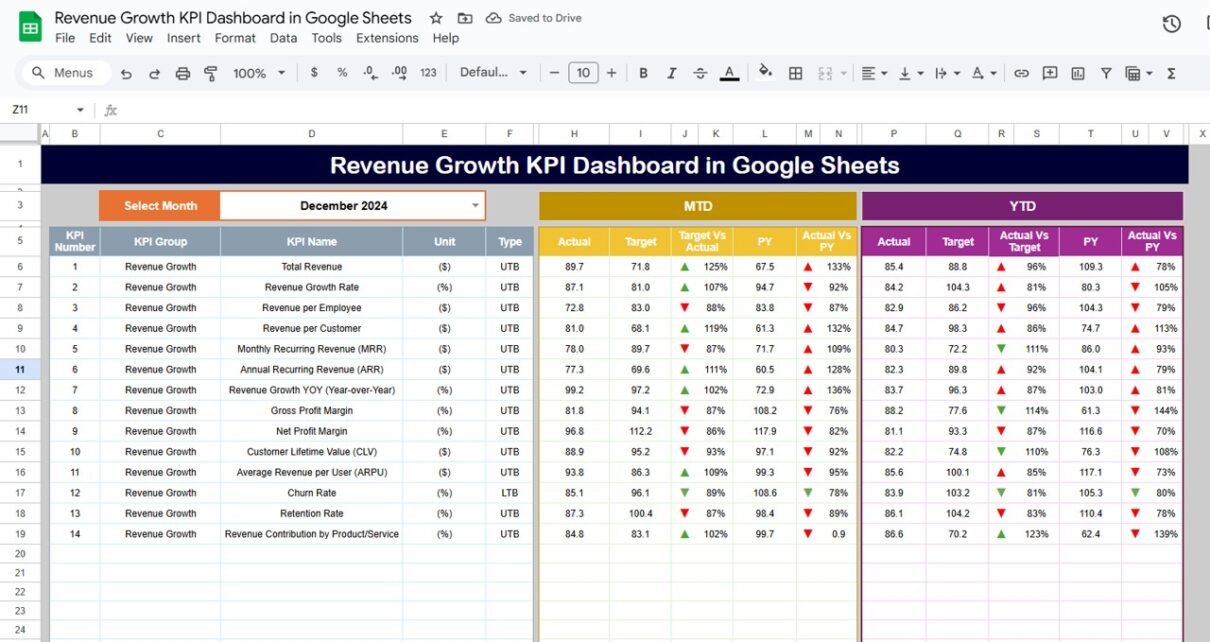
A Revenue Growth KPI Dashboard in Google Sheets is a performance-tracking solution that helps businesses analyze month-to-date (MTD) and year-to-date (YTD) growth. It uses structured inputs, formulas, comparison charts, and conditional formatting to show how revenue changes with time. You can track sales effectiveness, profitability, customer trends, and overall business performance in a single place.
Because everything runs inside Google Sheets, you enjoy instant access, collaboration, and secure cloud storage. You only update your actuals or targets, and the dashboard refreshes automatically.
Why Do You Need a Revenue Growth KPI Dashboard?
Click to Buy Revenue Growth KPI Dashboard in Google Sheets
Businesses grow when they measure the right KPIs. This dashboard helps you:
-
Track MTD and YTD progress instantly
-
Compare Actual vs Target and Actual vs Previous Year
-
Identify improvement areas without guesswork
-
Visualize revenue trends across the year
-
Make fast, informed, and data-backed decisions
-
Improve strategic planning and forecasting
This dashboard supports small businesses, startups, sales teams, finance departments, and enterprise-level management teams.
Key Features of the Revenue Growth KPI Dashboard in Google Sheets
This dashboard includes 6 powerful worksheet tabs, each designed for accuracy and quick decision-making.
1. Dashboard Sheet Tab – Your Main Control Center
This is the heart of the entire dashboard. You select the month from the dropdown available in cell D3, and the dashboard updates instantly. Every KPI shows:
- MTD Actual
- MTD Target
- MTD Previous Year
- MTD Target vs Actual
- MTD PY vs Actual
- YTD Actual
- YTD Target
- YTD Previous Year
- YTD Target vs Actual
- YTD PY vs Actual
Conditional formatting arrows (up/down) make the performance status clear at a glance.

Click to Buy Revenue Growth KPI Dashboard in Google Sheets
2. KPI Trend Sheet Tab
You can select the KPI from the dropdown in cell C3, and the sheet displays:
-
KPI Group
-
KPI Unit
-
KPI Type (LTB or UTB)
-
KPI Formula
-
KPI Definition
This page helps you understand how each KPI behaves over time.

Click to Buy Revenue Growth KPI Dashboard in Google Sheets
3. Actual Number Sheet Tab
You enter actual MTD and YTD values here for every KPI. You can change the year by entering the first month in cell E1. This gives full control of monthly data entry.

4. Target Sheet Tab
You define monthly MTD and YTD targets for each KPI, helping you track progress against expectations.

Click to Buy Revenue Growth KPI Dashboard in Google Sheets
5. Previous Year Number Sheet Tab
You enter the previous year’s MTD and YTD numbers here. This supports accurate comparisons and growth calculations.

6. KPI Definition Sheet Tab
You enter:
- KPI Name
- KPI Group
- KPI Unit
- KPI Formula
- KPI Definition
This sheet becomes the technical reference for the entire dashboard.

Click to Buy Revenue Growth KPI Dashboard in Google Sheets
How the Revenue Growth KPI Dashboard Works
This dashboard runs on a structured and smart workflow:
-
Enter actual numbers → Dashboard updates
-
Enter targets → Dashboard compares performance
-
Enter previous-year numbers → Dashboard calculates growth
-
Select month → All KPIs refresh instantly
-
View trends → Spot patterns and take action
Because Google Sheets supports collaboration, multiple team members can work together without confusion.
Advantages of Revenue Growth KPI Dashboard in Google Sheets
Click to Buy Revenue Growth KPI Dashboard in Google Sheets
Real-time Visibility
You track revenue performance instantly without waiting for reports.
Simple and Easy
The dashboard uses clear formulas, charts, and dropdowns.
Saves Time
No need to create manual reports every month.
Better Decision-Making
You compare actual vs target and actual vs previous year quickly.
Cloud-Based Access
You access it from anywhere and share it with your team.
Accurate Monthly Trends
The KPI Trend Sheet displays long-term performance clearly.
Best Practices for Using the Revenue Growth KPI Dashboard in Google Sheets
-
Update actual numbers at the start or end of each month
-
Keep KPI names consistent across all sheets
-
Maintain clean data for better visuals
-
Compare MTD and YTD values regularly
-
Track revenue by product, customer type, or region
-
Use conditional formatting to highlight improvement opportunities
-
Review previous-year trends to set realistic targets
Conclusion
Click to Buy Revenue Growth KPI Dashboard in Google Sheets
A Revenue Growth KPI Dashboard in Google Sheets helps businesses manage their growth with confidence. It converts raw numbers into insights that improve decisions and strengthen strategies. With clear KPIs, easy navigation, and automated calculations, your team can focus on execution instead of manual reporting.
This dashboard supports every business size and every industry. When you use it regularly, you understand your growth drivers and take better decisions for the future.
Frequently Asked Questions (FAQs)
1. What is a Revenue Growth KPI Dashboard in Google Sheets?
It is a ready-to-use dashboard that shows monthly and yearly revenue performance using KPIs, charts, and comparisons.
2. What KPIs are included in this dashboard?
It includes revenue, revenue growth %, ARPC, CAC, churn, retention, profit margin %, and more.
3. Can I customize the KPIs?
Yes, you can add or edit KPIs based on your business needs.
4. How do I update the dashboard each month?
You enter new actual numbers in the Actual Numbers sheet and select the desired month from the dropdown.
5. Can multiple users access this dashboard?
Yes, Google Sheets allows real-time collaboration.
Visit our YouTube channel to learn step-by-step video tutorials
Youtube.com/@NeotechNavigators
Watch the step-by-step video tutorial: