Financial risk increases when organizations do not track their exposure, credit performance, liquidity, operational issues, or market fluctuations in a structured way. Because business data keeps growing every day, manual risk reporting often becomes slow, unclear, and inconsistent. This leads to delayed decisions, higher losses, and weak risk visibility.Financial Risk KPI Dashboard in Google Sheets
A Financial Risk KPI Dashboard in Google Sheets solves all these issues. It brings all your key risk indicators into one place, updates metrics instantly, and helps finance teams make better and faster decisions. Since the system works on Google Sheets, you can update numbers easily, collaborate with your team, and view risk performance anytime.Financial Risk KPI Dashboard in Google Sheets
What Is a Financial Risk KPI Dashboard in Google Sheets?
A Financial Risk KPI Dashboard in Google Sheets is a ready-to-use reporting system designed to track your organization’s key risk indicators (KRIs) and risk performance over time. It converts raw financial numbers into clear visuals, KPI cards, trend graphs, and comparison metrics.
The dashboard helps you:
- Monitor financial exposures
- Compare actuals vs targets
- Analyze monthly and yearly trends
- Track early warning signals
- Identify risk areas
- Improve internal decision-making
The best part is that the dashboard updates itself automatically when you select a month from the drop-down.
Key Features of the Financial Risk KPI Dashboard
Click to Buy Financial Risk KPI Dashboard in Google Sheets
This dashboard contains 6 structured worksheets, and each sheet plays an important role in the reporting process.
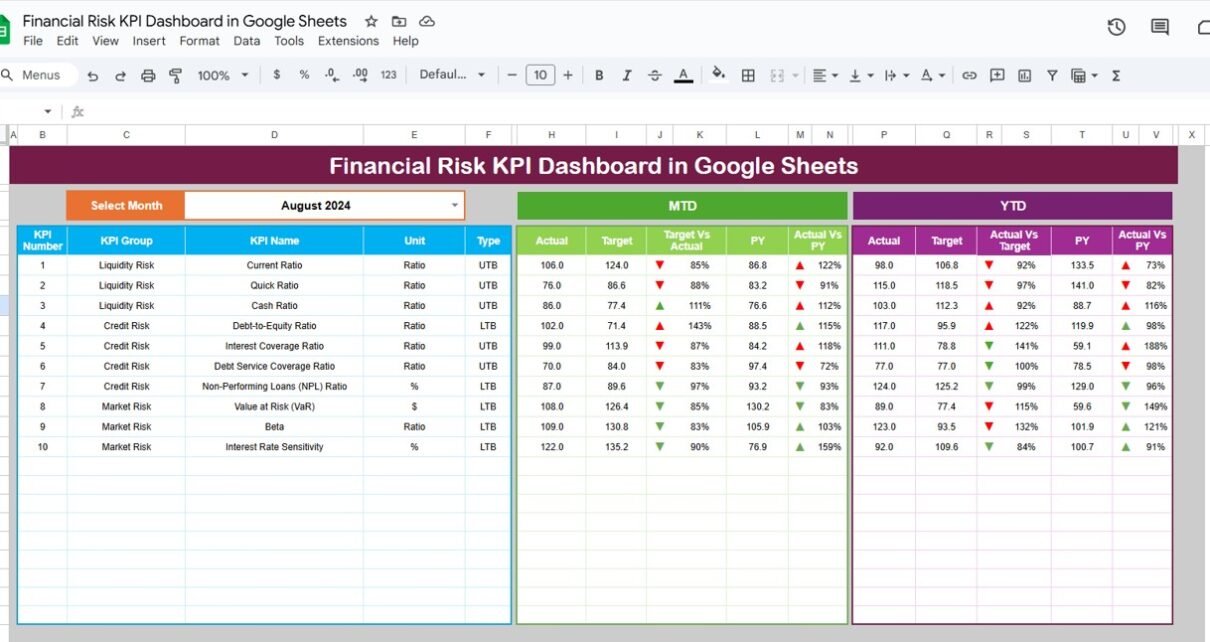
1. Dashboard Sheet Tab (Main Dashboard)
This is the core page of the system. You select a month from cell D3, and the entire dashboard updates instantly.
You can see:
-
MTD Actual vs Target vs Previous Year
-
YTD Actual vs Target vs Previous Year
-
Conditional formatting arrows (up/down indicators)
-
Clean visual layout with clear KPI cards
This one sheet helps senior management understand risk performance in seconds.

Click to Buy Financial Risk KPI Dashboard in Google Sheets
2. KPI Trend Sheet Tab
This page helps users analyze any KPI in detail.
You can select a KPI from cell C3, and the sheet displays:
-
KPI Group
-
Unit of Measurement
-
KPI Type (Upper the Better / Lower the Better)
-
KPI Formula
-
KPI Definition
This is useful for drill-down analysis and stakeholder explanations.

3. Actual Numbers Sheet Tab
In this sheet, you enter MTD and YTD Actual values for the selected month.
You choose the current month using cell E1.
This sheet acts as the actual data source for the dashboard.

Click to Buy Financial Risk KPI Dashboard in Google Sheets
4. Target Sheet Tab
Here, you enter monthly MTD and YTD targets for every KPI.
This allows the dashboard to compare Actual vs Target quickly.

5. Previous Year Numbers Sheet Tab
This sheet contains previous year’s data, structured in the same layout as the current year.
It allows easy performance comparison between:
-
Current Year Actual
-
Previous Year Actual
-
Current Targets

Click to Buy Financial Risk KPI Dashboard in Google Sheets
6. KPI Definition Sheet Tab
This sheet includes:
-
KPI Name
-
KPI Group
-
Unit
-
Formula
-
KPI Definition
It helps maintain clarity and standardization across teams.

Why Should You Use a Financial Risk KPI Dashboard in Google Sheets?
- Easy and real-time monitoring
- Cloud-based collaboration
- Fast updates using month filters
- Clear comparison of MTD, YTD, Target & Previous Year
- Better decision-making for finance teams
- Ready-to-use design
- Ideal for budgeting, forecasting, and risk audits
Advantages of Using a Financial Risk KPI Dashboard
Click to Buy Financial Risk KPI Dashboard in Google Sheets
- Instant Risk Visibility: You get all risk signals in one place, so you respond faster.
- Improved Forecast Accuracy: You compare Actual vs Target and adjust strategies early.
- Better Compliance and Governance: A structured dashboard supports audits and documentation.
- Reduced Manual Work; All formulas, calculations, and visuals update automatically.
- Collaboration Made Simple: Teams can view and update data from anywhere.
Best Practices for Using the Financial Risk KPI Dashboard
- Update Data Monthly: Make sure YTD and MTD sheets contain fresh numbers.
- Maintain KPI Definitions: Avoid confusion by keeping formulas and definitions updated.
- Use Standard Units; This ensures consistent reporting across teams.
- Compare Performance Regularly: Review monthly trends at meetings.
- Keep Risk Owners Accountable: Assign responsibility for every KPI.
- Review Target Sheet Quarterly; Targets must match market changes.
Conclusion
Click to Buy Financial Risk KPI Dashboard in Google Sheets
A Financial Risk KPI Dashboard in Google Sheets helps every organization strengthen its risk monitoring system. It shows trends clearly, compares actuals with targets, highlights problem areas, and helps leaders take fast actions. With structured worksheets, ready-to-use formulas, KPI definitions, and automated visuals, this dashboard completely transforms your financial risk reporting process.
When you follow the best practices and update data regularly, your business stays ahead of risks and makes confident decisions.
Frequently Asked Questions (FAQ)
1. Who can use this Financial Risk KPI Dashboard?
Finance managers, auditors, analysts, CFOs, and business owners can use it for risk reporting.
2. Can I add more KPIs to this dashboard?
Yes, you can add KPIs easily in the KPI Definition sheet.
3. Does the dashboard update automatically?
Yes, when you enter data and select a month, the calculations update instantly.
4. Do I need advanced Excel or Google Sheets skills?
No, the dashboard is simple and ready to use.
5. Can multiple team members access it?
Yes, Google Sheets allows real-time collaboration.
Visit our YouTube channel to learn step-by-step video tutorials
Youtube.com/@NeotechNavigators