Training Budget & Performance Control Dashboard in Google Sheets play a critical role in building a skilled, confident, and high-performing workforce. However, many organizations struggle to control training costs, track program effectiveness, and measure performance across departments, trainers, and programs. When training data stays scattered across emails, spreadsheets, and manual reports, budgets get overspent, visibility reduces, and decision-making becomes reactive.Training Budget & Performance Control Dashboard in Google Sheets
That is exactly why a Training Budget & Performance Control Dashboard in Google Sheets becomes an essential management tool. This ready-to-use dashboard gives HR, L&D teams, finance teams, and leadership complete visibility into training budgets, utilization, overspending, program performance, and duration trends—all in one centralized and visual system.Training Budget & Performance Control Dashboard in Google Sheets
What Is a Training Budget & Performance Control Dashboard in Google Sheets?
Click to Buy Training Budget & Performance Control Dashboard in Google Sheets
A Training Budget & Performance Control Dashboard is a centralized reporting and monitoring tool that tracks:Training Budget & Performance Control Dashboard in Google Sheets
- Training volume
- Budget allocation
- Budget utilization
- Budget variance
- Overspending
- Training duration
- Program-wise and trainer-wise performance
Because this dashboard runs in Google Sheets, it offers real-time updates, easy collaboration, and zero dependency on expensive HR software. Teams simply update training records, and the dashboard automatically reflects the latest insights through cards, charts, and search results.Training Budget & Performance Control Dashboard in Google Sheets
This dashboard works perfectly for:
- HR & L&D teams
- Finance teams
- Department heads
- Training managers
- Senior leadership
Overall Structure of the Dashboard
The Training Budget & Performance Control Dashboard in Google Sheets consists of:
- Overview Sheet
- Department Analysis Sheet
- Program Analysis Sheet
- Trainer Analysis Sheet
- Search Functionality
- Structured Training Data Source
Each section focuses on a different dimension of training performance and budget control.
Overview Sheet Tab – Executive Summary of Training Performance
Click to Buy Training Budget & Performance Control Dashboard in Google Sheets
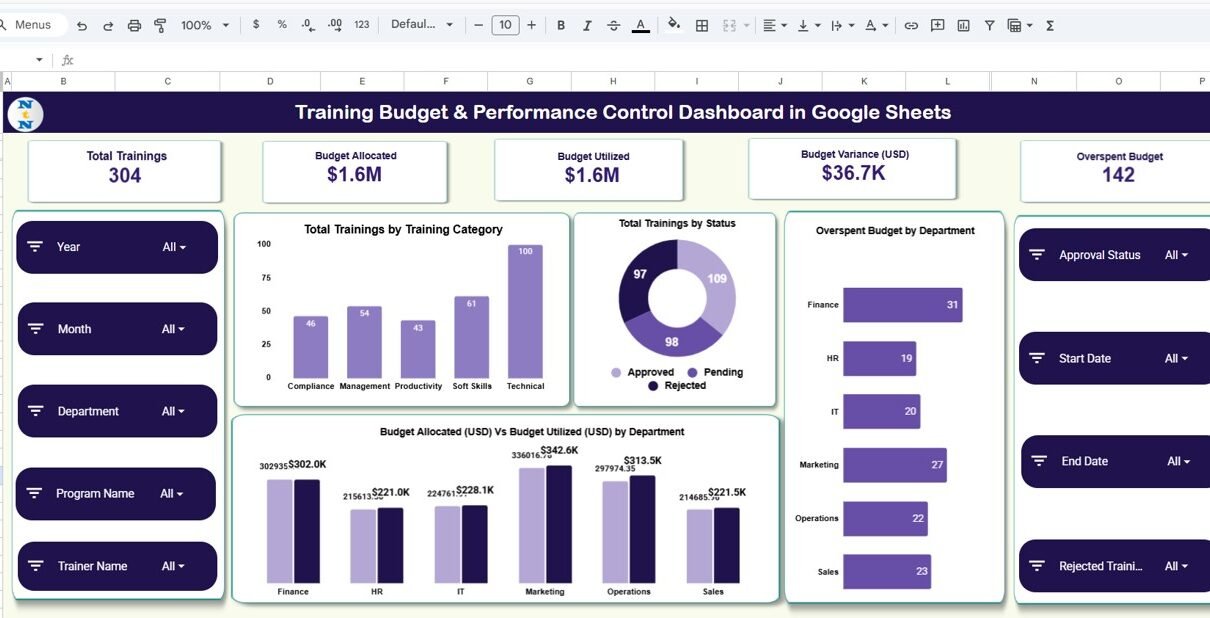
The Overview Sheet acts as the main control panel of the dashboard. It gives leadership an instant snapshot of training volume, budget usage, and overspending risks.
Overview Cards (Key Metrics)
The dashboard starts with six high-impact KPI cards:
Total Trainings
Shows the total number of trainings conducted during the selected period.
This metric helps leaders understand training scale and activity levels.
Budget Allocated
Displays the total training budget approved across all departments.
This helps finance teams monitor planned spending.
Budget Utilized
Shows how much of the allocated budget has already been spent.
It provides immediate visibility into current cost consumption.
Budget Variance (USD)
Calculates the difference between allocated and utilized budget.
A negative variance highlights overspending risk.
Overspent Budget
Shows the total amount spent beyond the allocated budget.
This card acts as an early warning indicator for cost control.
Overview Charts
Click to Buy Training Budget & Performance Control Dashboard in Google Sheets
Overspent Budget by Department
This chart highlights departments where training costs exceed planned budgets.
It helps management identify cost-control issues quickly.
Total Trainings by Status
Shows how many trainings fall under:
- Planned
- Completed
- Ongoing
- Cancelled
This chart improves visibility into execution efficiency.
Total Trainings by Training Category
Displays training distribution by category, such as:
- Technical
- Leadership
- Compliance
- Soft Skills
- Functional
It helps HR teams balance training portfolios effectively.
Budget Allocated (USD) vs Budget Utilized (USD) by Department
This comparison chart shows whether departments stay within their training budgets.
It supports accountability and financial discipline.

Click to Buy Training Budget & Performance Control Dashboard in Google Sheets
Department Analysis Sheet – Department-Wise Training Insights
The Department Analysis sheet focuses on how each department performs in terms of training volume, budget usage, and duration.
Department Analysis Charts
Budget Variance (USD) by Department
Highlights departments with surplus or overspent training budgets.
Total Trainings by Department
Shows which departments conduct the highest and lowest number of trainings.
Budget Utilized (USD) by Department
Helps compare spending patterns across departments.
Average Training Duration (Days) by Department
Shows how long trainings typically last in each department.
Longer durations may signal higher costs or deeper skill requirements.
This sheet helps leaders optimize department-wise training strategies.

Click to Buy Training Budget & Performance Control Dashboard in Google Sheets
Program Analysis Sheet – Program-Level Performance Tracking
The Program Analysis sheet dives deeper into individual training programs.
Program Analysis Charts
Budget Variance (USD) by Program Name
Shows which programs exceed or stay within budget.
Total Trainings by Program Name
Highlights the most frequently conducted training programs.
Budget Utilized (USD) by Program Name
Helps identify high-cost programs that need review.
Average Training Duration (Days) by Program Name
Displays how long each program typically runs.
This insight helps in planning cost-effective program structures.
This analysis supports data-driven decisions on which programs to expand, redesign, or discontinue.

Click to Buy Training Budget & Performance Control Dashboard in Google Sheets
Trainer Analysis Sheet – Trainer Performance & Cost Control
The Trainer Analysis sheet evaluates trainer-wise efficiency and cost impact.
Trainer Analysis Charts
Budget Variance (USD) by Trainer Name
Identifies trainers associated with budget overruns.
Budget Utilized (USD) by Trainer Name
Helps compare trainer costs and engagement levels.
Average Training Duration (Days) by Trainer Name
Shows how long each trainer typically conducts sessions.
This helps evaluate efficiency and delivery style.
This sheet supports smarter trainer selection and negotiation.

Search Functionality – Find Any Training Record Instantly
The dashboard includes a powerful Search Panel that allows users to:
- Enter a Search Keyword
- Select a Field Name (Department, Program, Trainer, Category, Status, etc.)
The dashboard instantly filters matching records.
Benefits of Search Feature:
- Faster audits
- Quick management reviews
- Easy troubleshooting
- Improved data accuracy
- Better compliance tracking

Click to Buy Training Budget & Performance Control Dashboard in Google Sheets
Why Organizations Need a Training Budget & Performance Control Dashboard
Organizations invest heavily in training, yet many fail to measure its financial and operational impact. This dashboard helps organizations:
- Control training overspending
- Track department-wise budgets
- Improve training ROI
- Optimize program selection
- Enhance accountability
- Improve planning accuracy
With real-time visibility, decision-makers act faster and smarter.
Advantages of the Training Budget & Performance Control Dashboard
Centralized Training Management
All training data stays in one structured place.
Real-Time Budget Monitoring
Leaders identify overspending before it escalates.
Improved Financial Discipline
Departments remain accountable for training budgets.
Better Program Planning
Low-impact programs get replaced with high-value ones.
Trainer Performance Visibility
Trainer costs and duration trends remain transparent.
Easy Collaboration
Google Sheets supports multi-user access instantly.
Opportunities for Improvement
Click to Buy Training Budget & Performance Control Dashboard in Google Sheets
You can further enhance the dashboard by adding:
- Training ROI calculation
- Skill improvement tracking
- Certification completion tracking
- Post-training feedback analysis
- Automation using Google Apps Script
- Forecasted training budgets
These additions transform the dashboard into a full L&D intelligence system.
Best Practices for Using the Dashboard
- Update training data regularly
- Review budget variance monthly
- Monitor overspending early
- Compare department trends quarterly
- Use program insights for annual planning
- Train HR teams on consistent data entry
Conclusion
Click to Buy Training Budget & Performance Control Dashboard in Google Sheets
The Training Budget & Performance Control Dashboard in Google Sheets gives organizations complete visibility into training costs, utilization, and performance. It replaces scattered spreadsheets with a structured, visual, and real-time control system. With clear cards, insightful charts, and powerful search functionality, this dashboard helps HR and finance teams control budgets while improving learning outcomes.
By adopting this dashboard, organizations move from reactive cost tracking to proactive training management.
Frequently Asked Questions (FAQs)
1. Who should use this dashboard?
HR teams, L&D teams, finance teams, department heads, and leadership.
2. Can I customize training categories and departments?
Yes, the dashboard is fully customizable.
3. Does it support multi-department organizations?
Yes, it works for organizations of any size.
4. Can I track trainer performance?
Yes, the Trainer Analysis sheet provides detailed insights.
5. Is Google Sheets secure for training data?
Yes, with proper access controls.
6. Can this dashboard track historical trends?
Yes, historical data remains available for analysis.
Visit our YouTube channel to learn step-by-step video tutorials
Youtube.com/@NeotechNavigators
Watch the step-by-step video tutorial:
Click to Buy Training Budget & Performance Control Dashboard in Google Sheets