Influencer marketing has become one of the strongest digital marketing channels. However, many businesses still struggle to measure whether influencer campaigns actually generate value. When teams rely only on likes, followers, or impressions, they miss the true picture of return on investment. Because of this challenge, an Influencer ROI KPI Dashboard in Google Sheets becomes an essential tool for modern marketing teams.Influencer ROI KPI Dashboard in Google Sheets
This ready-to-use dashboard helps organizations track influencer performance, campaign cost, engagement, conversions, and ROI in one structured system. It converts raw campaign data into clear KPIs, trend analysis, and comparisons. As a result, marketers make faster, data-driven decisions and improve campaign profitability.Influencer ROI KPI Dashboard in Google Sheets
In this article, you will learn what the dashboard is, how it works, which KPIs it includes, how each worksheet functions, and how you can use it to improve influencer marketing outcomes.Influencer ROI KPI Dashboard in Google Sheets
What Is an Influencer ROI KPI Dashboard in Google Sheets?
Click to Buy Influencer ROI KPI Dashboard in Google Sheets
An Influencer ROI KPI Dashboard is a centralized reporting solution that tracks influencer campaign performance across cost, engagement, reach, conversions, and revenue. It measures whether influencer spend generates real business value.
Because this dashboard runs in Google Sheets, it offers:
-
Easy collaboration
-
Real-time updates
-
Zero software cost
-
Flexible KPI customization
-
Automated calculations
Marketing teams, brand managers, and growth teams use this dashboard to monitor influencer effectiveness across months and years.Influencer ROI KPI Dashboard in Google Sheets
Key Features of the Influencer ROI KPI Dashboard
This dashboard comes with 6 structured worksheets, each designed for clarity, accuracy, and performance tracking.Influencer ROI KPI Dashboard in Google Sheets
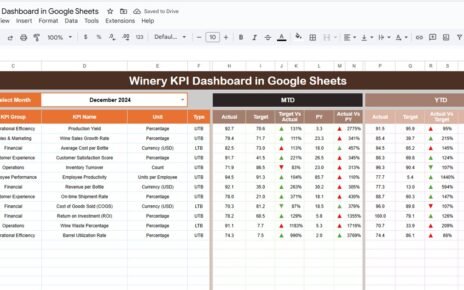
Dashboard Sheet Tab (Main Page)
Click to Buy Influencer ROI KPI Dashboard in Google Sheets
This is the main reporting page.
-
You select the month in cell D3
-
All KPI values update instantly
-
You see MTD and YTD performance together
Metrics Displayed
-
MTD Actual, Target, Previous Year
-
MTD Target vs Actual
-
MTD PY vs Actual
-
YTD Actual, Target, Previous Year
-
YTD Target vs Actual
-
YTD PY vs Actual
Conditional formatting arrows highlight performance:
-
Green → Positive trend
-
Red → Underperformance
This layout allows leadership teams to review campaign results within seconds.

Click to Buy Influencer ROI KPI Dashboard in Google Sheets
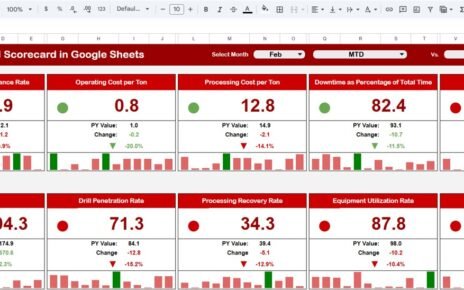
KPI Trend Sheet Tab
This sheet focuses on deep KPI analysis.
-
Select KPI from dropdown in cell C3
-
View KPI Group, Unit, Type (LTB/UTB)
-
See KPI Formula and Definition
-
Analyze monthly trend charts
This sheet helps teams identify growth patterns, declining metrics, and optimization opportunities.

Actual Number Sheet Tab
This is the data-entry sheet for actual campaign performance.
-
Enter MTD and YTD values
-
Select the first month of the year in cell E1
-
The structure auto-aligns months
Once data is entered, the dashboard updates automatically.

Click to Buy Influencer ROI KPI Dashboard in Google Sheets
Target Sheet Tab
This sheet stores MTD and YTD KPI targets, such as:
-
Target ROI
-
Target engagement rate
-
Target conversions
Targets help teams measure success objectively.

Previous Year Number Sheet Tab
This sheet holds last year’s campaign data.
It enables year-over-year comparison and long-term performance tracking.

Click to Buy Influencer ROI KPI Dashboard in Google Sheets
KPI Definition Sheet Tab
This is the reference sheet that ensures KPI clarity.
It contains:
-
KPI Name
-
KPI Group
-
Unit
-
Formula
-
Definition
-
KPI Type (Lower / Upper the Better)

Click to Buy Influencer ROI KPI Dashboard in Google Sheets
Advantages of Influencer ROI KPI Dashboard
-
Clear visibility into campaign profitability
-
Better influencer selection decisions
-
Improved budget allocation
-
Faster performance reviews
-
Strong year-over-year comparison
-
Reduced dependency on vanity metrics
Opportunities for Improvement in Influencer ROI Tracking
-
Add platform-specific KPIs (Instagram, YouTube, TikTok)
-
Integrate affiliate tracking links
-
Automate data import from social platforms
-
Include sentiment analysis
-
Add influencer tier classification
Best Practices for Using the Dashboard
Click to Buy Influencer ROI KPI Dashboard in Google Sheets
-
Update campaign data weekly
-
Track ROI alongside engagement metrics
-
Compare influencer-wise performance
-
Review KPI trends monthly
-
Remove underperforming influencers early
-
Focus on revenue-based KPIs
Conclusion
An Influencer ROI KPI Dashboard in Google Sheets helps marketing teams move beyond vanity metrics and focus on real business impact. It provides complete visibility into cost, engagement, conversions, and ROI in one structured dashboard. Because it uses Google Sheets, teams gain flexibility, speed, and clarity without expensive tools. When used consistently, this dashboard becomes a powerful growth engine for influencer marketing strategies.
Frequently Asked Questions (FAQs)
Click to Buy Influencer ROI KPI Dashboard in Google Sheets
1. Who should use this dashboard?
Marketing teams, brand managers, and growth teams.
2. Does it support MTD and YTD analysis?
Yes, both views are built-in.
3. Can I customize KPIs?
Yes, the KPI Definition sheet supports full customization.
4. Is it suitable for small businesses?
Yes, it works for any business size.
5. Does it require coding?
No, it runs fully on formulas.
Visit our YouTube channel to learn step-by-step video tutorials
Youtube.com/@NeotechNavigators
Watch the step-by-step video tutorial: