Every organization depends on efficient workflows to meet deadlines, balance workloads, and achieve business goals. Tasks move across teams, priorities change frequently, and workloads shift constantly. However, when task data stays scattered across emails, tools, or manual spreadsheets, managers struggle to track efficiency and identify bottlenecks.Workflow Efficiency Monitoring Dashboard in Google Sheets
That is exactly why a Workflow Efficiency Monitoring Dashboard in Google Sheets becomes a powerful operational management solution.Workflow Efficiency Monitoring Dashboard in Google Sheets
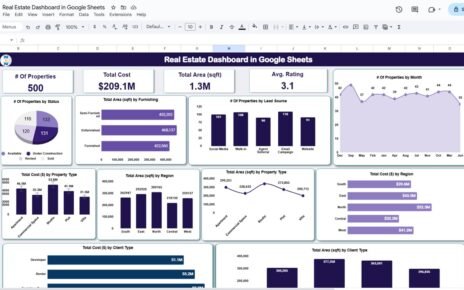
This ready-to-use dashboard helps teams monitor task progress, workload distribution, overdue tasks, and overall efficiency from one centralized view. It combines KPI cards, visual charts, and a smart search feature to support faster and more informed decisions.
In this article, we will explain how this dashboard works, what insights it provides, its advantages, improvement opportunities, best practices, and answers to common questions.Workflow Efficiency Monitoring Dashboard in Google Sheets
What Is a Workflow Efficiency Monitoring Dashboard in Google Sheets?
Click to Buy Workflow Efficiency Monitoring Dashboard in Google Sheets
A Workflow Efficiency Monitoring Dashboard is a performance tracking tool designed to measure how effectively tasks flow through an organization. It tracks task completion, delays, workload balance, priority handling, and efficiency scores.
Because this dashboard is built in Google Sheets, it offers:
-
Real-time collaboration
-
Automatic calculations and charts
-
Easy updates without technical skills
-
Secure sharing and access control
-
No additional software cost
As a result, managers gain instant visibility into workflow health and team productivity.
Key Features of the Workflow Efficiency Monitoring Dashboard
This dashboard is a ready-to-use solution with a structured layout and multiple analysis views:
-
Executive-level KPI cards
-
Department, task type, and priority analysis
-
Monthly performance trends
-
Workload and efficiency scoring
-
Powerful search by keyword and field name
Each feature supports better workflow planning and execution.
Overview Sheet Tab
Click to Buy Workflow Efficiency Monitoring Dashboard in Google Sheets
The Overview Sheet provides a high-level summary of workflow performance.
KPI Cards
The dashboard displays the following cards:
-
Total Task – Total number of tasks created
-
Work Load Score – Overall workload intensity score
-
Completed Task – Number of tasks completed
-
Overdue Task – Tasks that missed deadlines
-
Efficiency (%) – Overall workflow efficiency percentage
These cards give managers an instant understanding of operational health.
Overview Charts
The overview section includes the following charts:
Completed Task by Assigned To
Shows how many tasks each team member has completed, helping identify top performers and workload balance.
Work Load Score by Department
Highlights workload distribution across departments to prevent burnout or underutilization.
Total Task by Status
Displays task distribution by status such as Completed, In Progress, Pending, or Overdue.
Total Task by Priority
Shows how tasks are spread across priority levels, helping teams manage urgency effectively.

Click to Buy Workflow Efficiency Monitoring Dashboard in Google Sheets
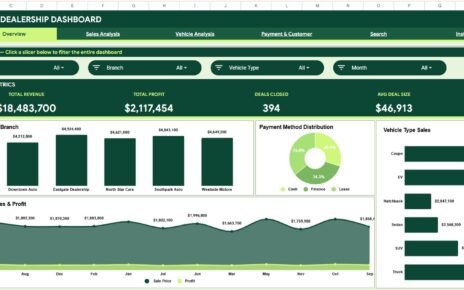
Department Performance Analysis
This section focuses on workflow efficiency at the department level.
Charts Included
-
Overdue Task by Department
-
Status Score by Department
-
Pending Task by Department
-
Work Load Score by Department
These charts help leaders identify departments facing delays, heavy workloads, or process inefficiencies.

Click to Buy Workflow Efficiency Monitoring Dashboard in Google Sheets
Task Type Analysis
Different task types require different effort levels and timelines. This section analyzes performance by task category.
Charts Included
-
Overdue Task by Task Type
-
Status Score by Task Type
-
Pending Task by Task Type
-
Work Load Score by Task Type
This analysis helps organizations redesign workflows for complex or high-risk task types.

Click to Buy Workflow Efficiency Monitoring Dashboard in Google Sheets
Priority Summary
This section evaluates how effectively teams handle task priorities.
Charts Included
-
Overdue Task by Priority
-
Status Score by Priority
-
Pending Task by Priority
-
Work Load Score by Priority
These insights ensure high-priority tasks receive timely attention and resources.

Click to Buy Workflow Efficiency Monitoring Dashboard in Google Sheets
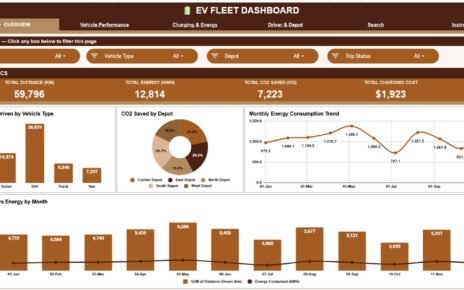
Monthly Trends
Trends reveal whether workflow efficiency improves or declines over time.
Charts Included
-
Overdue Task by Month
-
Status Score by Month
-
Work Load Score by Month
By reviewing monthly trends, managers can assess the impact of process changes and resource planning decisions.

Click to Buy Workflow Efficiency Monitoring Dashboard in Google Sheets
Search Functionality – Search by Keyword and Field Name
The dashboard includes a powerful Search feature that allows users to filter tasks instantly.
Users can search by:
-
Task name
-
Assigned to
-
Department
-
Task type
-
Priority
-
Status
This feature helps teams:
-
Find specific tasks quickly
-
Respond to management queries faster
-
Prepare reports easily
-
Track overdue or pending work efficiently

Click to Buy Workflow Efficiency Monitoring Dashboard in Google Sheets
Why Organizations Need a Workflow Efficiency Monitoring Dashboard
Without structured monitoring, workflows become inefficient and unpredictable. This dashboard helps organizations:Workflow Efficiency Monitoring Dashboard in Google Sheets
-
Improve task completion rates
-
Reduce overdue work
-
Balance workloads across teams
-
Increase operational transparency
-
Support data-driven decision-making
-
Enhance accountability and performance
Advantages of Using This Dashboard in Google Sheets
Click to Buy Workflow Efficiency Monitoring Dashboard in Google Sheets
-
Centralized workflow tracking
-
Real-time collaboration
-
Clear visibility into bottlenecks
-
Faster performance reviews
-
Easy customization and scalability
-
No expensive BI or project tools required
Opportunities for Improvement
Organizations can enhance this dashboard further by:
-
Adding SLA or deadline compliance KPIs
-
Integrating Google Forms for task intake
-
Automating alerts for overdue tasks
-
Linking efficiency scores to performance reviews
-
Adding predictive workload analysis
Best Practices for Using the Workflow Efficiency Dashboard
Click to Buy Workflow Efficiency Monitoring Dashboard in Google Sheets
-
Update task data regularly
-
Review overdue tasks daily
-
Balance workloads proactively
-
Monitor priority handling closely
-
Share insights with department heads
-
Use trends to improve planning and execution
Conclusion
A Workflow Efficiency Monitoring Dashboard in Google Sheets provides a structured and visual way to manage tasks, workloads, and efficiency. It replaces guesswork with real-time insights and helps organizations improve productivity, accountability, and performance.
Because the dashboard is simple, collaborative, and scalable, it becomes a valuable long-term tool for teams focused on operational excellence.Workflow Efficiency Monitoring Dashboard in Google Sheets
Frequently Asked Questions (FAQs)
Click to Buy Workflow Efficiency Monitoring Dashboard in Google Sheets
1. Who should use this dashboard?
Project managers, operations teams, department heads, and leadership.
2. Can this dashboard support multiple departments?
Yes, it supports department-wise and role-based analysis.
3. Is Google Sheets secure for workflow data?
Yes, with proper access permissions and sharing controls.
4. Can task types and priorities be customized?
Yes, all categories and fields can be modified easily.
5. Does this dashboard support scalability?
Yes, it works for small teams and large organizations.
Visit our YouTube channel to learn step-by-step video tutorials
Youtube.com/@NeotechNavigators
Watch the step-by-step video tutorial:
Click to Buy Workflow Efficiency Monitoring Dashboard in Google Sheets