Customer complaints directly impact brand reputation, customer loyalty, and revenue. When organizations fail to track complaints properly, resolution delays increase and customer satisfaction drops. Many teams still rely on emails, ticket logs, or disconnected spreadsheets, which makes complaint tracking inconsistent and reactive.Customer Complaint Resolution KPI Dashboard in Google Sheets
This challenge makes a Customer Complaint Resolution KPI Dashboard in Google Sheets extremely valuable.
This ready-to-use KPI dashboard helps customer support teams, service managers, and leadership track complaint volumes, resolution speed, service quality, and trends using a single, centralized Google Sheets dashboard.
In this article, we explain how the dashboard works, its worksheet structure, a complete KPI list with formulas, and best practices for complaint resolution tracking.Customer Complaint Resolution KPI Dashboard in Google Sheets
What Is a Customer Complaint Resolution KPI Dashboard in Google Sheets?
Click to Buy Customer Complaint Resolution KPI Dashboard in Google Sheets
A Customer Complaint Resolution KPI Dashboard is a performance tracking tool designed to monitor how effectively an organization handles customer complaints. It measures complaint volume, resolution time, resolution quality, backlog, and customer satisfaction.Customer Complaint Resolution KPI Dashboard in Google Sheets
Because this dashboard runs in Google Sheets, it offers:
-
Centralized complaint reporting
-
Easy collaboration across teams
-
Real-time KPI updates
-
Clear target vs actual tracking
-
No need for expensive CRM or BI tools
This dashboard suits customer support teams, CX managers, quality teams, and senior leadership.
Key Features of the Customer Complaint Resolution KPI Dashboard
The dashboard includes 6 structured worksheet tabs, each designed to support accurate complaint tracking and analysis.
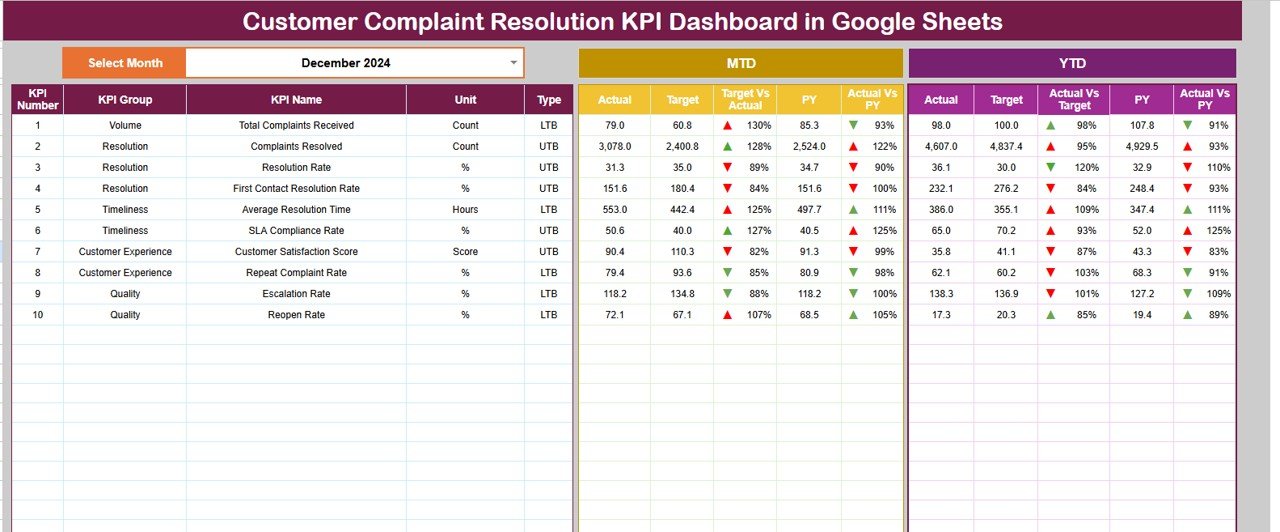
Dashboard Sheet Tab (Main Dashboard)
The Dashboard Sheet provides a consolidated view of all complaint resolution KPIs.
-
Select the month from the dropdown in cell D3
-
All KPIs update automatically for the selected month
Metrics Displayed
MTD (Month-to-Date)
-
Actual
-
Target
-
Previous Year
-
Target vs Actual
-
Previous Year vs Actual
YTD (Year-to-Date)
-
Actual
-
Target
-
Previous Year
-
Target vs Actual
-
Previous Year vs Actual
Conditional formatting with up and down arrows visually highlights performance improvement or decline.
Click to Buy Customer Complaint Resolution KPI Dashboard in Google Sheets
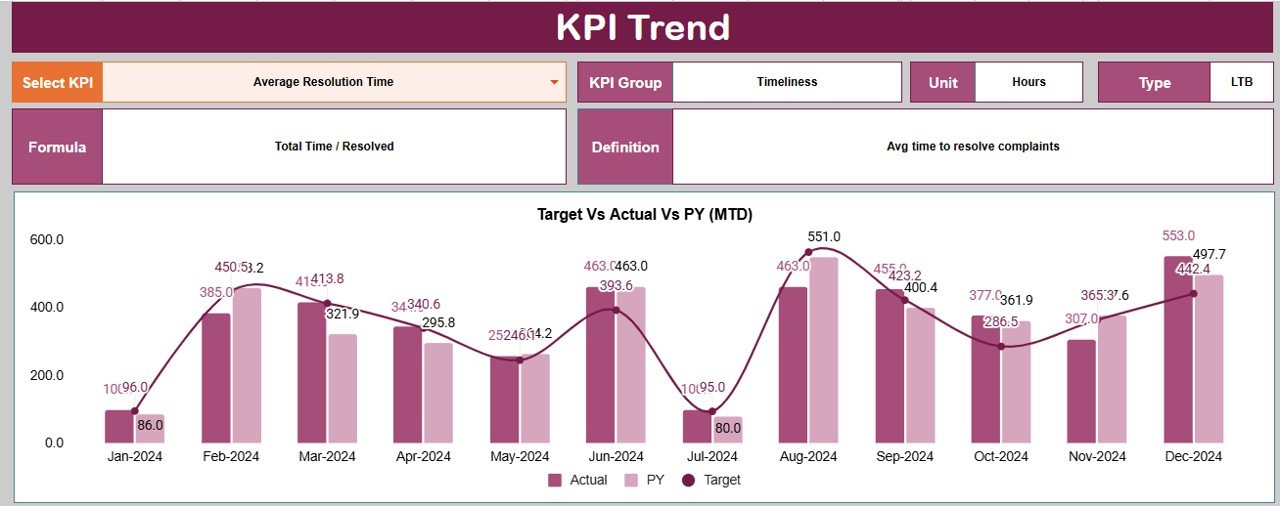
KPI Trend Sheet Tab
The KPI Trend Sheet supports detailed KPI-level analysis.
-
Select the KPI name from the dropdown in cell C3
This sheet displays:
-
KPI Group
-
Unit of Measurement
-
KPI Type (Upper the Better / Lower the Better)
-
KPI Formula
-
KPI Definition
It also shows month-wise KPI trends to help teams understand performance movement over time.
Click to Buy Customer Complaint Resolution KPI Dashboard in Google Sheets
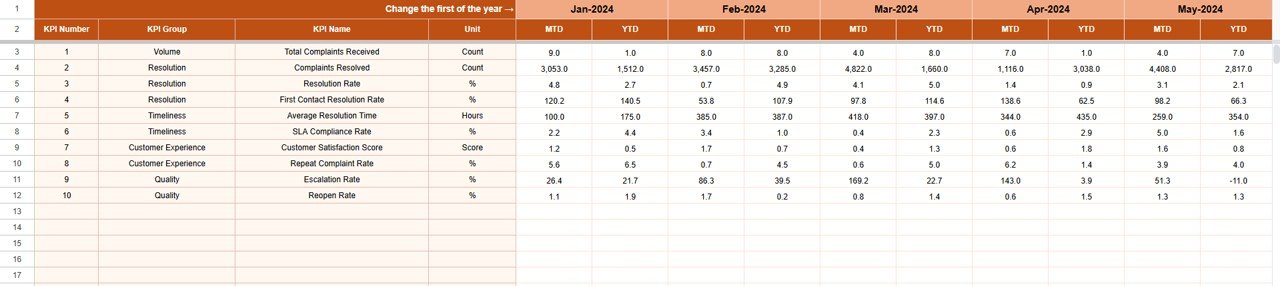
Actual Number Sheet Tab
This sheet stores actual complaint performance data.
-
Select the first month of the year in cell E1
-
Enter MTD and YTD actual values for each KPI
All dashboard visuals update automatically.
Click to Buy Customer Complaint Resolution KPI Dashboard in Google Sheets
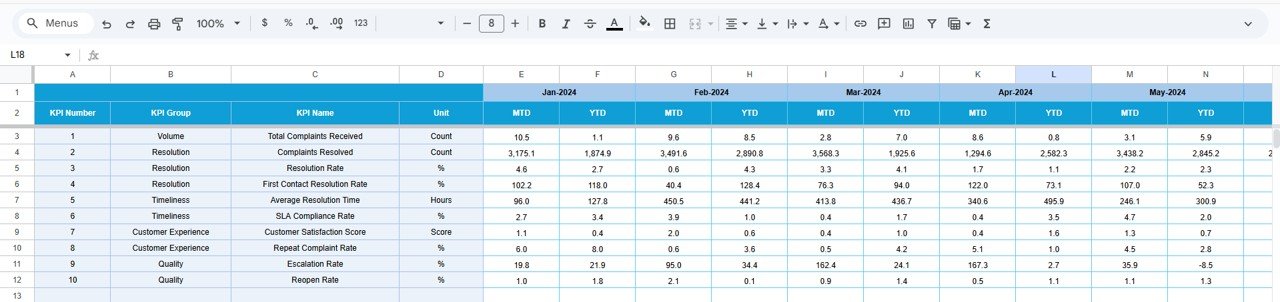
Target Sheet Tab
The Target Sheet stores performance goals.
-
Monthly (MTD) targets
-
Annual (YTD) targets
Targets help teams set clear expectations for complaint resolution performance.
Click to Buy Customer Complaint Resolution KPI Dashboard in Google Sheets
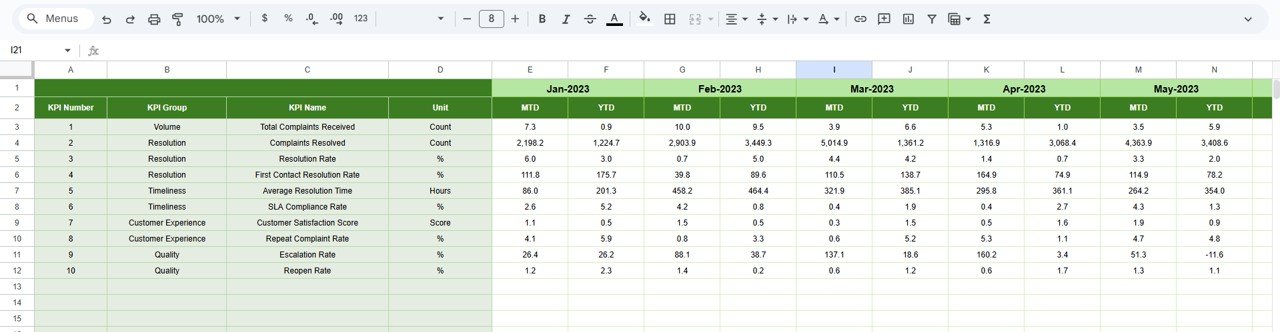
Previous Year Number Sheet Tab
This sheet stores previous year complaint data.
It supports:
-
Year-over-year comparison
-
Benchmarking improvements
-
Historical performance analysis
Click to Buy Customer Complaint Resolution KPI Dashboard in Google Sheets
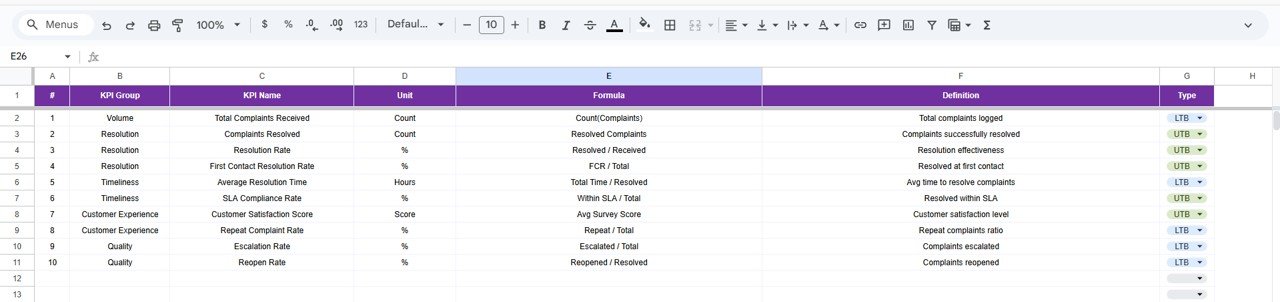
KPI Definition Sheet Tab
The KPI Definition Sheet forms the foundation of the dashboard.
It includes:
-
KPI Name
-
KPI Group
-
Unit
-
Formula
-
KPI Definition
-
KPI Type (UTB / LTB)
This ensures transparency and consistency.
Click to Buy Customer Complaint Resolution KPI Dashboard in Google Sheets
Advantages of Customer Complaint Resolution KPI Dashboard
-
Centralized complaint performance tracking
-
Clear SLA and resolution visibility
-
Faster management decision-making
-
Improved customer satisfaction
-
Reduced backlog and escalation
-
Cost-effective Google Sheets solution
Opportunities for Improvement in Complaint Management
Click to Buy Customer Complaint Resolution KPI Dashboard in Google Sheets
-
Integrate CRM or ticketing tools
-
Add root cause analysis KPIs
-
Track complaint categories and channels
-
Introduce predictive backlog alerts
-
Monitor sentiment analysis trends
-
Add customer journey mapping
Best Practices for Using the Dashboard
-
Define complaint categories clearly
-
Set realistic SLA targets
-
Update data daily
-
Review trends weekly
-
Train agents on resolution quality
-
Use insights for process improvement
Conclusion
Click to Buy Customer Complaint Resolution KPI Dashboard in Google Sheets
A Customer Complaint Resolution KPI Dashboard in Google Sheets provides organizations with a structured and transparent way to measure complaint handling effectiveness. By tracking MTD, YTD, targets, and historical performance, teams gain actionable insights into service quality and operational efficiency. Because the dashboard runs in Google Sheets, it remains flexible, collaborative, and easy to maintain.
For organizations focused on customer experience excellence, this dashboard becomes an essential performance management tool.
Frequently Asked Questions (FAQs)
1. Who should use this dashboard?
Customer support teams, CX managers, and leadership.
2. Can KPIs be customized?
Yes, all KPIs and formulas are editable.
3. Does it support SLA tracking?
Yes, SLA compliance KPIs are included.
4. Can it track multiple support channels?
Yes, with appropriate data structure.
5. Is Google Sheets secure for complaint data?
Yes, with access control and permissions.
6. Can this dashboard support audits and reviews?
Yes, it provides structured and transparent reporting.
Visit our YouTube channel to learn step-by-step video tutorials
Youtube.com/@NeotechNavigators
Watch the step-by-step video tutorial:
Click to Buy Customer Complaint Resolution KPI Dashboard in Google Sheets