Managing office events without clear visibility into attendance, costs, and feedback often leads to budget overruns and low engagement. Spreadsheets filled with raw data rarely tell the full story. That is why an Office Event Attendance Dashboard in Google Sheets becomes an essential tool for HR teams, admin teams, and event planners.Office Event Attendance Dashboard in Google Sheets
In this article, we explain how this ready-to-use Office Event Attendance Dashboard in Google Sheets works, its sheet-wise structure, key metrics, and how it helps organizations track and improve event performance with data-driven decisions.Office Event Attendance Dashboard in Google Sheets
What Is an Office Event Attendance Dashboard in Google Sheets?
An Office Event Attendance Dashboard in Google Sheets is an interactive reporting tool that converts event-level data into clear KPIs, charts, and insights. Instead of manually reviewing attendance sheets and expense reports, you get a centralized dashboard that shows:Office Event Attendance Dashboard in Google Sheets
-
Total number of events
-
Expected vs actual attendance
-
Event costs and ROI indicators
-
Feedback scores
-
Performance trends by event type, venue, planner, month, and year
Because it is built in Google Sheets, the dashboard remains accessible, shareable, and easy to customize without advanced technical skills.
Why Use Google Sheets for Event Attendance Tracking?
Click to Buy Office Event Attendance Dashboard in Google Sheets
Google Sheets offers flexibility and collaboration that many teams prefer over complex software tools.Office Event Attendance Dashboard in Google Sheets
Key reasons to use Google Sheets:
-
Cloud-based access from anywhere
-
Real-time collaboration
-
Easy integration with Forms and other data sources
-
No additional software cost
-
Fully customizable dashboards
This dashboard leverages these strengths while adding structured analytics and visual clarity.
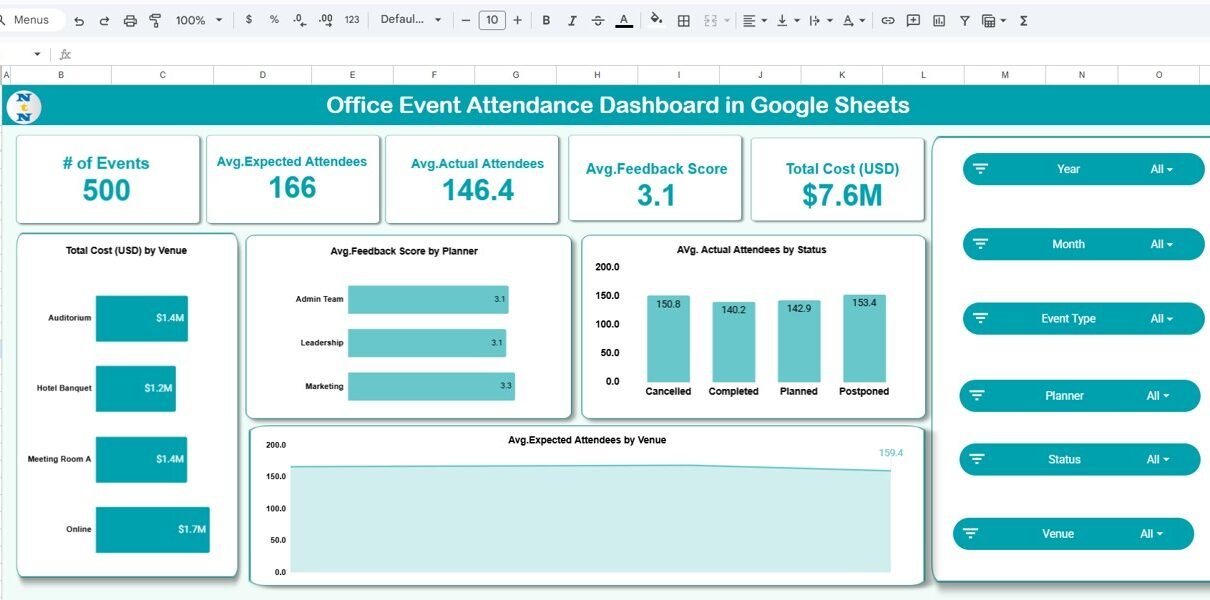
Overview Sheet – Executive Summary
The Overview sheet provides a quick snapshot of overall event performance.
KPI Cards on Overview
The top section displays high-level KPIs such as:
-
# of Events
-
Average Expected Attendees
-
Average Actual Attendees
-
Average Feedback Score
-
Total Cost (USD)
These KPIs instantly tell decision-makers whether events are meeting expectations.
Overview Charts
The charts on this sheet include:
-
Total Cost (USD) by Venue
-
Average Feedback Score by Planner
-
Average Actual Attendees by Event Status
-
Average Expected Attendees by Venue
Interactive slicers allow filtering by:
-
Year
-
Month
-
Event Type
-
Planner
-
Status
-
Venue
This makes the overview highly dynamic and presentation-ready.

Click to Buy Office Event Attendance Dashboard in Google Sheets
Event Type Analysis Sheet
The Event Type Analysis sheet focuses on performance across different event categories such as Conference, Workshop, Seminar, Training, and Product Launch.
Key Insights from This Sheet
-
Average Expected Attendees by Event Type
-
Average Actual Attendees by Event Type
-
Average Feedback Score by Event Type
-
Total Cost (USD) by Event Type
This analysis helps identify which event formats deliver the highest engagement and value for money.

Click to Buy Office Event Attendance Dashboard in Google Sheets
Venue Utilization Sheet
Venue selection directly impacts attendance and cost. The Venue Utilization sheet helps optimize venue planning.
Charts Included
-
Number of Events by Venue
-
Average Actual Attendees by Venue
-
Total Cost (USD) by Venue
With this data, organizations can:
-
Identify under-utilized venues
-
Compare online vs physical event performance
-
Optimize venue selection for future events

Click to Buy Office Event Attendance Dashboard in Google Sheets
Planner Performance Sheet
The Planner Performance sheet evaluates how different teams or individuals manage events.
Metrics Tracked
-
Average Expected Attendees by Planner
-
Average Actual Attendees by Planner
-
Average Feedback Score by Planner
-
Total Cost (USD) by Planner
This sheet supports fair performance reviews and helps standardize best practices across planning teams.

Click to Buy Office Event Attendance Dashboard in Google Sheets
Search by Keyword and Field Name
The Search sheet is a powerful operational feature.
What It Does
-
Search by any selected column (Event Type, Planner, Venue, Status, Year, Month)
-
Enter a keyword and instantly filter records
-
Display total matching records dynamically
This is especially useful for audits, reviews, and quick data extraction.]

Click to Buy Office Event Attendance Dashboard in Google Sheets
Data Input Sheet
All analytics are driven by the Data Input sheet, where event-level data is entered.
Typical Columns
- Event ID
- Event Date
- Event Type
- Planner
- Venue
- Expected Attendees
- Actual Attendees
- Cost (USD)
- Status
- Feedback Score
- Month
- Year
The structured format ensures pivot-ready analysis and accurate reporting.

Click to Buy Office Event Attendance Dashboard in Google Sheets
Key Benefits of This Dashboard
Advantages
-
Centralized event performance tracking
-
Time-based trend analysis (monthly & yearly)
-
Clear cost visibility by venue, event type, and planner
-
Feedback-driven performance evaluation
-
Instant search and filtering
-
Fully cloud-based and shareable
Opportunities for Improvement
While this dashboard is powerful, teams can further enhance it by:
-
Connecting Google Forms for automated data capture
-
Adding ROI or cost-per-attendee metrics
-
Integrating department-wise or sponsor-wise analysis
-
Automating refresh using Apps Script
Best Practices for Using the Dashboard
Click to Buy Office Event Attendance Dashboard in Google Sheets
To get the most value, follow these best practices:
-
Maintain consistent data entry formats
-
Update event data immediately after completion
-
Use slicers instead of manual filtering
-
Review trends monthly for early insights
-
Share read-only access with stakeholders
Who Can Use This Dashboard?
This dashboard is ideal for:
-
HR & Admin Teams
-
Corporate Event Planners
-
Training & L&D Teams
-
Marketing Event Teams
-
Office Management Departments
Any organization that conducts internal or external events will benefit from this structured approach.
Final Thoughts
Click to Buy Office Event Attendance Dashboard in Google Sheets
The Office Event Attendance Dashboard in Google Sheets transforms scattered event data into actionable insights. Instead of relying on assumptions, teams can measure attendance accuracy, control costs, evaluate planners, and improve future events using real data.
Because it is ready-to-use, interactive, and fully customizable, this dashboard saves time, improves transparency, and supports smarter decision-making for every office event.
Visit our YouTube channel to learn step-by-step video tutorials
Youtube.com/@NeotechNavigators
Watch the step-by-step video tutorial:
Click to Buy Office Event Attendance Dashboard in Google Sheets