Risk Management KPI Scorecard In Google Sheets is no longer limited to audits and checklists. Today, organizations must continuously monitor compliance performance, identify risks early, and take corrective actions on time. However, when compliance data is scattered across emails and spreadsheets, visibility becomes poor and decision-making slows down.Risk Management KPI Scorecard In Google Sheets
That is exactly where the Compliance KPI Scorecard in Google Sheets becomes a powerful and practical solution.
In this article, we explain how the Compliance KPI Scorecard in Google Sheets works, its structure, features, advantages, opportunities for improvement, and best practices for effective compliance tracking.Risk Management KPI Scorecard In Google Sheets
What Is a Compliance KPI Scorecard in Google Sheets?
A Compliance KPI Scorecard in Google Sheets is a ready-to-use performance tracking template designed to measure, monitor, and evaluate compliance KPIs on a monthly and yearly basis.Risk Management KPI Scorecard In Google Sheets
Instead of manually reviewing reports, this scorecard provides:
-
Clear KPI performance status
-
Target vs Actual comparison
-
Previous Year vs Current Year analysis
-
Visual indicators for faster decisions
Because it is built in Google Sheets, it is easy to share, customize, and maintain without any advanced tools.
Why Use Google Sheets for Compliance KPI Tracking?
Click to Buy Risk Management KPI Scorecard In Google Sheets
Google Sheets offers flexibility and accessibility that compliance teams value.Risk Management KPI Scorecard In Google Sheets
Key Benefits
-
Cloud-based access from anywhere
-
Easy collaboration with audit and leadership teams
-
No additional software or BI tools required
-
Simple customization of KPIs and formulas
-
Automatic updates using dropdown selections
This makes Google Sheets an ideal platform for compliance scorecards.
Key Features of the Compliance KPI Scorecard
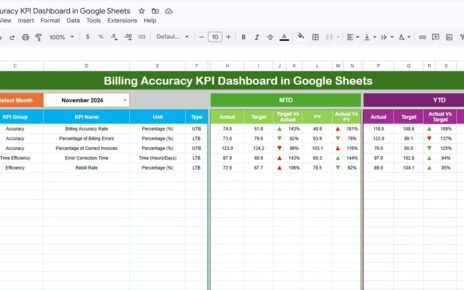
This scorecard includes 10 different compliance KPIs to represent overall compliance health.
Core Highlights
-
Month Dropdown – Select any month to view monthly performance
-
Automatic Updates – All numbers refresh instantly
-
Traffic Light Indicators – Red, Amber, Green KPI status
-
Up & Down Arrows – Percentage change indicators
-
MTD & YTD Views – Switch between monthly and yearly performance
With one click, users can switch between MTD (Month-to-Date) and YTD (Year-to-Date) views.
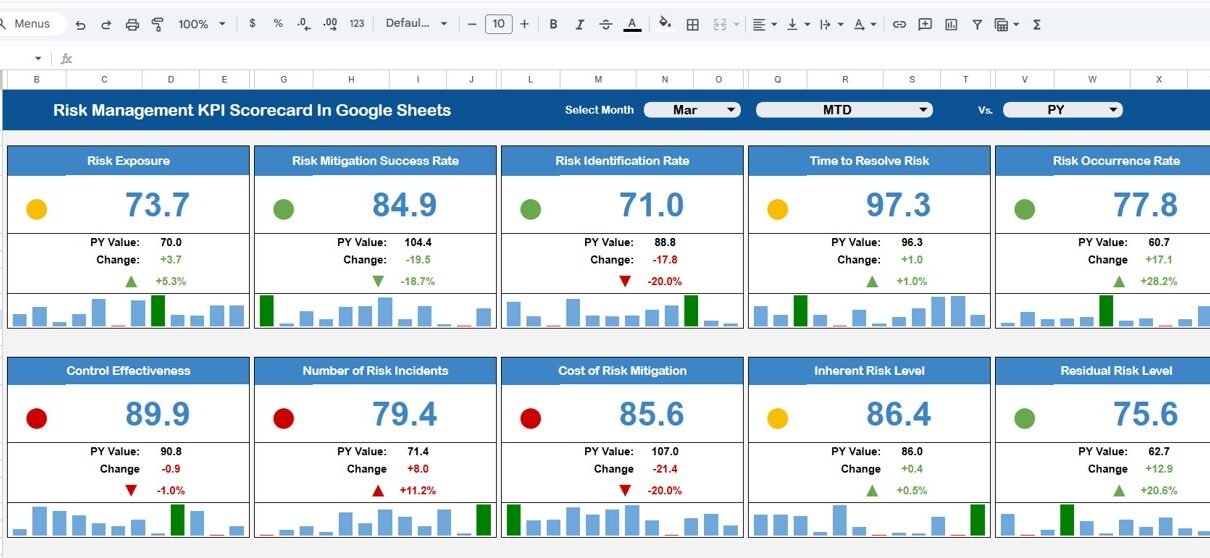
Scorecard Sheet (Main Dashboard)
Click to Buy Risk Management KPI Scorecard In Google Sheets
The Scorecard Sheet is the primary dashboard.
What It Displays
-
KPI Name
-
MTD Actual, Target, and Previous Year
-
Target vs Actual variance (%)
-
Previous Year vs Actual variance (%)
-
YTD Actual, Target, and Previous Year
-
Visual traffic lights and arrows
This layout allows management to instantly understand compliance performance without deep analysis.

Click to Buy Risk Management KPI Scorecard In Google Sheets
KPI Trend Sheet Tab
The KPI Trend Sheet helps analyze individual KPIs over time.
How It Works
-
Select a KPI name from the dropdown in Cell C3
-
Automatically displays:
-
KPI Group
-
KPI Unit
-
KPI Type (Lower the Better / Upper the Better)
-
Monthly KPI trend values
-
This sheet is ideal for identifying compliance improvement or deterioration trends.

Click to Buy Risk Management KPI Scorecard In Google Sheets
KPI Definition Sheet Tab
The KPI Definition Sheet acts as the foundation of the scorecard.
Information Maintained
-
KPI Name
-
KPI Group (Audit, Risk, Legal, Operations, etc.)
-
Unit (%, Count, Days, Score)
-
KPI Formula
-
KPI Definition
-
KPI Type (Lower / Upper the Better)
This ensures KPI clarity, standardization, and audit readiness.

Click to Buy Risk Management KPI Scorecard In Google Sheets
Data Input Sheet Tab
The Data Input Sheet is where actual compliance values are entered.
Key Points
-
Enter MTD and YTD actual numbers
-
Select the month to update data
-
All dashboards update automatically
This keeps data entry simple and structured.

Click to Buy Risk Management KPI Scorecard In Google Sheets
Colour Settings Sheet
The Colour Settings Sheet allows easy control over visual indicators.
What You Can Customize
-
Traffic light thresholds
-
Arrow direction logic
-
Performance color rules
This flexibility helps align the scorecard with organizational compliance standards.

Click to Buy Risk Management KPI Scorecard In Google Sheets
Advantages of Compliance KPI Scorecard in Google Sheets
Advantages
-
Centralized compliance monitoring
-
Clear visibility of risks and gaps
-
Faster decision-making with visual cues
-
Easy monthly and yearly tracking
-
Audit-friendly KPI definitions
-
No dependency on complex BI tools
Opportunities for Improvement in Compliance KPI Tracking
Click to Buy Risk Management KPI Scorecard In Google Sheets
-
Integrate Google Forms for automated data capture
-
Link evidence documents for audits
-
Add department-wise or regulation-wise KPIs
-
Automate alerts for non-compliance
Best Practices for Using Compliance KPI Scorecard
-
Keep KPI definitions approved and consistent
-
Update data on a fixed monthly schedule
-
Review red and amber KPIs in management meetings
-
Use YTD view for strategic compliance planning
-
Archive previous year data for audits
Who Should Use This Compliance KPI Scorecard?
Click to Buy Risk Management KPI Scorecard In Google Sheets
This scorecard is ideal for:
-
Compliance Teams
-
Risk Management Teams
-
Internal Audit Departments
-
Legal & Regulatory Teams
-
Corporate Governance Functions
Any organization that needs structured compliance visibility will benefit from this template.
Final Thoughts
The Compliance KPI Scorecard in Google Sheets converts complex compliance data into a clear, visual, and actionable performance framework. With traffic lights, trend analysis, and MTD/YTD tracking, it helps organizations stay proactive, compliant, and audit-ready.
Visit our YouTube channel to learn step-by-step video tutorials
Youtube.com/@NeotechNavigators
Watch the step-by-step video tutorial: