Running a non-profit organization is not just about passion—it is about measuring impact, ensuring accountability, and using funds effectively. However, tracking performance across programs, fundraising, operations, and outreach can quickly become complex when data is scattered.
That is exactly why the Non-Profit KPI Scorecard in Google Sheets is a powerful and practical solution.
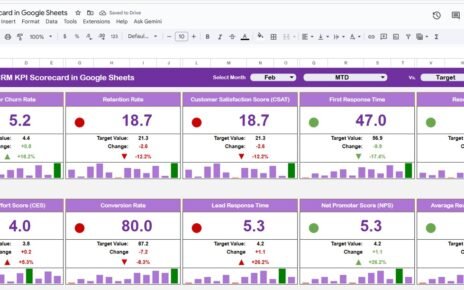
This ready-to-use KPI scorecard template helps non-profit organizations monitor performance using clearly defined KPIs, visual indicators, and automated calculations—all within Google Sheets.
What Is the Non-Profit KPI Scorecard in Google Sheets?
Click to Buy Non-Profit KPI Scorecard In Google Sheets
The Non-Profit KPI Scorecard in Google Sheets is a structured performance management template designed to track 10 key non-profit KPIs in one place. It enables leadership teams, program managers, and donors to clearly understand how the organization is performing against its goals.
The scorecard supports:
-
Monthly and yearly KPI tracking
-
Target vs Actual comparison
-
Traffic-light status indicators
-
Trend analysis for continuous improvement
All visuals and calculations update automatically based on user selections.
Key Features of the Non-Profit KPI Scorecard
-
Tracks 10 predefined KPIs covering impact, efficiency, and sustainability
-
Interactive Month dropdown for monthly scorecards
-
Automatic update of:
-
KPI values
-
Traffic-light colors
-
Up/down percentage change arrows
-
-
Toggle between MTD (Month-to-Date) and YTD (Year-to-Date) views
-
Clear distinction between:
-
Upper the Better (UTB) KPIs
-
Lower the Better (LTB) KPIs
-
Built entirely in Google Sheets, this scorecard is cloud-based, shareable, and easy to customize.
Scorecard Structure Explained
The Non-Profit KPI Scorecard is divided into logical sheet tabs to keep data entry, definitions, and analysis clean and manageable.
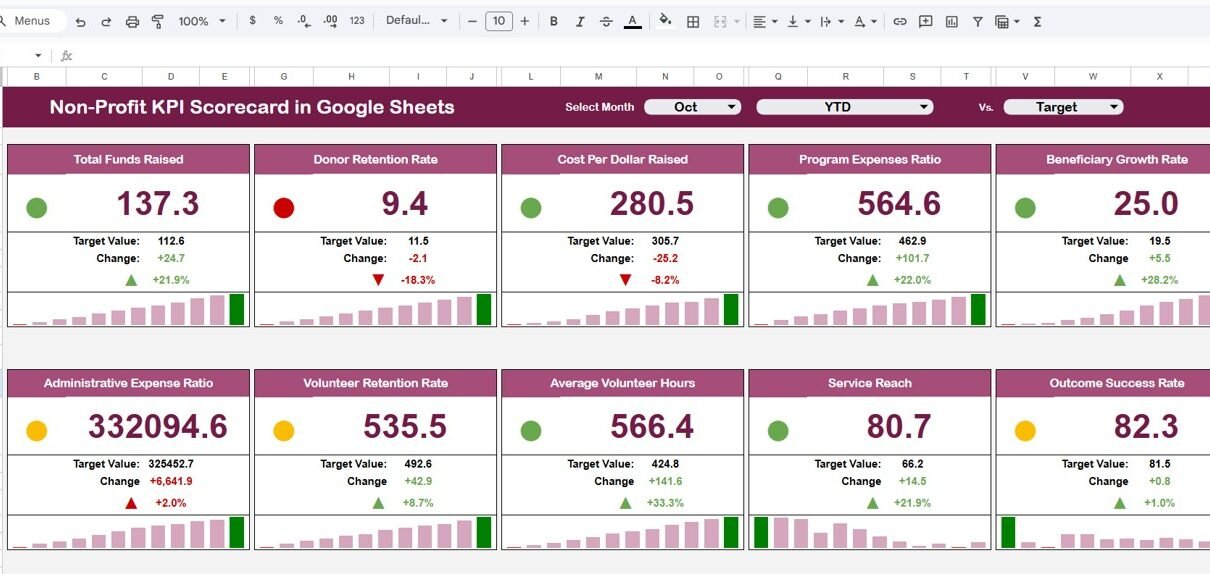
Dashboard Sheet Tab – Performance Overview
Click to Buy Non-Profit KPI Scorecard In Google Sheets
This is the main scorecard view.
🔹 Key Highlights
-
Month selection dropdown at the top
-
Selecting a month instantly updates:
-
KPI numbers
-
Traffic-light indicators
-
Percentage variance arrows
-
🔹 KPI Insights Shown
-
MTD Actual vs Target
-
YTD Actual vs Target
-
Clear visual signals showing whether each KPI is on track or needs attention
This sheet is ideal for board meetings, donor reviews, and leadership updates.

Click to Buy Non-Profit KPI Scorecard In Google Sheets
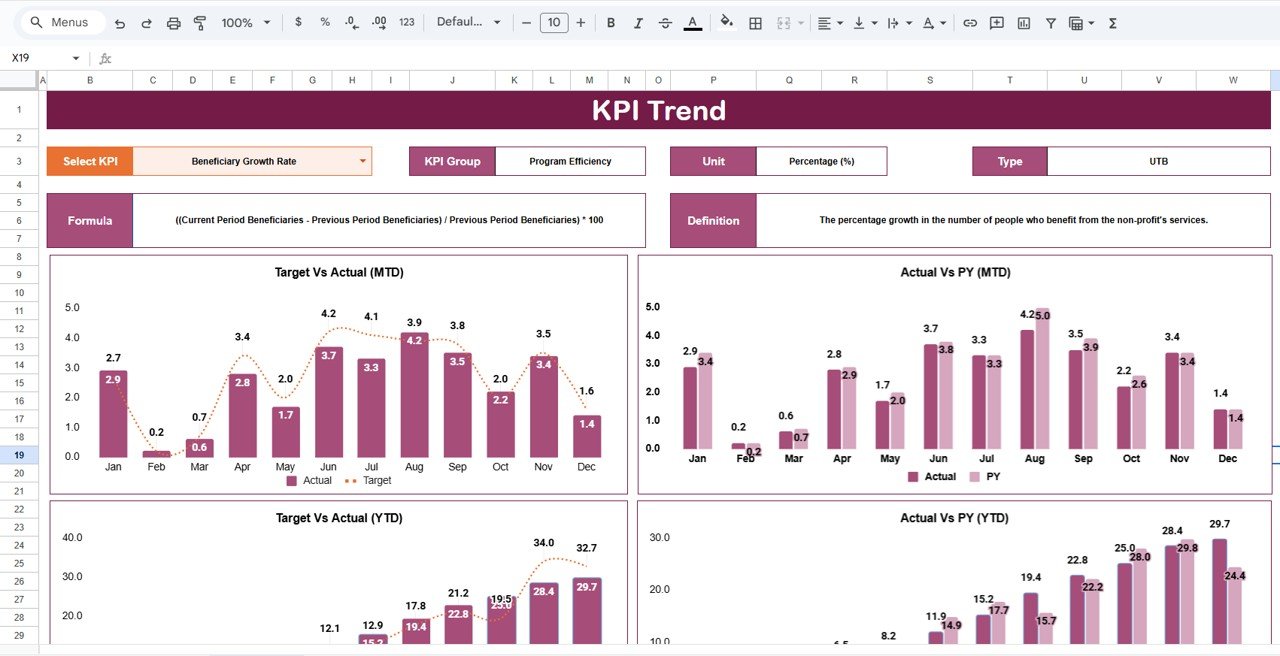
KPI Trend Sheet Tab – Detailed KPI Analysis
This sheet allows you to analyze one KPI at a time.
🔹 How It Works
-
KPI selection dropdown available at Cell C3
Displays:
- KPI Group
- KPI Unit
- KPI Type (UTB / LTB)
- KPI Definition
This ensures everyone understands what is being measured and why it matters.
Click to Buy Non-Profit KPI Scorecard In Google Sheets
KPI Definition Sheet Tab – KPI Master Data
This is the backbone of the scorecard.
🔹 Information Captured
-
KPI Name
-
KPI Group
-
Unit
-
Formula
-
KPI Definition
-
KPI Type (Upper the Better / Lower the Better)
Keeping all KPI logic in one place improves transparency and consistency across the organization.

Click to Buy Non-Profit KPI Scorecard In Google Sheets
Data Input Sheet Tab – Performance Data Entry
This sheet is used to enter actual performance data.
🔹 Key Points
-
Enter KPI values once
-
Data automatically feeds:
-
Dashboard visuals
-
MTD and YTD calculations
-
Trend analysis
-
This reduces manual work and minimizes reporting errors.

Click to Buy Non-Profit KPI Scorecard In Google Sheets
Colour Settings Sheet – Visual Control
This optional sheet allows you to manage scorecard colors.
🔹 Benefits
-
Customize traffic-light thresholds
Adjust colors for:
- Good performance
- Warning levels
- Critical issues
This ensures the scorecard aligns with your organization’s visual standards.

Click to Buy Non-Profit KPI Scorecard In Google Sheets
Benefits for Non-Profit Organizations
-
Clear visibility into organizational performance
-
Improves transparency for donors and stakeholders
-
Saves time on manual reporting
-
Makes data-driven decision-making easier
-
Fully cloud-based and collaborative
-
Reusable every year with minimal changes
Opportunities for Improvement
-
Add program-wise or donor-wise filters
-
Include financial sustainability KPIs
-
Integrate charts for impact storytelling
-
Connect data from fundraising or CRM tools
Best Practices for Using This Scorecard
Click to Buy Non-Profit KPI Scorecard In Google Sheets
-
Review KPIs monthly using the MTD view
-
Track long-term progress with YTD analysis
-
Keep KPI definitions standardized
-
Share read-only access with board members
-
Update targets annually
Who Should Use This KPI Scorecard?
-
Non-Profit Organizations
-
NGOs and Foundations
-
Program and Impact Managers
-
Donor Reporting Teams
-
Board Members and Leadership Teams
Final Thoughts
Click to Buy Non-Profit KPI Scorecard In Google Sheets
The Non-Profit KPI Scorecard in Google Sheets transforms scattered data into a clear, visual, and actionable performance system. It helps non-profits focus on what truly matters—impact, accountability, and continuous improvement—while keeping reporting simple and transparent.
Visit our YouTube channel to learn step-by-step video tutorials
Youtube.com/@NeotechNavigators
Watch the step-by-step video tutorial: