Managing business travel expenses becomes challenging as organizations grow. Multiple departments, frequent trips, varied expense types, and approval delays often lead to budget overruns and poor visibility. Therefore, companies increasingly rely on structured dashboards to track, control, and analyze travel spending.Business Travel Expense Control Dashboard in Google Sheets
That is exactly where a Business Travel Expense Control Dashboard in Google Sheets delivers real value.
In this article, we explain how this dashboard works, what insights it provides, each analysis page, key metrics, advantages, best practices, and frequently asked questions. By the end, you will clearly understand how this dashboard helps finance teams, HR, and management control travel costs effectively.Business Travel Expense Control Dashboard in Google Sheets
What Is a Business Travel Expense Control Dashboard in Google Sheets?
A Business Travel Expense Control Dashboard in Google Sheets is a ready-to-use analytics and reporting solution designed to monitor employee travel expenses in a structured and visual way.Business Travel Expense Control Dashboard in Google Sheets
Instead of reviewing long spreadsheets or manual reports, teams use this dashboard to:
- Track total trips and travel spend
- Monitor approval efficiency
- Analyze expenses by city, department, and expense type
- Identify high-cost travel patterns
- Improve cost control and compliance
Because Google Sheets supports slicers, charts, conditional formatting, and automation, the dashboard remains both powerful and easy to maintain.Business Travel Expense Control Dashboard in Google Sheets
Why Do Organizations Need a Travel Expense Control Dashboard?
Click to Buy Business Travel Expense Control Dashboard in Google Sheets
Business travel directly impacts operating costs. However, manual tracking often creates blind spots. Therefore, organizations need a centralized and dynamic reporting solution.
Key Reasons to Use This Dashboard
-
To gain visibility into travel expenses
-
To reduce approval delays
-
To identify high-cost cities and departments
-
To monitor policy compliance
-
To support finance and management reporting
As a result, organizations move from reactive expense reviews to proactive cost control.
How Does the Business Travel Expense Control Dashboard Work?
Click to Buy Business Travel Expense Control Dashboard in Google Sheets
The dashboard works through structured data input and interactive reporting pages.
Users enter travel and expense data once. Then, formulas and charts automatically calculate KPIs, trends, and comparisons. Moreover, slicers allow instant filtering by department, city, employee, expense type, and approval status.
Consequently, insights update in real time without manual recalculation.
What Key Metrics Does the Dashboard Show at a Glance?
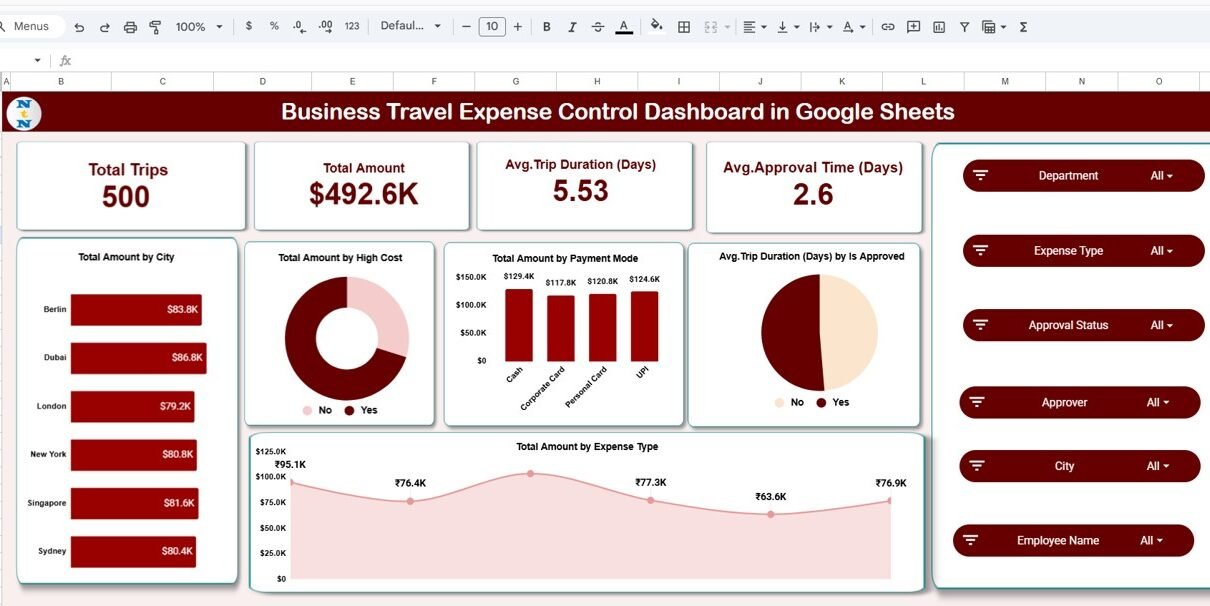
The main dashboard highlights four critical KPIs:
-
Total Trips – Total number of business trips
-
Total Amount – Overall travel expense value
-
Average Trip Duration (Days) – Average length of trips
-
Average Approval Time (Days) – Speed of expense approvals
Because these metrics appear at the top, decision-makers instantly understand overall travel efficiency and cost levels.
What Is Shown on the Main Dashboard Page?
Click to Buy Business Travel Expense Control Dashboard in Google Sheets
The Main Dashboard Page provides a consolidated expense overview.
Key Visuals on the Dashboard
- Total Amount by City
- Total Amount by High-Cost Flag
- Total Amount by Payment Mode
- Average Trip Duration by Approval Status
- Total Amount by Expense Type
The dashboard also includes interactive slicers for:
- Department
- Expense Type
- Approval Status
- Approver
- City
- Employee Name
Therefore, users can drill down into specific expense scenarios instantly.

Click to Buy Business Travel Expense Control Dashboard in Google Sheets
How Does the City Analysis Page Help Control Travel Costs?
The City Analysis Page focuses on location-based insights.
Insights Available on City Analysis
-
Total Trips by City
-
Average Trip Duration by City
-
Average Approval Time by City
Because travel costs vary by location, this page helps identify cities with:
-
High travel frequency
-
Longer trip durations
-
Slower approval cycles
As a result, organizations optimize travel planning and approval workflows.

Click to Buy Business Travel Expense Control Dashboard in Google Sheets
What Insights Does the Department Summary Page Provide?
The Department Summary Page highlights department-wise travel behavior.
Key Metrics on Department Summary
-
Total Trips by Department
-
Average Trip Duration by Department
-
Average Approval Time by Department
This analysis helps management identify:
-
Departments with excessive travel
-
Departments with approval delays
-
Opportunities for cost optimization

Click to Buy Business Travel Expense Control Dashboard in Google Sheets
How Does the Expense Type Analysis Improve Cost Visibility?
The Expense Type Analysis Page breaks down spending by category.
Expense Categories Covered
-
Flight
-
Hotel
-
Internet
-
Meals
-
Miscellaneous
-
Taxi
Key Insights from This Page
-
Total Trips by Expense Type
-
Average Trip Duration by Expense Type
-
Average Approval Time by Expense Type
Therefore, finance teams quickly identify expense categories that need tighter controls.

Click to Buy Business Travel Expense Control Dashboard in Google Sheets
Why Is the Monthly Trends Page Important?
The Monthly Trends Page focuses on time-based performance.
Metrics Tracked Monthly
-
Total Trips by Month
-
Average Trip Duration by Month
-
Average Approval Time by Month
This page helps organizations:
-
Detect seasonal travel trends
-
Monitor improvements or delays over time
-
Align travel budgets with demand

Click to Buy Business Travel Expense Control Dashboard in Google Sheets
What Is the Search and Detailed Records Page?
The Search by Keyword and Field Page provides granular control.
Features of This Page
-
Search by keyword (e.g., Taxi, City, Employee)
-
Select column for filtering
-
View detailed trip-level records
-
Track approval status and durations
Because of this page, auditors and finance teams can validate individual transactions quickly.

Click to Buy Business Travel Expense Control Dashboard in Google Sheets
How Is Data Structured in the Dashboard?
The dashboard uses a structured dataset that typically includes:
- Trip ID
- Employee Name
- Department
- Travel and Return Dates
- City
- Expense Type
- Amount
- Approval Status
- Approver
- Submitted and Approved Dates
- Trip Duration
- High-Cost Indicator
Since data remains centralized, reporting stays consistent and reliable.
Advantages of Business Travel Expense Control Dashboard in Google Sheets
Click to Buy Business Travel Expense Control Dashboard in Google Sheets
1. Improves Expense Visibility
All travel expenses appear in one centralized dashboard.
2. Reduces Cost Overruns
High-cost cities and expense types become visible instantly.
3. Improves Approval Efficiency
Average approval time highlights process bottlenecks.
4. Supports Policy Compliance
Expense patterns reveal deviations from policy.
5. Enables Faster Decision-Making
Interactive slicers provide instant insights.
6. Encourages Collaboration
Google Sheets allows real-time collaboration across teams.
7. Offers a Cost-Effective Solution
No expensive BI tools required.
How Does This Dashboard Help Finance and HR Teams?
Finance teams gain cost transparency, while HR teams monitor travel behavior and compliance. As a result, both teams align policies, approvals, and budgets effectively.
Best Practices for Using a Business Travel Expense Control Dashboard
Click to Buy Business Travel Expense Control Dashboard in Google Sheets
1. Maintain Clean Data
Ensure consistent entry of dates, cities, and expense types.
2. Update Data Regularly
Refresh data weekly or monthly for accurate insights.
3. Review Approval Time Trends
Focus on reducing approval delays.
4. Monitor High-Cost Indicators
Flag and investigate unusually expensive trips.
5. Use Filters During Reviews
Leverage slicers for department-specific reviews.
6. Protect Sensitive Data
Restrict editing access for data integrity.
Who Should Use This Dashboard?
Click to Buy Business Travel Expense Control Dashboard in Google Sheets
This dashboard benefits:
- Finance Teams
- HR and Administration
- Travel and Procurement Teams
- Department Heads
- Senior Management
Because Google Sheets remains familiar, adoption stays smooth across teams.
Conclusion
A Business Travel Expense Control Dashboard in Google Sheets transforms raw travel data into meaningful insights. It improves cost visibility, speeds up approvals, and strengthens financial control.
With detailed analysis by city, department, expense type, and month, this dashboard helps organizations move toward smarter, data-driven travel expense management.
Frequently Asked Questions (FAQs)
Click to Buy Business Travel Expense Control Dashboard in Google Sheets
What is a Business Travel Expense Control Dashboard?
It is a Google Sheets-based dashboard that tracks and analyzes corporate travel expenses.
Can I customize this dashboard?
Yes, you can add KPIs, charts, or filters easily.
Does this dashboard support monthly analysis?
Yes, it provides detailed monthly trends and comparisons.
Is Google Sheets suitable for expense dashboards?
Yes, it supports automation, collaboration, and advanced visuals.
Who should maintain this dashboard?
Finance or operations teams should update and review it regularly.
Visit our YouTube channel to learn step-by-step video tutorials
Youtube.com/@NeotechNavigators
Watch the step-by-step video tutorial:
Click to Buy Business Travel Expense Control Dashboard in Google Sheets