The media and entertainment industry moves fast. Content launches every week. Platforms compete daily. Audience preferences change quickly. Meanwhile, production and marketing costs keep rising.Media and Entertainment Dashboard in Google Sheets
So, how can studios, OTT platforms, content creators, and media companies track revenue, profit, views, ratings, and regional performance in one structured system?
Media and Entertainment Dashboard in Google Sheets
You need a Media and Entertainment Dashboard in Google Sheets.
This ready-to-use dashboard helps you monitor financial, operational, and audience performance metrics in real time. Moreover, it updates instantly when you select filters like Year, Month, Content Type, Genre, Platform, Region, and Language.
In this complete guide, we will explain:
-
What the Media and Entertainment Dashboard in Google Sheets is
-
Key metrics included in the dashboard
-
Detailed explanation of all pages
-
How the slicers and filters work
-
Advantages of using this dashboard
-
Best practices for implementation
-
Frequently Asked Questions
Let us explore everything step by step.
What Is a Media and Entertainment Dashboard in Google Sheets?
Click to Buy Media and Entertainment Dashboard in Google Sheets
A Media and Entertainment Dashboard in Google Sheets is an interactive reporting system designed to track performance across content types, platforms, regions, and time periods.
Instead of managing multiple spreadsheets, you can:
- Monitor Revenue
- Track Production & Marketing Cost
- Measure Profit
- Analyze Viewer Ratings
- Evaluate Total Views
- Compare Genre performance
- Review Regional contribution
- Analyze Platform profitability
Because Google Sheets runs in the cloud, teams can collaborate easily. Therefore, executives and managers access insights anytime.
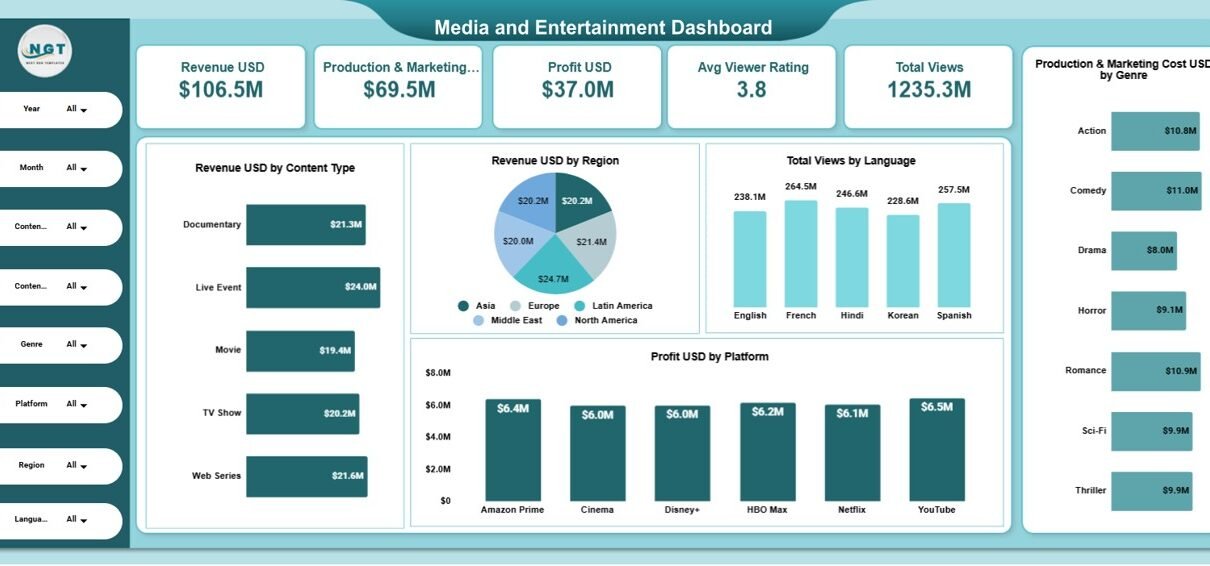
How Does the Main Media and Entertainment Dashboard Work?
The main dashboard provides a complete performance snapshot.
At the top, you see key summary cards:
- Revenue USD: $106.5M
- Production & Marketing Cost: $69.5M
- Profit USD: $37.0M
- Average Viewer Rating: 3.8
- Total Views: 1235.3M
Because of these KPI cards, executives instantly understand overall performance.
How Do the Filters Improve Analysis?
On the left side, you can filter data by:
- Year
- Month
- Content Type
- Genre
- Platform
- Region
- Language
When you apply a filter, the entire dashboard updates automatically. Therefore, you can analyze performance for a specific genre, region, or platform in seconds.
- Revenue Analysis by Content Type
- Revenue by Region
- Total Views by Language
- Profit by Platform

Click to Buy Media and Entertainment Dashboard in Google Sheets
Content Type Analysis Page
This page focuses on detailed content performance.
It shows:
- Average Viewer Rating by Content Type
- Profit by Content Type
- Production & Marketing Cost by Content Type
- Total Views by Content Type
For example:
- Live Event generates $8.1M profit
- Documentary rating: 3.9
- Web Series views: 243.2M
Because of this view, studios balance cost vs profitability effectively.

Click to Buy Media and Entertainment Dashboard in Google Sheets
Platform Analysis Page
This page analyzes platform-specific metrics.
It includes:
- Avg Viewer Rating by Platform
- Profit by Platform
- Production & Marketing Cost by Platform
- Total Views by Platform
For instance:
-
Netflix views: 226.9M
-
Amazon Prime cost: $11.7M
Therefore, content distributors evaluate ROI clearly.

Click to Buy Media and Entertainment Dashboard in Google Sheets
Region Analysis Page
This section highlights regional performance.
It includes:
- Avg Viewer Rating by Region
- Profit by Region
- Production & Marketing Cost by Region
- Total Views by Region
For example:
-
Latin America profit: $8.6M
-
Europe views: 248.2M
Thus, management allocates marketing budgets strategically.

Click to Buy Media and Entertainment Dashboard in Google Sheets
Monthly Trends Page
The Monthly Trends page provides time-based insights.
It shows:
- Avg Viewer Rating by Month
- Profit by Month
- Production & Marketing Cost by Month
- Total Views by Month
Because of trend tracking, teams detect seasonal patterns quickly.
For example:
-
May views: 162.8M
-
June profit: $4.6M

Click to Buy Media and Entertainment Dashboard in Google Sheets
Advantages of Media and Entertainment Dashboard in Google Sheets
Real-Time Data Monitoring
You track revenue and views instantly.
Centralized Reporting
You manage all KPIs in one place.
Interactive Filtering
You analyze performance by platform, region, or genre.
Clear Profitability Insights
You compare cost vs revenue easily.
Cloud Accessibility
You access data from anywhere.
Better Investment Decisions
You allocate budget based on performance data.
Cost-Effective Analytics
Google Sheets eliminates expensive BI tools.
Best Practices for the Media and Entertainment Dashboard
Click to Buy Media and Entertainment Dashboard in Google Sheets
To maximize results, follow these best practices:
Update Data Regularly
Maintain monthly updates.
Validate Revenue and Cost Entries
Ensure financial accuracy.
Align KPIs with Business Goals
Focus on ROI-driven metrics.
Use Filters Strategically
Analyze high-performing segments.
Monitor Trends Monthly
Identify seasonal spikes and dips.
Optimize Underperforming Content
Adjust marketing strategy based on insights.
How Does This Dashboard Help Media Executives?
Click to Buy Media and Entertainment Dashboard in Google Sheets
This dashboard helps executives:
-
Evaluate content profitability
-
Compare regional growth
-
Identify top-performing platforms
-
Monitor cost control
-
Improve audience engagement
Therefore, decision-making becomes data-driven and faster.
Conclusion
The media and entertainment industry demands quick and smart decisions. However, scattered reports slow down performance tracking.
The Media and Entertainment Dashboard in Google Sheets provides structured analytics, real-time filtering, financial tracking, and audience insights in one ready-to-use solution.
Because it combines revenue, cost, profit, ratings, and views in one system, it gives complete visibility.
If you want better control over content performance and profitability, this dashboard offers a powerful yet simple solution.
Frequently Asked Questions (FAQs)
Click to Buy Media and Entertainment Dashboard in Google Sheets
What is a Media and Entertainment Dashboard in Google Sheets?
It is a ready-to-use dashboard that tracks revenue, cost, profit, ratings, and views across platforms and regions.
Can I customize KPIs?
Yes. You can modify metrics based on your media business model.
Does it support monthly and yearly analysis?
Yes. It includes monthly trends and year-based filters.
Do I need advanced skills?
No. Basic Google Sheets knowledge is enough.
Can OTT platforms use this dashboard?
Yes. OTT platforms, studios, broadcasters, and digital publishers can use it.
Visit our YouTube channel to learn step-by-step video tutorials
Youtube.com/@NeotechNavigators
Watch the step-by-step video tutorial:
Click to Buy Media and Entertainment Dashboard in Google Sheets