Construction Dashboard in HTML is a professionally designed, interactive analytics template that empowers construction project managers, contractors, engineers, and safety officers to monitor project performance, budgets, progress, and safety metrics in one centralized browser-based dashboard. If you are managing construction projects and need a clean, visual, and data-driven reporting system, this HTML dashboard template is exactly what you need.
Click here to Purchase Construction Dashboard in HTML
In today’s fast-paced construction industry, teams deal with massive amounts of project data spanning budgets, timelines, safety records, and resource allocation. However, scattered spreadsheets and disconnected reports make it difficult to get a clear picture of project health. This is where the Construction Dashboard in HTML becomes a game-changer — transforming raw construction data into powerful visual insights that drive better decisions.
Key Features of Construction Dashboard in HTML
This interactive HTML dashboard comes loaded with features designed specifically for construction project monitoring and analysis. The template includes 5 fully interactive dashboard pages, each focused on a different aspect of construction performance. Dynamic KPI cards on the overview page provide instant visibility into Total Projects, Total Budget, Total Cost, Average Progress, Safety Incidents, and Over Budget indicators. Advanced slicers and filters allow users to instantly narrow down data by Region, Project Type, Department, Status, and Phase. The budget analysis page enables teams to compare planned budgets against actual costs to detect overruns early. A dedicated progress monitoring section tracks project completion rates across multiple dimensions. The safety and risk page monitors incidents and helps identify high-risk patterns. Finally, a detailed data view table with search, sort, pagination, and CSV export makes granular data exploration effortless.
Dashboard Pages Explanation
1. Overview Page
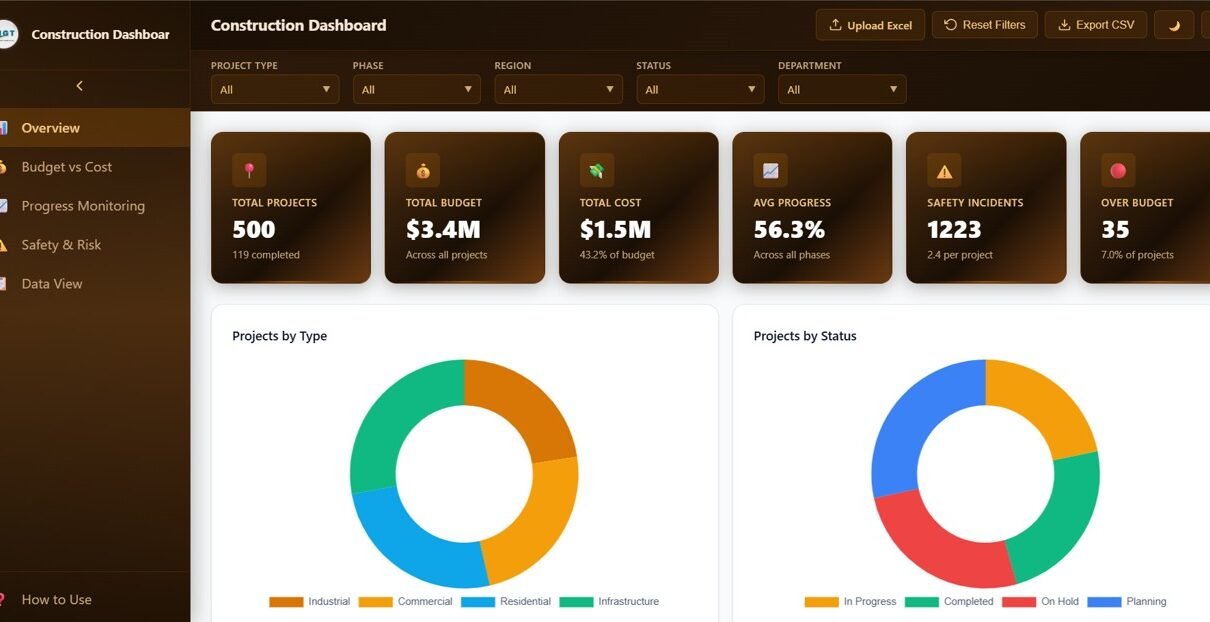
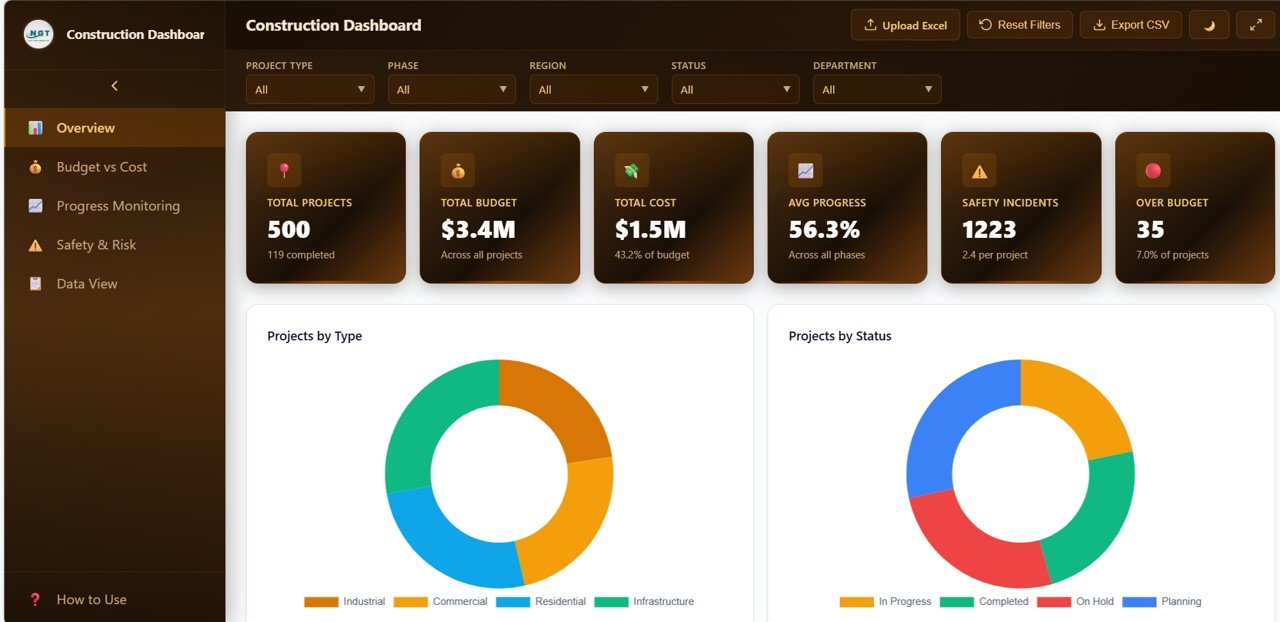
The Overview Page serves as the command center for construction monitoring. At the top, dynamic KPI cards display essential high-level metrics: Total Projects gives you an instant count of all projects in the system, Total Budget shows the cumulative planned investment, Total Cost reveals the actual spending to date, Average Progress indicates overall completion percentage, Safety Incidents highlights workplace safety events, and Over Budget flags projects exceeding their allocated budgets.
Below the KPI cards, several interactive charts provide deeper analytical insights. Projects by Type distributes construction projects across residential, commercial, industrial, and infrastructure categories. Projects by Status shows the breakdown of active, completed, delayed, and on-hold projects. Budget vs Cost by Region highlights regional spending efficiency. Projects by Region compares project volumes across geographical areas. Monthly Project Count tracks how many new projects were launched each month, helping identify seasonal patterns.
Construction Dashboard Overview
2. Budget vs Cost
The Budget vs Cost page provides a deep financial analysis of your construction portfolio. Budget vs Cost by Project Type compares planned spending against actual costs for each project category, making it easy to spot which types consistently overrun budgets. Budget Status Distribution shows the proportion of projects that are under budget, on budget, or over budget. Budget vs Cost by Department reveals which departments manage spending efficiently and which need attention. Cost Incurred by Phase tracks how expenses accumulate across planning, foundation, structure, finishing, and handover stages. Monthly Budget vs Cost Trend monitors financial performance evolution over time, helping forecast future spending patterns. For more infrastructure-focused financial dashboards, check out our Bridge Maintenance Dashboard in Excel.
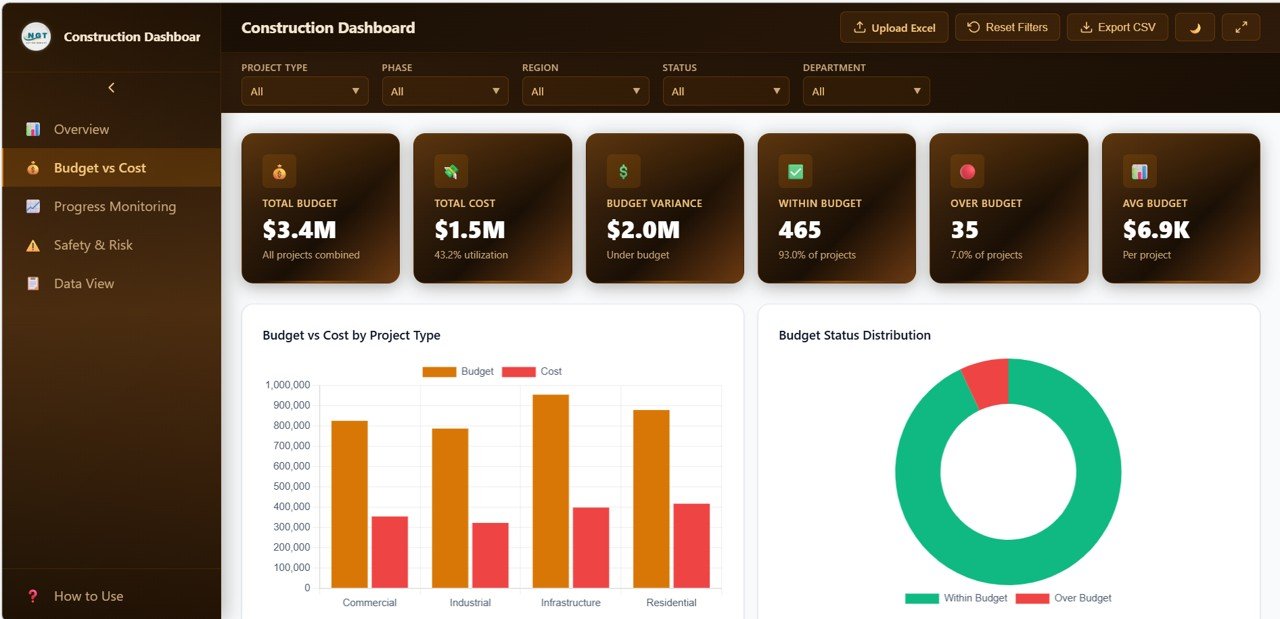
Budget vs Cost Analysis
3. Progress Monitoring
The Progress Monitoring page offers comprehensive project completion analytics. Progress by Project Type analyzes completion percentages across different construction categories. Projects by Phase visualizes the distribution of projects across planning, execution, and completion stages. Average Progress by Region compares how quickly projects are advancing in different geographical locations. Status Distribution by Department shows department-level project health and bottlenecks. Monthly Average Progress Trend tracks overall project momentum month by month, enabling early detection of slowdowns. Organizations tracking infrastructure KPIs can also explore our Infrastructure KPI Scorecard in Google Sheets.
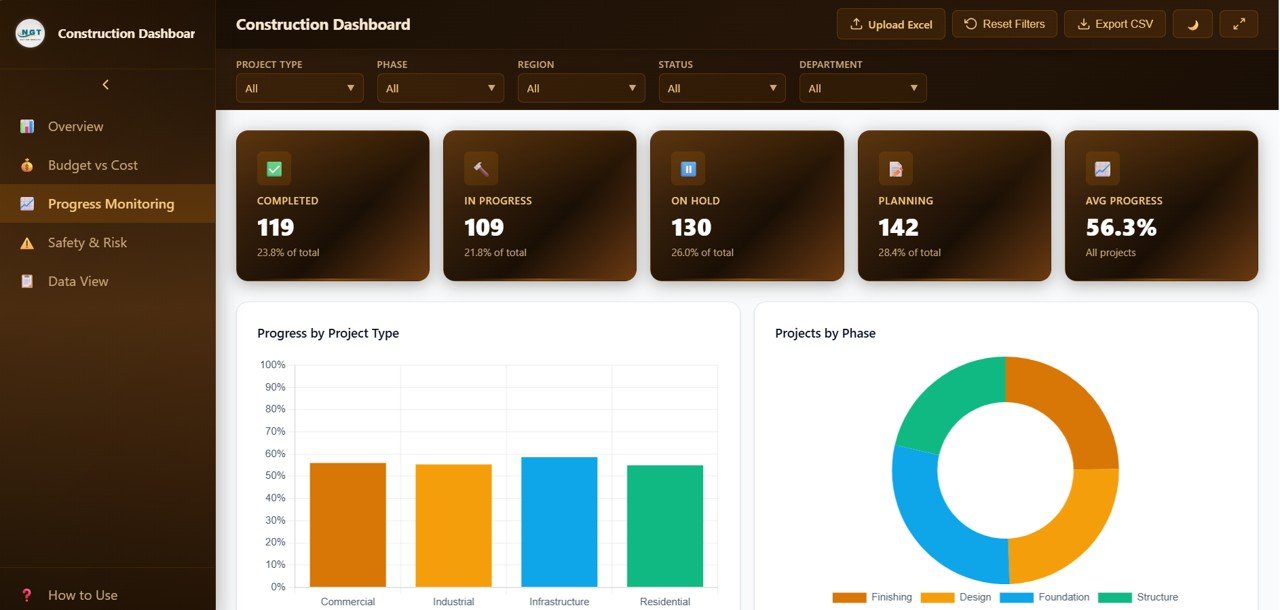
Progress Monitoring
4. Safety and Risk
The Safety and Risk page is dedicated to workplace safety monitoring across all construction projects. Safety Incidents by Project Type identifies which project categories carry the highest safety risk. Safety Incidents by Region highlights geographical hotspots where incidents are more frequent. Incident Distribution breaks down the types of safety events occurring across the portfolio. Safety Incidents by Department reveals which departments need improved safety protocols. Monthly Safety Incidents Trend tracks how safety performance evolves over time, helping measure the effectiveness of safety improvement initiatives. For more metro and urban infrastructure dashboards, explore our Urban Metro Development KPI Dashboard in Power BI.
Click here to Purchase Construction Dashboard in HTML
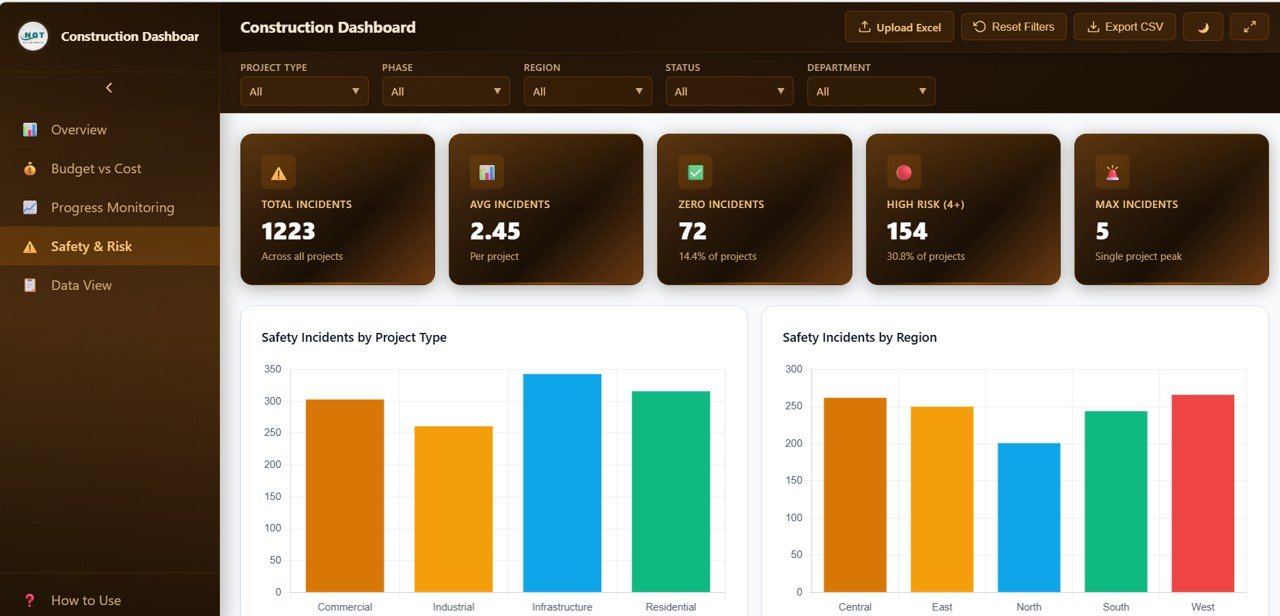
Safety and Risk Analysis
5. Data View
The Data View page is a detailed data table that displays all construction project records in a structured tabular format. Users can search for specific records using keywords, sort columns in ascending or descending order, and navigate through records using pagination controls. The page also provides a CSV export option that allows users to download filtered data for offline analysis, reporting, and sharing with stakeholders.
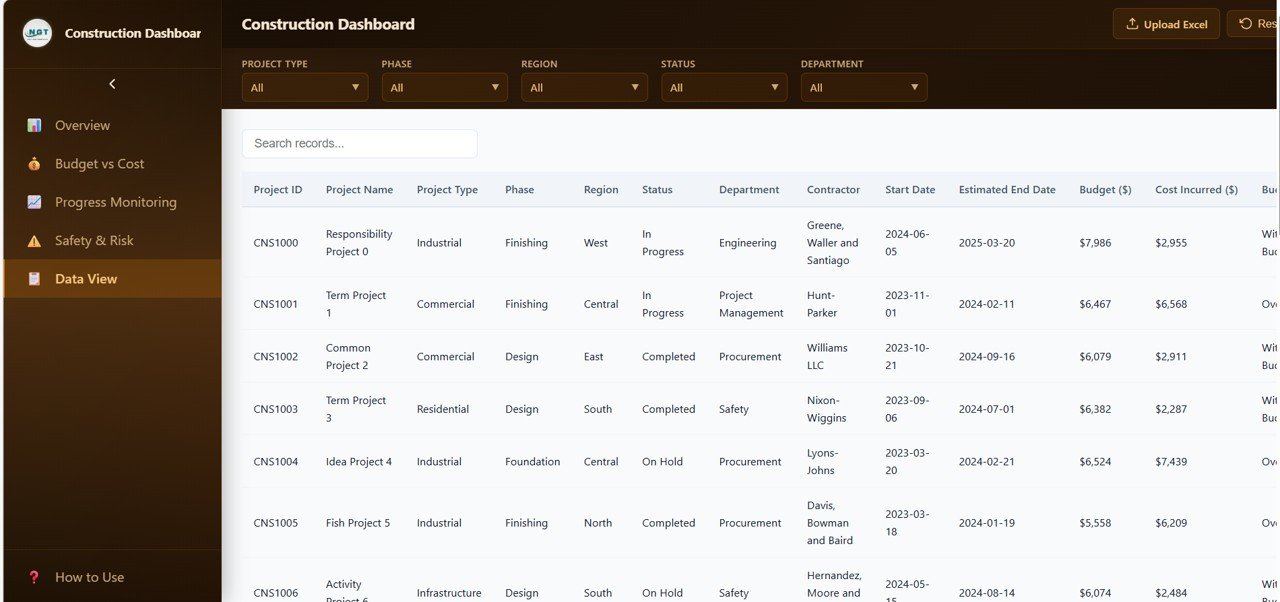
Data View Tab
Advantages of Construction Dashboard in HTML
This dashboard offers several distinct advantages for construction teams. First, because it runs entirely in a web browser, there is no need to install any software — simply open the HTML file and start analyzing. Second, the interactive slicers and filters allow users to customize their view instantly, making it easy to focus on specific regions, departments, or project types. Third, the comprehensive 5-page structure ensures that every aspect of construction performance is covered, from high-level overviews to granular data exploration. Fourth, the professional visual design makes it easy to present findings to executives and stakeholders. Fifth, the CSV export functionality enables seamless integration with other tools and reporting workflows. Finally, the template can be easily hosted on internal company servers for team-wide access.
Click here to Purchase Construction Dashboard in HTML
Opportunities for Improvement
While the dashboard provides excellent analytics capabilities, there are areas where it could be enhanced further. Adding real-time data integration through API connections would eliminate the need for manual data updates. Implementing user-level access controls would allow organizations to restrict dashboard access based on roles. Adding automated email alert functionality for budget overruns or safety threshold breaches would improve proactive management. Including a comparison view to benchmark current project performance against historical averages would add strategic value. Adding dark mode support and print-optimized layouts would improve usability across different scenarios.
Best Practices
To get the most out of this Construction Dashboard in HTML, follow these best practices. Update your construction data regularly to ensure the dashboard reflects current project status. Use the filters and slicers actively to drill down into specific areas rather than relying solely on the overview page. Review the Budget vs Cost page weekly to catch potential overruns before they escalate. Monitor the Safety and Risk page consistently and take immediate action when incident trends increase. Share the dashboard with project stakeholders to improve transparency and alignment. Use the Data View export feature to create backup records and generate custom reports for management meetings.
Click here to Purchase Construction Dashboard in HTML
Explore Relevant Templates
If you found this Construction Dashboard in HTML valuable, explore these related templates on NextGenTemplates:
- Bridge Maintenance Dashboard in Excel – Track bridge inspections and structural conditions
- Infrastructure KPI Scorecard in Google Sheets – Monitor infrastructure performance metrics with automated KPI calculations
- Urban Metro Development KPI Dashboard in Power BI – Analyze metro infrastructure development performance
- Fleet Management Dashboard in Google Sheets – Monitor vehicle fleet operations and maintenance costs
Frequently Asked Questions
What is the Construction Dashboard in HTML?
The Construction Dashboard in HTML is a ready-to-use interactive analytics template that lets you monitor construction project performance, budgets, progress, and safety metrics directly in your web browser without any software installation.
Do I need any special software to use this dashboard?
No special software is needed. The dashboard runs in any modern web browser such as Google Chrome, Microsoft Edge, or Mozilla Firefox. Simply download and open the HTML file.
Can I replace the sample data with my own project data?
Yes, the template is designed to work with your own construction data. You can replace the sample records with your actual project information and the dashboard will update all charts and KPIs accordingly.
How many pages does this dashboard include?
The dashboard includes 5 interactive pages: Overview, Budget vs Cost, Progress Monitoring, Safety and Risk, and Data View. Each page is designed to analyze a specific aspect of construction project performance.
Can I export data from this dashboard?
Yes, the Data View page includes a CSV export feature that allows you to download filtered data for offline analysis, reporting, and sharing with stakeholders.
Is this dashboard suitable for large construction companies?
Yes, the dashboard is designed to handle multiple construction projects across different regions, departments, and project types. It is suitable for both small contractors and large construction organizations managing complex project portfolios.
Click here to Purchase Construction Dashboard in HTML
Conclusion
The Construction Dashboard in HTML is a must-have analytics tool for any construction professional who wants to monitor projects efficiently, control budgets effectively, track progress consistently, and manage safety proactively. With its 5 interactive pages, dynamic KPI cards, advanced filtering system, and professional design, this dashboard transforms raw construction data into actionable insights that drive better project outcomes.
👉 Click here to Purchase Construction Dashboard in HTML
Visit our YouTube channel for step-by-step tutorials and dashboard walkthroughs:
👉 Youtube.com/@NeoTechNavigators