IT Support Ticket Dashboard in HTML is a professionally designed, interactive, and browser-based analytics template that empowers IT managers, help desk supervisors, service desk analysts, and technology leaders to monitor support ticket volume, resolution times, technician performance, and customer satisfaction from one centralized interface. Managing IT support operations effectively requires clear visibility into ticket patterns, team productivity, and service quality trends. This IT Support Ticket Dashboard in HTML consolidates all your critical IT help desk data into a single dynamic reporting platform that works instantly in any modern web browser without installing additional software.
Click here to Purchase IT Support Ticket Dashboard in HTML
Whether you are overseeing an IT team of five or fifty, tracking support ticket performance is essential for identifying recurring issues, spotting resolution bottlenecks, and ensuring high customer satisfaction. Instead of juggling disconnected spreadsheets and static reports, this dashboard brings everything together with interactive charts, smart filters, and KPI cards that update dynamically as you explore your data.
Key Features of IT Support Ticket Dashboard in HTML
The IT Support Ticket Dashboard in HTML includes 5 interactive dashboard pages designed to give IT teams and help desk professionals complete visibility into ticket performance, team productivity, issue patterns, location-based metrics, and raw data exploration. This template tracks 6 key performance indicators: Total Tickets, Open / In Progress, Average Resolution Time, Average Satisfaction Score, Resolution Rate, and Escalated tickets.
The dashboard features interactive charts and visualizations that allow users to analyze ticket data by issue type, priority level, status, department, technician, location, and monthly trends. Smart slicers let you instantly filter data across all pages for targeted analysis. The entire dashboard runs in a web browser with a professional SaaS-style design, multi-tab navigation, responsive layout, and CSV data export functionality.
Dashboard Pages Explanation
1. Overview Page
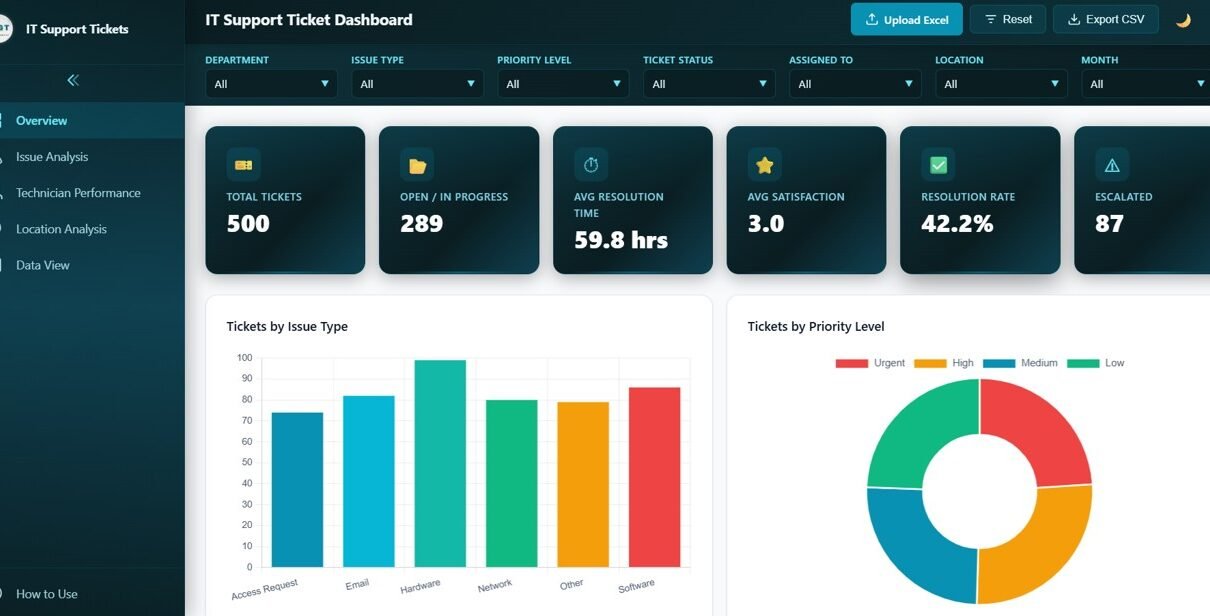
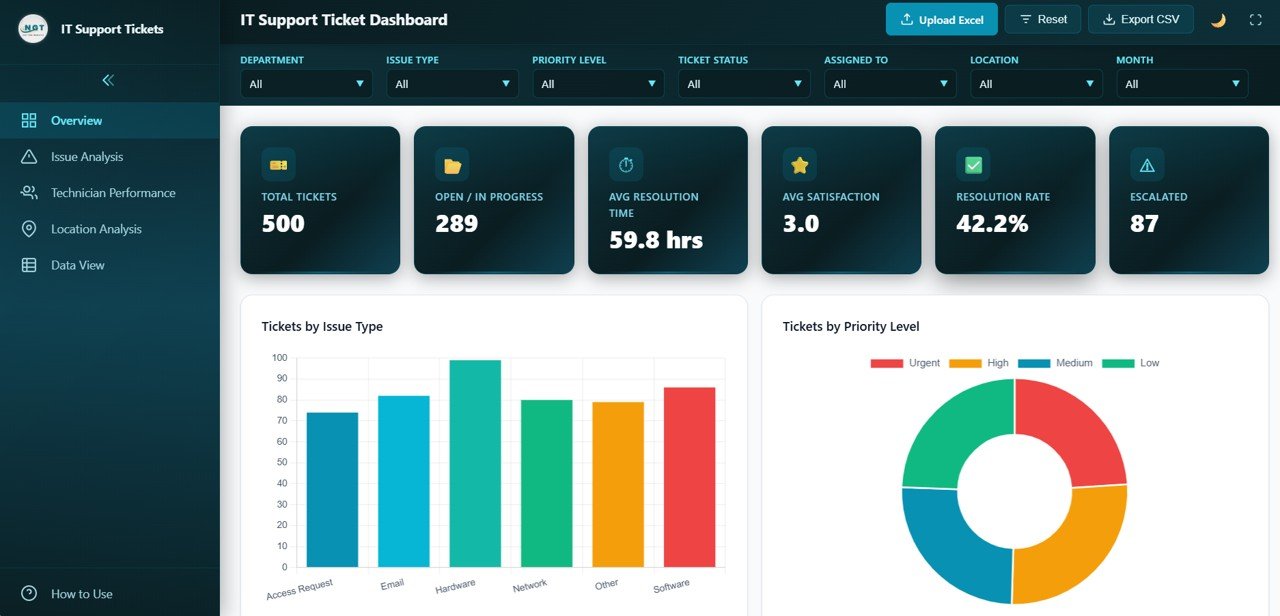
The Overview Page serves as the central command center for IT support performance monitoring. At the top, six KPI cards display the most important metrics at a glance: Total Tickets showing the complete count of support requests in the system, Open / In Progress tracking active tickets still being worked on, Average Resolution Time measuring how quickly tickets are resolved, Average Satisfaction tracking customer happiness scores, Resolution Rate showing the percentage of tickets successfully closed, and Escalated counting tickets that required higher-level intervention.
Below the KPI cards, multiple interactive charts provide deeper analytical insights. Tickets by Issue Type displays how support requests are distributed across different problem categories like hardware failures, software bugs, and network issues. Tickets by Priority Level breaks down ticket urgency showing how many are critical, high, medium, or low priority. Tickets by Status reveals the pipeline health showing open, in progress, resolved, and closed tickets. Tickets by Department identifies which organizational departments generate the most IT support requests. Monthly Ticket Trend tracks volume changes over time revealing seasonal patterns and workload trends. Multiple slicers allow instant filtering for targeted analysis.
IT Support Ticket Dashboard Overview2. Issue Analysis
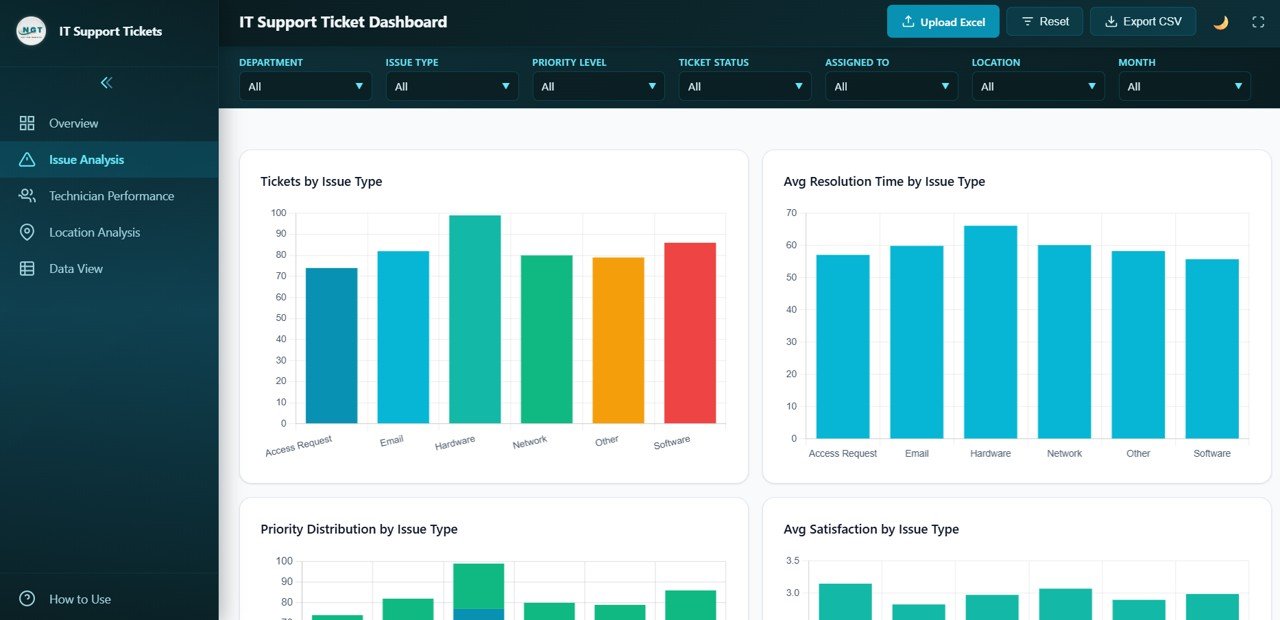
The Issue Analysis page provides detailed breakdowns of IT support tickets categorized by problem type. Tickets by Issue Type reveals which categories generate the most support volume helping IT managers prioritize resources and preventive measures. Avg Resolution Time by Issue Type identifies which problem categories take the longest to resolve, highlighting areas where additional training or tooling may be needed. Priority Distribution by Issue Type shows the urgency composition within each category revealing whether hardware issues tend to be more critical than software bugs. Avg Satisfaction by Issue Type measures customer happiness across different problem categories helping identify where the support experience needs improvement.
 Issue Analysis
Click here to Purchase IT Support Ticket Dashboard in HTML
3. Technician Performance
The Technician Performance page provides detailed performance analytics for each member of the IT support team. Tickets Resolved by Technician reveals which team members handle the most tickets enabling managers to recognize top performers and allocate workload effectively. Avg Resolution Time by Technician compares speed and efficiency across the support team highlighting who resolves issues fastest. Satisfaction Score by Technician measures customer feedback quality per technician revealing who delivers the best support experience. Workload Distribution shows ticket allocation across technicians helping managers balance assignments and prevent burnout.
 Technician Performance
4. Location Analysis
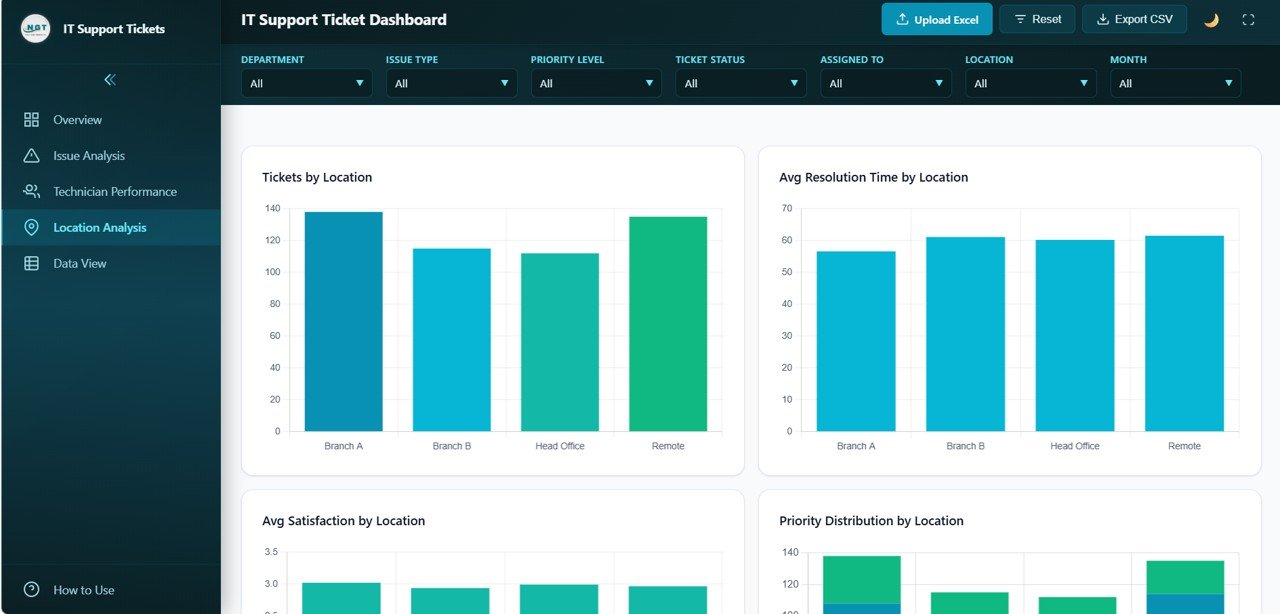
The Location Analysis page offers site-level analytics for multi-location IT support management. Tickets by Location reveals which office locations or sites generate the most support requests helping identify infrastructure or staffing gaps. Avg Resolution Time by Location tracks service speed across different sites revealing potential resource allocation issues. Avg Satisfaction by Location measures customer happiness per location highlighting where the support experience varies. Priority Distribution by Location shows the urgency composition at each site helping prioritize infrastructure investments and staffing decisions.
 Location Analysis
5. Data View
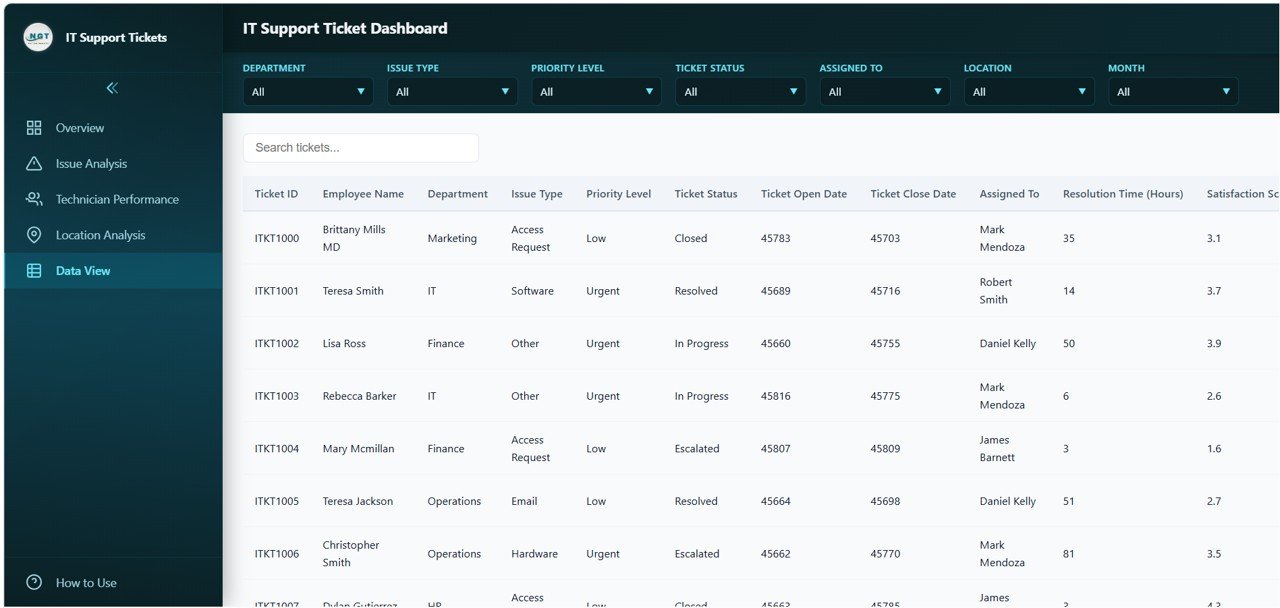
This is the detailed data table page where users can view all IT support ticket records with search, sort, and pagination features. You can also export the filtered data to CSV for further analysis, auditing, and executive reporting. This page supports deep-dive investigation by allowing users to search specific tickets, sort by any column, and navigate through pages of records.
 Data View
Advantages of IT Support Ticket Dashboard in HTML
The IT Support Ticket Dashboard in HTML offers several compelling advantages for IT teams and technology leaders. First, it provides centralized help desk analytics by consolidating ticket data, resolution metrics, and team performance into one unified interface. Second, the browser-based design means no software installation is required, making it accessible on any device with a web browser. Third, the interactive filters and slicers enable instant data exploration without complex query building. Fourth, the technician performance tracking enables data-driven performance reviews and resource allocation. Fifth, the location-based analysis helps multi-site organizations identify where IT infrastructure and staffing investments are needed most.
Opportunities for Improvement
While this dashboard already delivers powerful IT support analytics, organizations can extend its value by integrating it with live ticketing system APIs like ServiceNow, Zendesk, or Jira Service Management for real-time data synchronization. Adding SLA breach tracking and escalation path analysis would enhance compliance monitoring capabilities. Incorporating knowledge base article effectiveness metrics could help measure self-service impact on ticket volume. Custom alert thresholds for KPI deviations like resolution time spikes or satisfaction drops could enable proactive IT service management.
Best Practices
To maximize the value of this HTML Dashboard, organizations should update ticket data regularly to ensure accurate performance visibility. Focus on tracking the metrics that directly impact service quality such as resolution time, satisfaction scores, and escalation rates. Use the issue analysis page to identify recurring problem categories and invest in preventive solutions. Leverage the technician performance tracking for regular performance reviews and coaching conversations. Compare location-level metrics to standardize IT support quality across all sites. Export data regularly from the Data View page for historical trend analysis and executive reporting.
Explore Relevant Templates
Click here to Purchase IT Support Ticket Dashboard in HTML
If you are looking for more IT and service management analytics solutions, explore these related templates from NextGenTemplates:
- IT Services Dashboard in HTML — Track IT service delivery, SLA compliance, and operational metrics with interactive analytics.
- IT SLA Compliance and Ticket Monitoring Dashboard in Google Sheets — Monitor SLA performance, ticket volumes, and compliance rates.
- Customer Service Dashboard in HTML — Track customer service tickets, agent performance, and satisfaction scores.
- Customer Satisfaction Dashboard in HTML — Monitor CSAT scores, resolution time, SLA performance, and channel insights.
Frequently Asked Questions
What is the best IT support ticket dashboard template for tracking help desk performance?
The IT Support Ticket Dashboard in HTML is an excellent template for tracking help desk performance because it includes 5 interactive pages covering ticket overview, issue analysis, technician performance, location analysis, and a data view with 6 dynamic KPI cards and smart filtering capabilities.
How do I use the IT Support Ticket Dashboard in HTML?
Simply download the ZIP file, extract it, and open the HTML file in any modern browser like Chrome, Firefox, or Edge. Replace the sample data with your actual IT support ticket data and all charts and KPIs update automatically. No coding skills are required.
Can I track technician performance with this dashboard?
Yes. The dedicated Technician Performance page shows tickets resolved, average resolution time, satisfaction scores, and workload distribution for each IT technician, enabling comprehensive team performance analysis and resource planning.
What KPIs does this IT support dashboard track?
The dashboard tracks 6 key IT support metrics: Total Tickets, Open / In Progress, Average Resolution Time, Average Satisfaction, Resolution Rate, and Escalated tickets. These KPIs are displayed on dynamic cards with supporting visualizations across 5 interactive pages.
Can I analyze IT support tickets by location?
Yes. The Location Analysis page shows tickets by location, average resolution time by location, average satisfaction by location, and priority distribution by location, enabling multi-site IT support performance comparison.
Can I export data from this IT support dashboard?
Yes. The Data View page includes search, sort, pagination, and CSV export functionality, allowing you to extract filtered IT support ticket records for further analysis, reporting, and executive presentations.
Conclusion
The IT Support Ticket Dashboard in HTML is a powerful, ready-to-use analytics solution for IT teams and help desk professionals who need clear visibility into ticket performance, resolution efficiency, technician productivity, and customer satisfaction trends. With 5 interactive pages, 6 dynamic KPI cards, smart filters, and CSV export capabilities, this dashboard transforms raw IT support data into actionable insights that drive better service decisions and faster issue resolution. Purchase this template today and start making data-driven IT support decisions immediately.
🎥 Visit our YouTube channel to learn step-by-step video tutorials
👉 Youtube.com/@NeoTechNavigators