Energy Consumption Analysis Dashboard in HTML is a powerful, browser-based analytics tool designed for energy managers, facility operators, sustainability professionals, and operations teams who need comprehensive visibility into energy consumption patterns, costs, carbon emissions, and efficiency metrics. Built with modern web technologies, this interactive HTML dashboard delivers premium SaaS-like analytics right in your browser — no software installation required.Energy Consumption Analysis Dashboard in HTML.
Click to buy Energy Consumption Analysis Dashboard in HTML
Whether you manage a single building or oversee energy operations across multiple facilities and regions, this dashboard template provides 5 dedicated analysis pages that transform complex energy data into clear, actionable visual insights. From high-level KPI monitoring to granular time-based trend analysis and carbon emission tracking, this Energy Consumption Analysis Dashboard in HTML is your complete energy intelligence solution.Energy Consumption Analysis Dashboard in HTML
Key Features of Energy Consumption Analysis Dashboard in HTML
The Energy Consumption Analysis Dashboard in HTML includes 5 interactive dashboard pages with 6 dynamic KPI cards, advanced slicers and filters, and comprehensive chart visualizations. Here are the standout features that make this template an essential tool for energy monitoring and analysis:
- 5 Interactive Dashboard Pages – Navigate seamlessly between Overview, Energy Source Analysis, Facility and Department, Time Analysis, and Data View pages for multi-dimensional energy analytics.
- 6 Dynamic KPI Cards – Monitor Total Consumption, Total Cost, Carbon Emission, Avg Efficiency, Peak Demand, and Total Records at a glance from the overview page.Energy Consumption Analysis Dashboard in HTML
- Advanced Slicers and Filters – Apply multiple global filters to narrow down results by energy source, region, department, status, and other dimensions across all pages.
- Carbon Emission Tracking – Dedicated emission analysis by department, energy source, facility, and monthly trends for sustainability compliance and environmental reporting.
- Year-over-Year Comparison – Benchmark current energy consumption against historical data to identify improvements, anomalies, and seasonal patterns.
- CSV Export – Export filtered data from the Data View page for external reporting, compliance documentation, or integration with other analytics tools.
- Search, Sort, and Pagination – The Data View page includes powerful data management features to handle large energy datasets with ease.
- Zero Installation – Simply open the HTML file in any modern browser such as Chrome, Edge, or Firefox and start analyzing energy data immediately.Energy Consumption Analysis Dashboard in HTML
Dashboard Pages Explanation
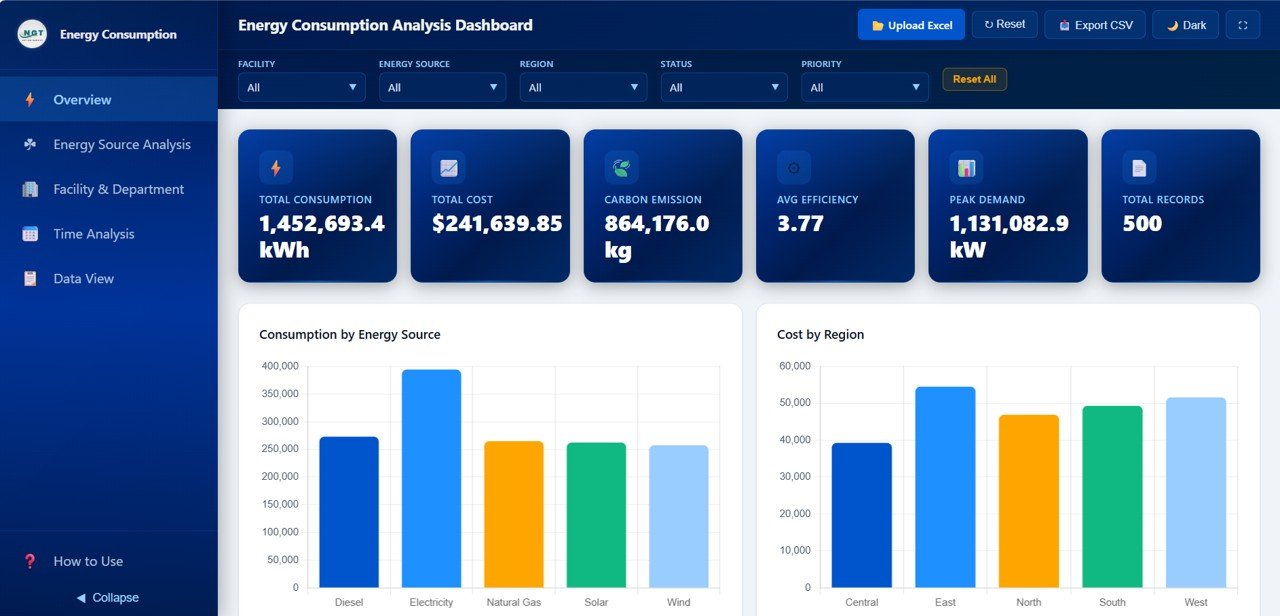
Page 1 – Overview
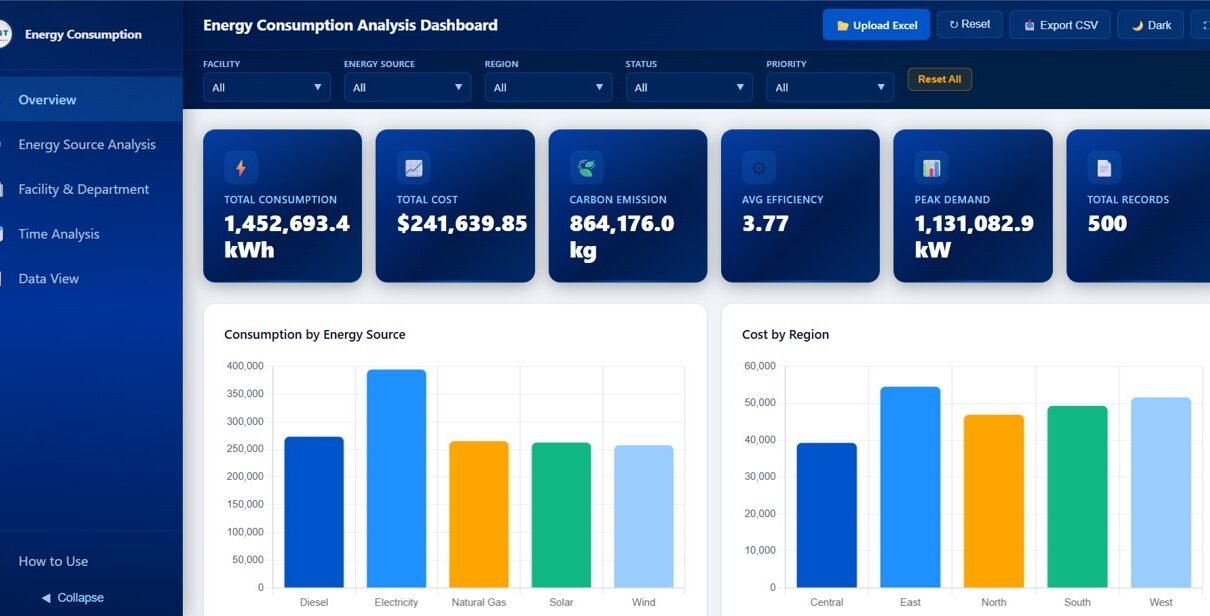
The Overview page serves as your command center for energy consumption monitoring. At the top of the page, 6 dynamic KPI cards display high-level metrics including Total Consumption, Total Cost, Carbon Emission, Avg Efficiency, Peak Demand, and Total Records — giving you an instant snapshot of your organization’s energy performance.
Below the KPI cards, interactive charts present Consumption by Energy Source showing the distribution of energy usage across different fuel types, Cost by Region highlighting how energy spending varies across geographical areas, Carbon Emission by Department revealing which departments contribute most to the organization’s carbon footprint, and Status Distribution breaking down operational status categories across energy records. Multiple slicers are available to filter and explore the dashboard quickly across all dimensions.
Energy Consumption Analysis Dashboard – Overview
Page 2 – Energy Source Analysis
The Energy Source Analysis page provides a deep dive into performance metrics segmented by energy source type. This page includes charts for Consumption by Energy Source comparing total usage across fuel categories, Cost by Energy Source revealing which energy sources carry the highest costs, Carbon Emission by Energy Source tracking the environmental impact of each fuel type, Efficiency Rating by Energy Source benchmarking operational efficiency across different sources, and Peak Demand by Energy Source and Region analyzing maximum demand patterns across both source types and geographical areas.
This page is particularly valuable for energy managers who need to evaluate the cost-effectiveness and environmental impact of different energy sources to make informed procurement and sustainability decisions. Looking for more industry-specific analytics? Check out the Construction Dashboard in HTML for infrastructure project tracking.
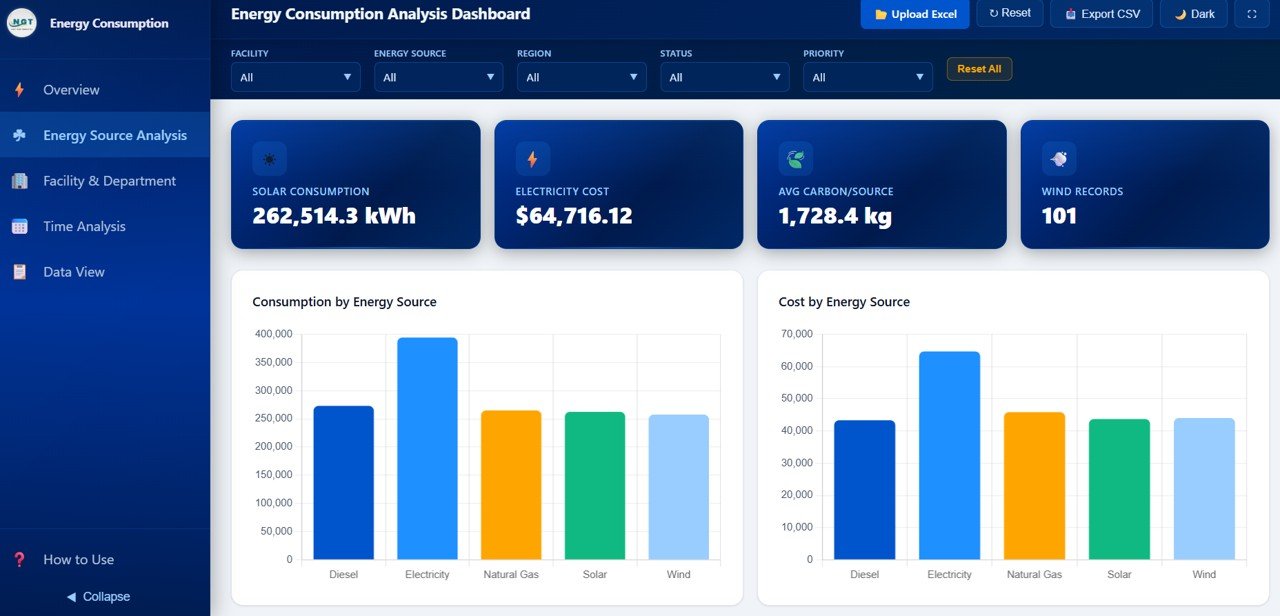
Energy Source Analysis
Page 3 – Facility and Department
The Facility and Department page breaks down energy performance at the operational level. Charts on this page include Consumption by Facility comparing energy usage across different physical locations, Cost by Department revealing which organizational departments incur the highest energy costs, Carbon Emission by Facility tracking the environmental footprint of each facility location, Equipment Type by Consumption identifying which categories of equipment consume the most energy, and Maintenance Status by Department monitoring the health and maintenance compliance of equipment across teams.
This granular breakdown helps facility managers and operations teams pinpoint inefficiencies, prioritize maintenance scheduling, and allocate energy budgets more effectively across departments and locations.
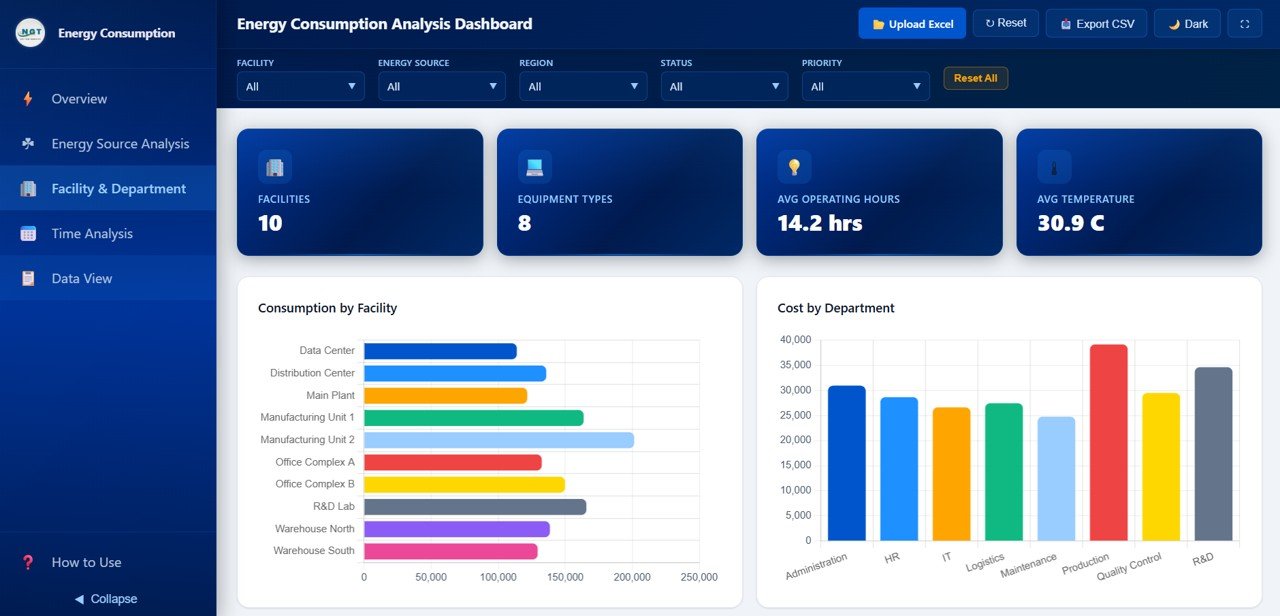
Facility and Department
Page 4 – Time Analysis
The Time Analysis page tracks energy performance across temporal dimensions to help identify trends, seasonal patterns, and anomalies. This page features charts for Monthly Consumption Trend monitoring how energy usage fluctuates month by month, Monthly Cost Trend tracking the evolution of energy spending over time, Monthly Carbon Emission analyzing how environmental impact changes throughout the year, and Year over Year Consumption Comparison benchmarking current performance against historical data to measure improvement or detect regression.
Time-based analysis is critical for strategic energy planning, budget forecasting, and identifying the impact of energy efficiency initiatives over time. Explore our full collection of HTML Dashboard Templates for more interactive analytics solutions.
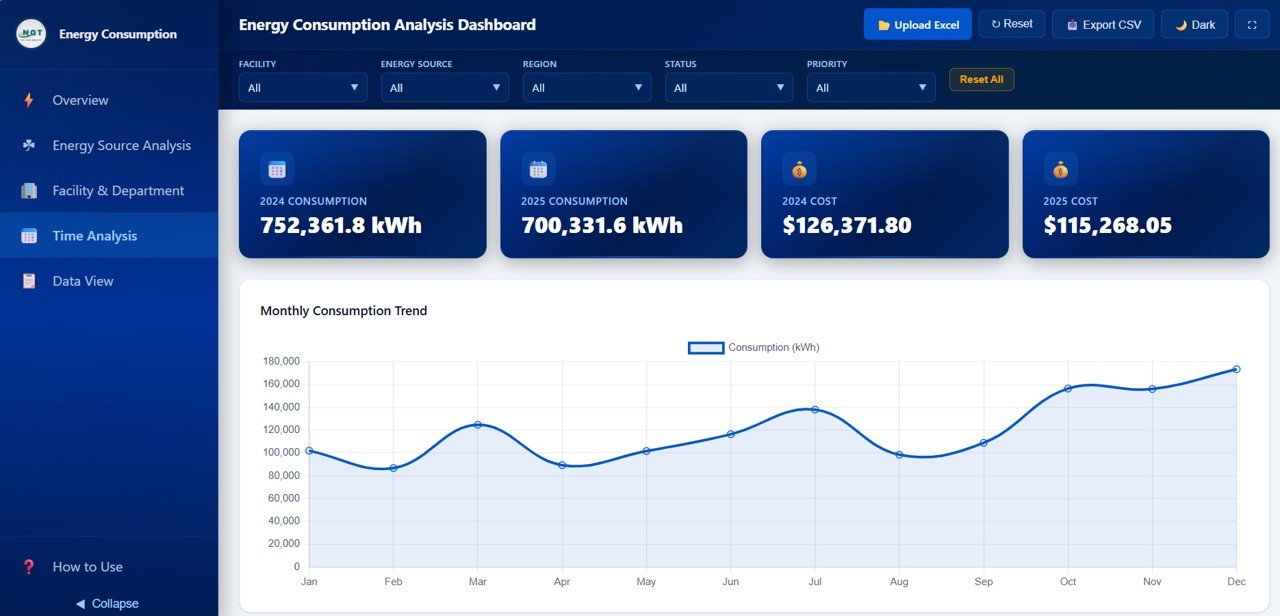
Time Analysis
Page 5 – Data View
The Data View page provides a detailed data table where you can see all energy consumption records with powerful search, sort, and pagination features. This page is designed for users who need to drill down into individual records, verify data accuracy, or extract specific subsets of information. You can also export the filtered data to CSV for further offline analysis, compliance reporting, or integration with external analytics platforms.
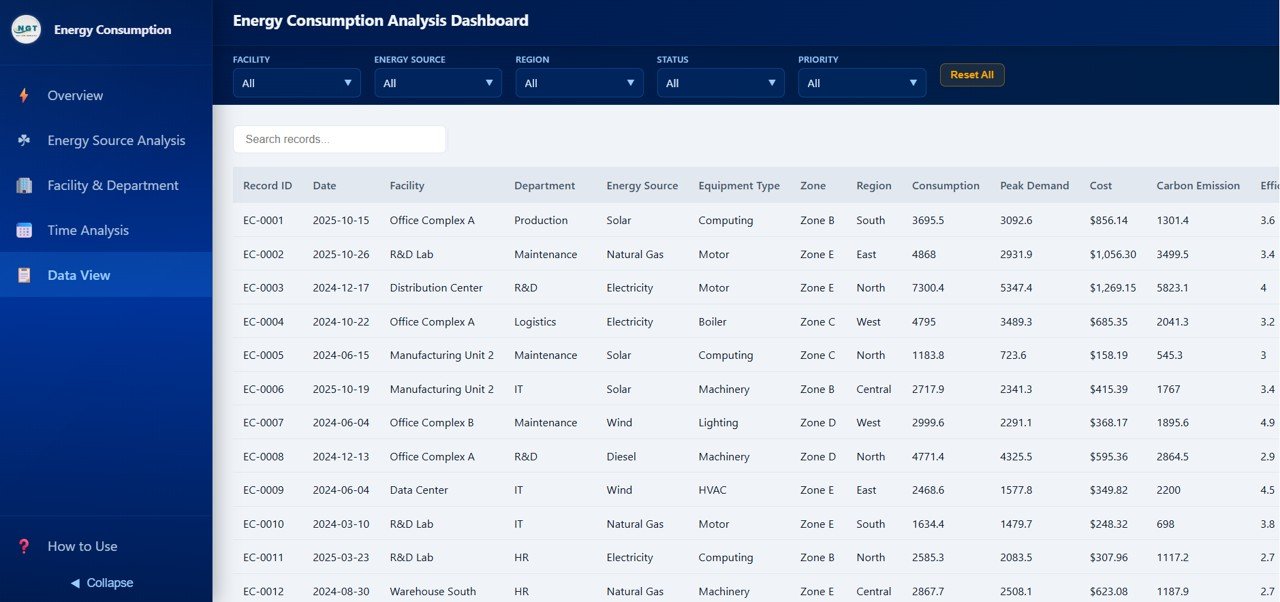
Data View Tab
Advantages of Energy Consumption Analysis Dashboard in HTML
- Comprehensive Multi-Dimensional Analysis – Five dedicated pages cover every angle of energy consumption from source-level breakdowns to facility comparisons and time-based trends.
- Instant Carbon Emission Visibility – Built-in emission tracking charts across departments, sources, and facilities support sustainability reporting and environmental compliance requirements.
- No Software Dependencies – Runs entirely in the browser with no installation, licensing, or plugin requirements making it accessible to anyone with a web browser.
- Interactive Data Exploration – Advanced slicers, filters, and the Data View table with search, sort, and export capabilities enable deep data exploration without technical skills.
- Professional Presentation Quality – Clean visual design and consistent color themes make it suitable for boardroom presentations, stakeholder reports, and management reviews.
Opportunities for Improvement
- Real-Time Data Integration – Currently uses static data files; future versions could integrate with live IoT sensors or SCADA systems for real-time energy monitoring.
- Predictive Analytics – Adding machine learning-based consumption forecasting could help organizations anticipate energy needs and optimize procurement strategies.
- Alert and Threshold System – Automated alerts when consumption or emissions exceed predefined thresholds would enable proactive energy management.
- Multi-Currency Support – Adding currency conversion options would make the dashboard more useful for organizations operating across multiple countries.
Best Practices for Using the Energy Consumption Analysis Dashboard
- Update Data Regularly – Replace the sample data with your actual energy consumption records monthly or quarterly for accurate trend analysis and reporting.
- Use Filters Strategically – Apply slicers to isolate specific regions, departments, or energy sources to identify targeted optimization opportunities.
- Benchmark Year-over-Year – Use the Time Analysis page regularly to compare current performance against historical baselines and measure the impact of efficiency initiatives.
- Export for Compliance – Use the CSV export feature on the Data View page to prepare data for regulatory submissions, sustainability reports, and audit documentation.
- Share with Stakeholders – Host the HTML file on an internal server or share it directly with management teams for collaborative energy performance reviews.
Explore Relevant Templates
If you found the Energy Consumption Analysis Dashboard in HTML useful, explore these related templates from NextGenTemplates.com:
- Energy and Utility Dashboard in HTML – Track power output, emissions, efficiency, and downtime across energy facilities with production analysis and environmental monitoring pages.
- Construction Dashboard in HTML – Monitor construction project performance, budgets, progress, and safety incidents with 5 interactive analytics pages.
- All HTML Dashboard Templates – Browse the complete collection of interactive browser-based dashboard templates for every industry.
Frequently Asked Questions
What is the best HTML dashboard template for tracking energy consumption?
The Energy Consumption Analysis Dashboard in HTML by NextGenTemplates is a top-rated template that provides 5 interactive pages covering energy source analysis, facility and department breakdowns, time-based trends, and carbon emission tracking with dynamic KPI cards, advanced filters, and CSV export functionality.
How many KPIs does the Energy Consumption Analysis Dashboard track?
The dashboard tracks 6 key performance indicators: Total Consumption, Total Cost, Carbon Emission, Avg Efficiency, Peak Demand, and Total Records. These KPI cards are displayed prominently on the Overview page and update dynamically based on applied filters.
Can I use this dashboard for carbon emission reporting?
Yes. The dashboard includes dedicated carbon emission charts across multiple dimensions including Carbon Emission by Department, Carbon Emission by Energy Source, Carbon Emission by Facility, and Monthly Carbon Emission trends. You can export the data to CSV for compliance and sustainability reporting.
Do I need technical skills to use this HTML energy dashboard?
No advanced technical skills are required. Simply download the ZIP file, extract it, open the HTML file in any modern browser, and replace the sample data with your own energy consumption records. All charts and KPIs update automatically.
How does the Energy Consumption Analysis Dashboard compare to the Energy and Utility Dashboard?
The Energy Consumption Analysis Dashboard focuses specifically on consumption patterns, costs, carbon emissions, and efficiency metrics with dedicated facility, department, and time analysis pages. The Energy and Utility Dashboard covers a broader scope including power output, downtime tracking, and production analysis. Both are available as interactive HTML templates from NextGenTemplates.
Conclusion
The Energy Consumption Analysis Dashboard in HTML is a must-have analytics tool for any organization looking to gain complete visibility into energy consumption, costs, carbon emissions, and operational efficiency. With 5 interactive pages, 6 dynamic KPI cards, advanced slicers, and CSV export capabilities, this dashboard empowers energy managers and sustainability professionals to make data-driven decisions that reduce costs and minimize environmental impact.
Click here to Purchase Energy Consumption Analysis Dashboard in HTML
Visit our YouTube channel for step-by-step video tutorials: Youtube.com/@NeoTechNavigators
Click to buy Energy Consumption Analysis Dashboard in HTML