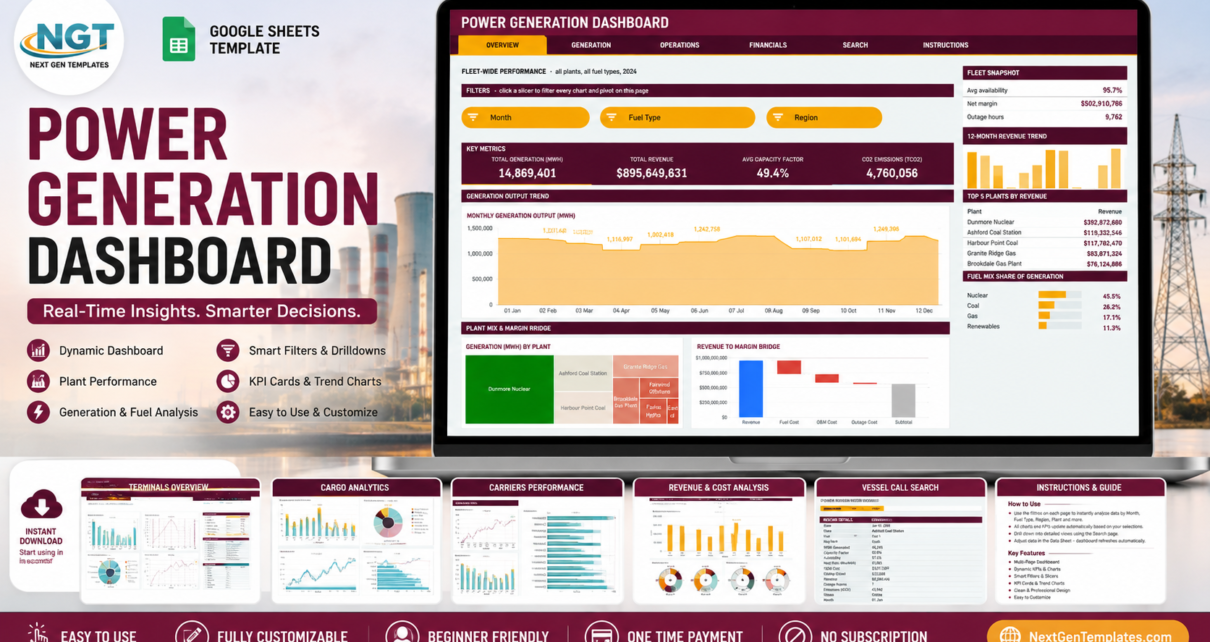
A six-page Power Generation Dashboard in Google Sheets built on native pivot tables and slicers – 16 KPI cards, 18 charts and a record lookup covering MWh, capacity factor, availability, outage hours, revenue and margin across your generation fleet.
Online Tutorial for Data Analysis and Automation
A six-page Power Generation Dashboard in Google Sheets built on native pivot tables and slicers – 16 KPI cards, 18 charts and a record lookup covering MWh, capacity factor, availability, outage hours, revenue and margin across your generation fleet.
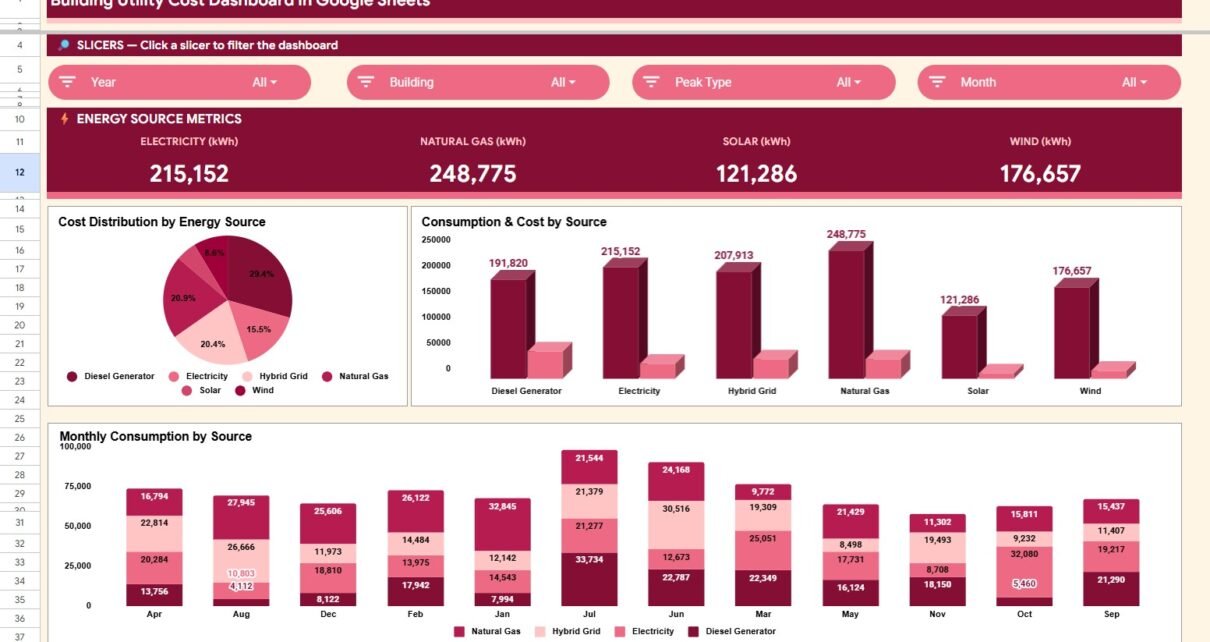
Track building utility costs in Google Sheets with Overview, Building Energy, Energy Source, Monthly Trends, Search Sheet, and Data Sheet tabs.
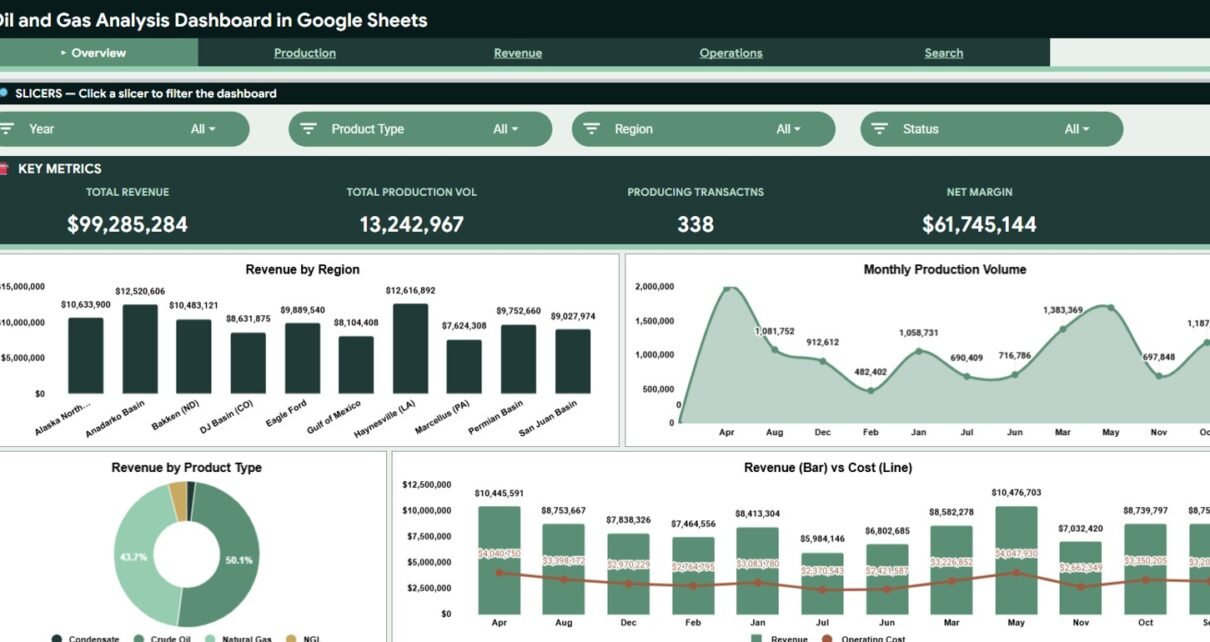
Review the Oil and Gas Analysis Dashboard in Google Sheets: 6 tabs, 4 KPI cards, slicers, production, revenue, operations, search lookup, and editable source data.
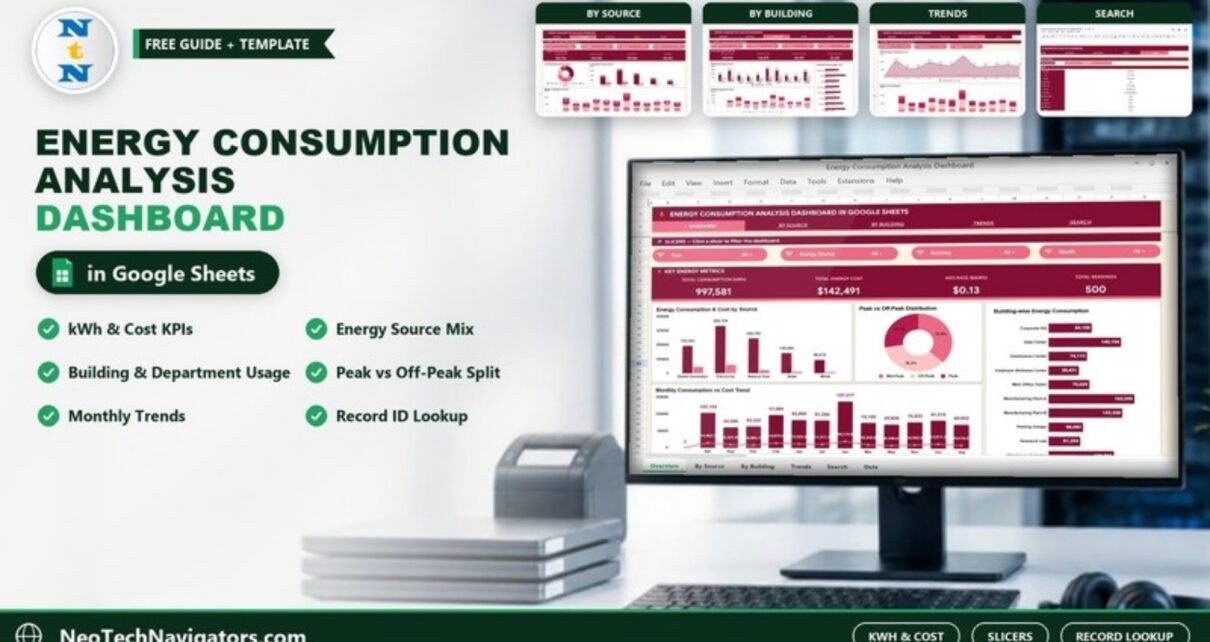
A page-by-page guide to the Energy Consumption Analysis Dashboard in Google Sheets: kWh, cost, source mix, building and department usage and monthly trends from one table of meter readings.
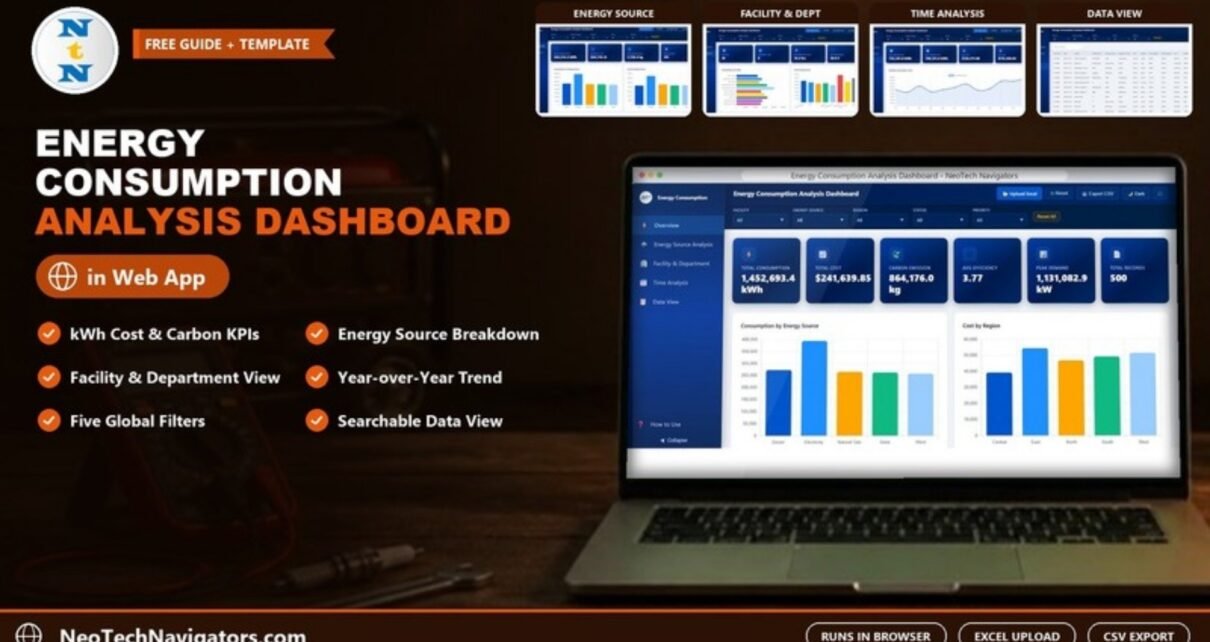
A page-by-page guide to the Energy Consumption Analysis Dashboard in HTML: consumption, cost and carbon by energy source, facility, department and year, with filters, search and CSV export in the browser.
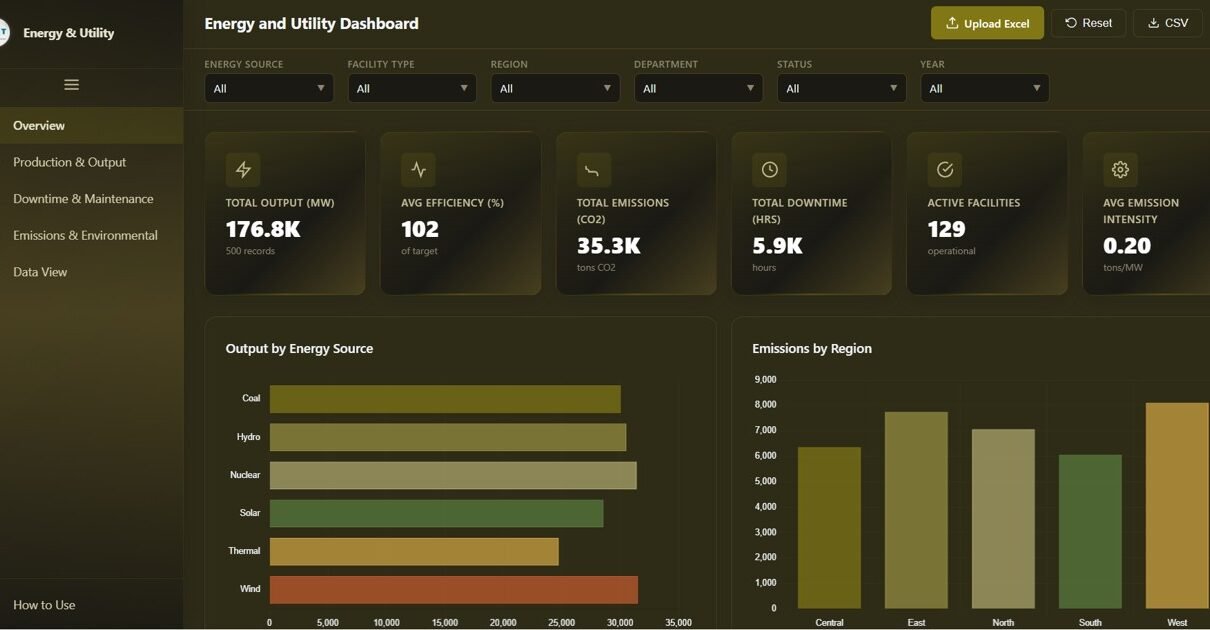
Track energy output, emissions, efficiency, and facility downtime with this interactive Energy and Utility Dashboard in HTML. Features five analysis pages with dynamic KPI cards, filters, charts, and CSV export.
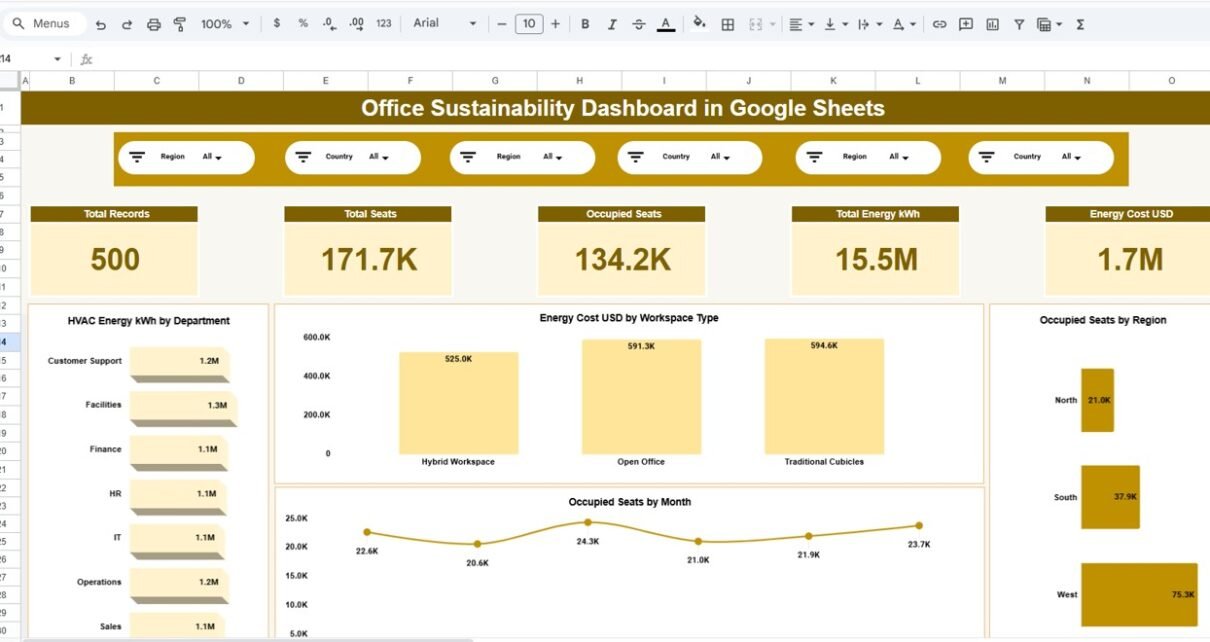
Organizations today face increasing pressure to reduce operational costs, optimize workspace utilization, and meet sustainability goals. However, sustainability data often remains scattered across spreadsheets, utility bills, and manual reports. As a result, tracking energy usage, water consumption, occupancy, and environmental impact becomes time-consuming and ineffective. That is exactly why the Office Sustainability Dashboard in Google […]