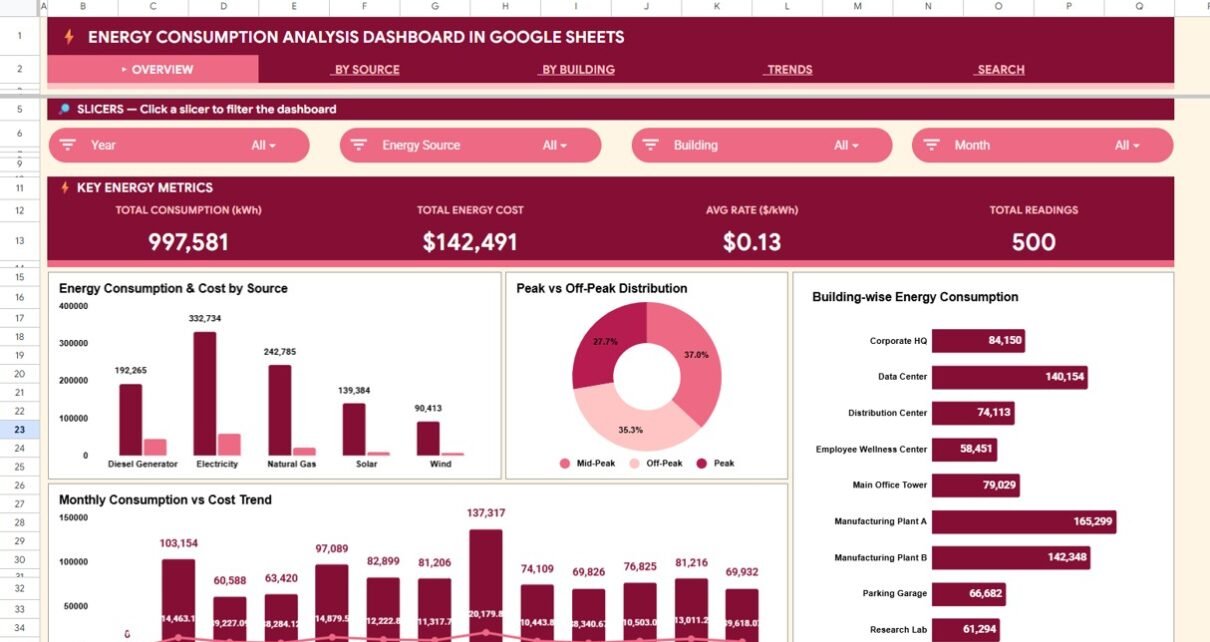
Energy Consumption Analysis Dashboard in Google Sheets tracks Total Consumption (kWh), Total Energy Cost, Avg Rate, and Total Readings across 6 pages with source, building, trend analysis, and record lookup.
Online Tutorial for Data Analysis and Automation
Energy Consumption Analysis Dashboard in Google Sheets tracks Total Consumption (kWh), Total Energy Cost, Avg Rate, and Total Readings across 6 pages with source, building, trend analysis, and record lookup.
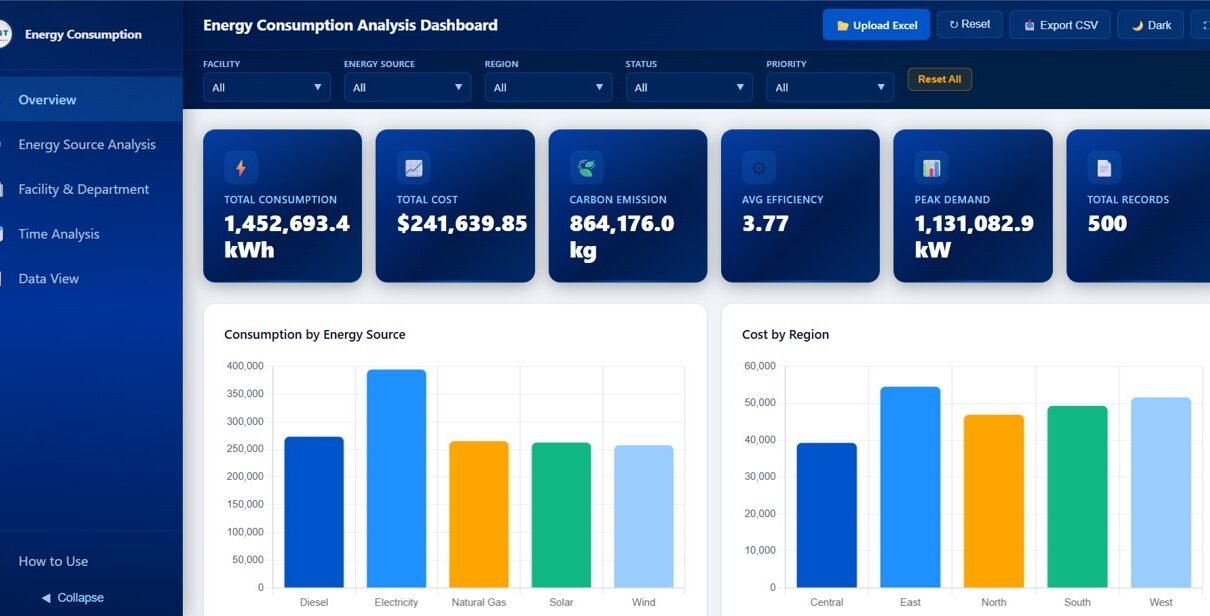
Explore the Energy Consumption Analysis Dashboard in HTML featuring 5 interactive pages to track consumption, costs, carbon emissions, efficiency, and peak demand with advanced filters and CSV export.
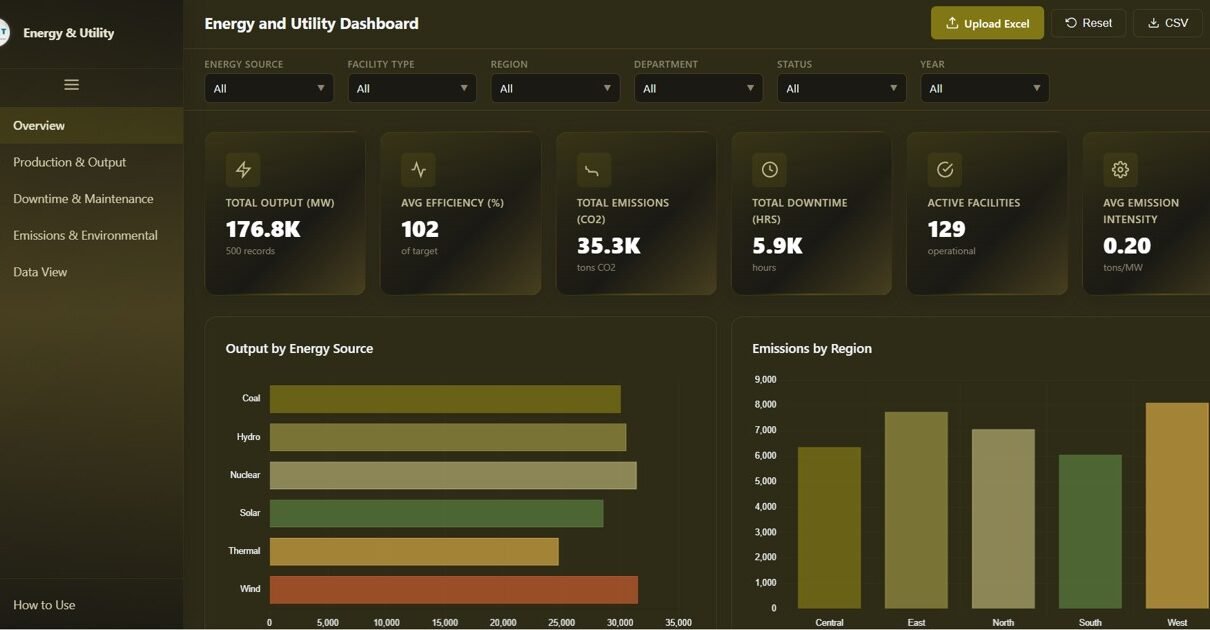
Track energy output, emissions, efficiency, and facility downtime with this interactive Energy and Utility Dashboard in HTML. Features five analysis pages with dynamic KPI cards, filters, charts, and CSV export.
Energy management has become a top priority for every organization. Costs keep rising. Sustainability goals become stricter. Meanwhile, companies must reduce carbon emissions while improving efficiency. However, many businesses still track energy data in scattered spreadsheets. As a result, managers struggle to monitor real performance. So, how can you track energy consumption, savings, CO₂ emissions, […]
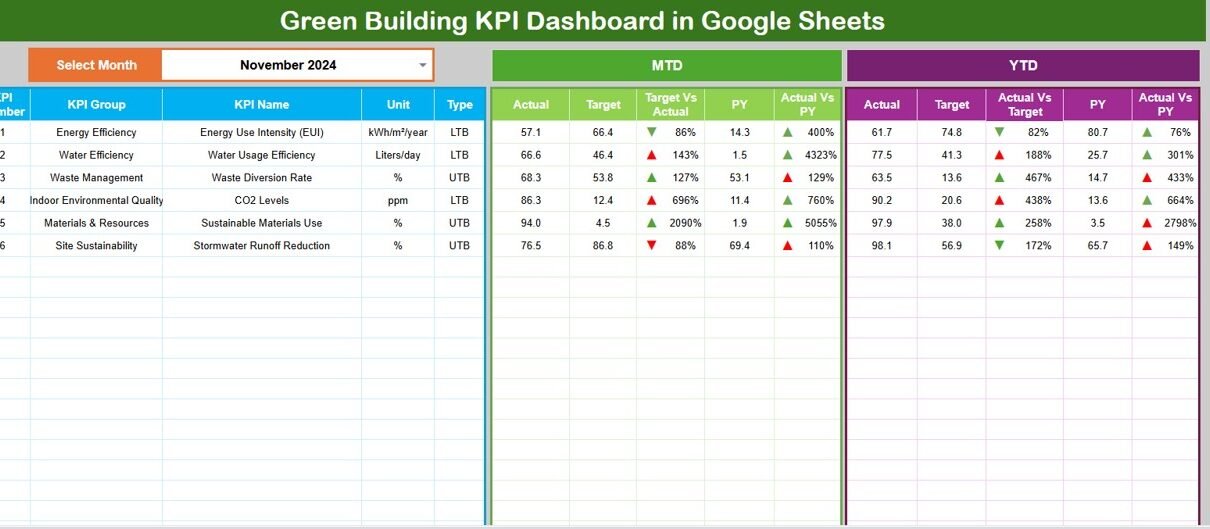
In the modern era of sustainable development, tracking and optimizing environmental performance is no longer optional — it’s essential. Whether you manage corporate buildings, educational institutions, or commercial spaces, sustainability performance directly impacts cost savings, environmental footprint, and brand reputation. That’s where the Green Building KPI Dashboard in Google Sheets comes in — a powerful, […]
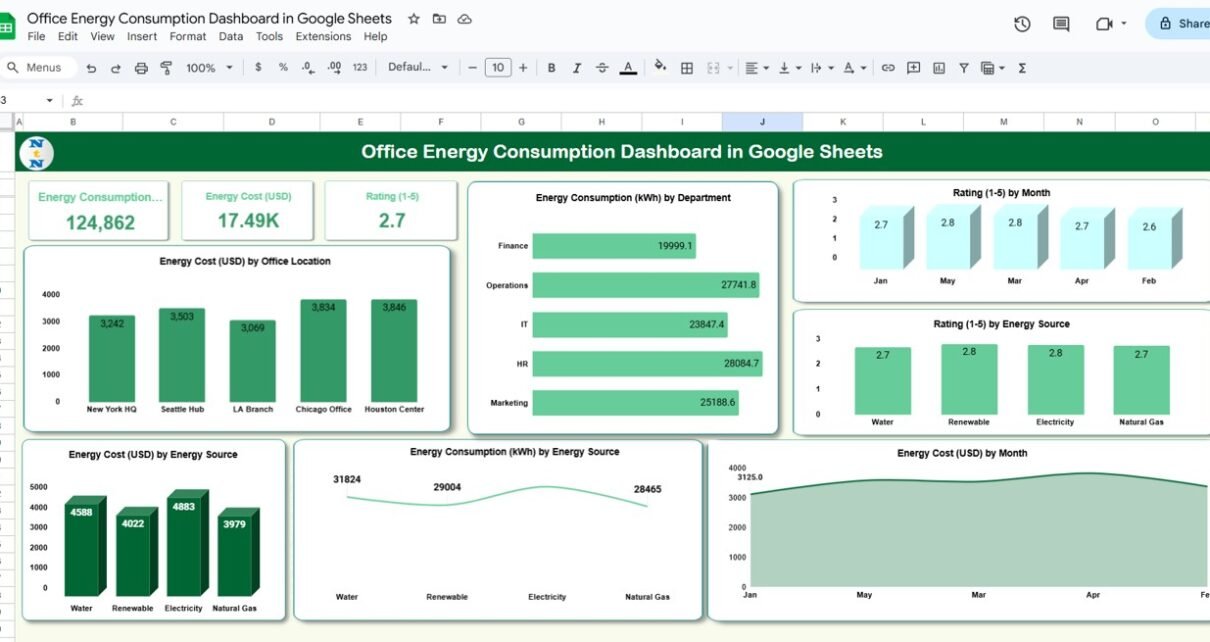
Managing energy consumption is a key part of reducing operational costs and supporting sustainability initiatives. The Office Energy Consumption Dashboard in Google Sheets provides a ready-to-use solution to monitor energy usage, track costs, and evaluate efficiency across departments and locations.Office Energy Consumption Dashboard in Google Sheets In this article, we will explain the features, benefits, […]
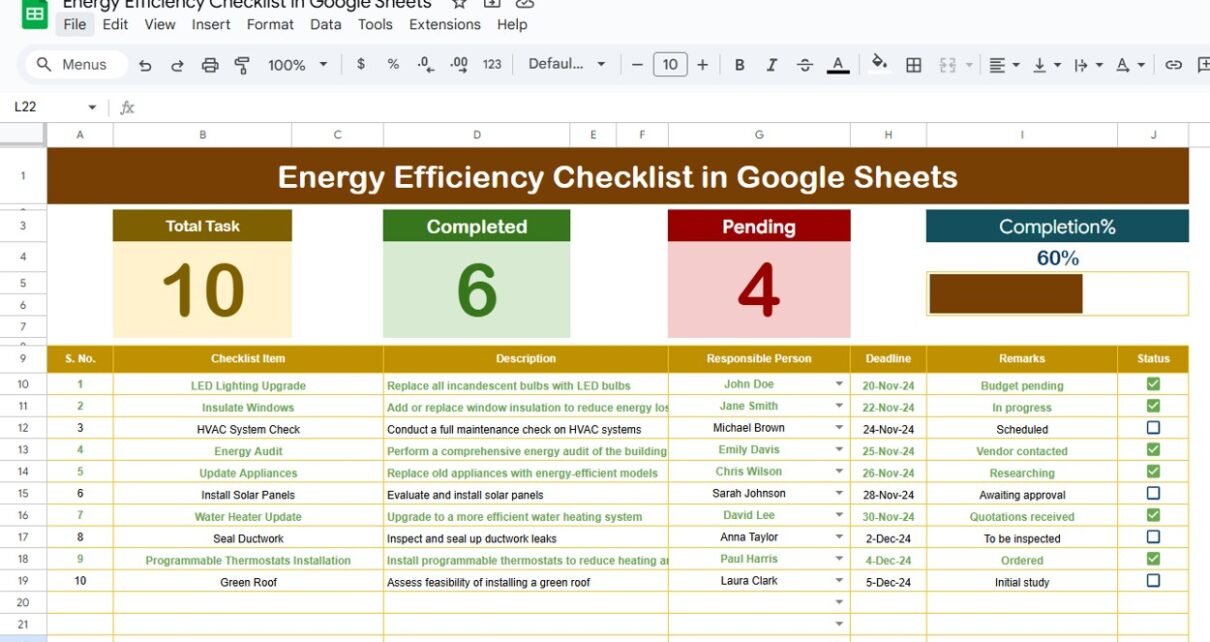
Energy efficiency is a key factor in reducing operational costs and minimizing environmental impact. The Energy Efficiency Checklist in Google Sheets is a ready-to-use template designed to help organizations track and manage energy efficiency tasks effectively. This template ensures that all tasks are completed on time, helping to improve energy consumption practices across various departments. […]
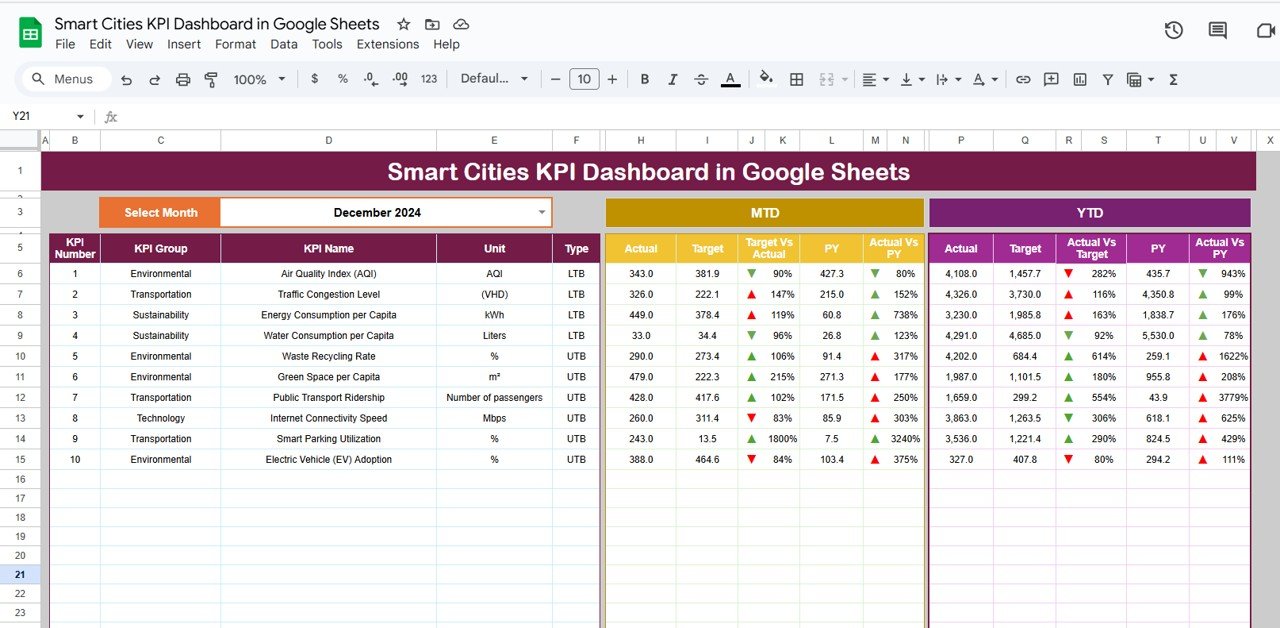
In an era where cities are becoming increasingly connected and intelligent, managing and optimizing the performance of a smart city requires tracking a wide range of key performance indicators (KPIs). The Smart Cities KPI Dashboard in Google Sheets is a ready-to-use template designed to help city managers, planners, and decision-makers track and monitor key metrics […]

Managing and optimizing hydropower operations requires tracking various performance metrics to ensure efficient energy production and operational effectiveness. The Hydropower KPI Dashboard in Google Sheets is a powerful tool designed to track key performance indicators (KPIs) related to hydropower plants. With this dashboard, stakeholders can monitor critical metrics such as energy generation, efficiency, cost, and […]

Wind energy has become one of the fastest-growing sources of renewable energy globally, and managing its performance effectively is key to achieving sustainability goals. A Wind Energy KPI Dashboard helps organizations track and evaluate critical performance metrics related to wind energy generation. With this tool, you can monitor essential KPIs such as energy production, efficiency, […]