Fleet Management Dashboard in HTML is a professionally designed, interactive, browser-based analytics template built for fleet managers, logistics coordinators, transportation companies, and operations teams who need to track vehicle performance, trip revenue, route efficiency, driver insights, and fleet KPIs — all from a single self-contained HTML file. This HTML Dashboard Template includes 5 interactive pages covering Overview, Fleet Performance, Route Analysis, Driver Insights, and a detailed Data View with search, sort, pagination, and CSV export. Whether you manage a small delivery fleet or a large-scale transportation operation, this template transforms raw fleet data into clear, actionable visual insights that help you maximize revenue, reduce fuel and maintenance costs, and improve driver performance.
Managing fleet operations without a centralized dashboard means scattered data across spreadsheets, delayed decisions, and missed cost-saving opportunities. The Fleet Management Dashboard in HTML solves this by consolidating all your fleet metrics into one browser-based experience — no software installation required. Simply unzip, open index.html, and start analyzing. For professionals who prefer other platforms, the Fleet Management Dashboard in Power BI and Fleet Management Dashboard in Google Sheets are also available.
Key Features of Fleet Management Dashboard in HTML
The Fleet Management Dashboard in HTML includes 5 interactive dashboard pages with over 20 analytical charts, 5 high-level KPI cards, and dynamic filter controls across every page. It is built entirely in HTML, CSS, and JavaScript — meaning it runs in any modern web browser without any plugins, add-ons, or desktop software. Here are the standout features that make this template essential for fleet operations:
- 5 Interactive Dashboard Pages — Overview, Fleet Performance, Route Analysis, Driver Insights, and Data View cover every critical aspect of fleet management from high-level KPIs to individual driver performance.
- 5 Dynamic KPI Cards — Total Revenue, Total Trips, Active Vehicles, Total Distance, and Average Rating are displayed as summary cards on the Overview page for instant visibility into fleet health.
- Vehicle-Level Cost Analytics — The Fleet Performance page tracks Fuel Cost by Vehicle Type, Maintenance Cost by Vehicle Type, Distance Covered by Fuel Type, Average Speed by Vehicle Type, and Revenue by Vehicle ID.
- Route Profitability Analysis — The Route Analysis page evaluates Revenue by Route, Trip Volume by Region, Average Trip Duration by Route, Total Distance by Region, and Trip Volume by Month and Region.
- Driver Performance Tracking — The Driver Insights page analyzes Revenue by Driver, Trip Count by Driver, Driver Count by Rating Band, Average Rating by Vehicle Type, and Revenue by Distance per Driver.
- Searchable Data View with CSV Export — Browse all records with search, sort, pagination, and export to CSV for presentations and further analysis.
- No Software Installation Required — Runs entirely in Chrome, Edge, Firefox, or Safari. Zero dependencies.
Dashboard Pages Explanation
1 — Overview Page
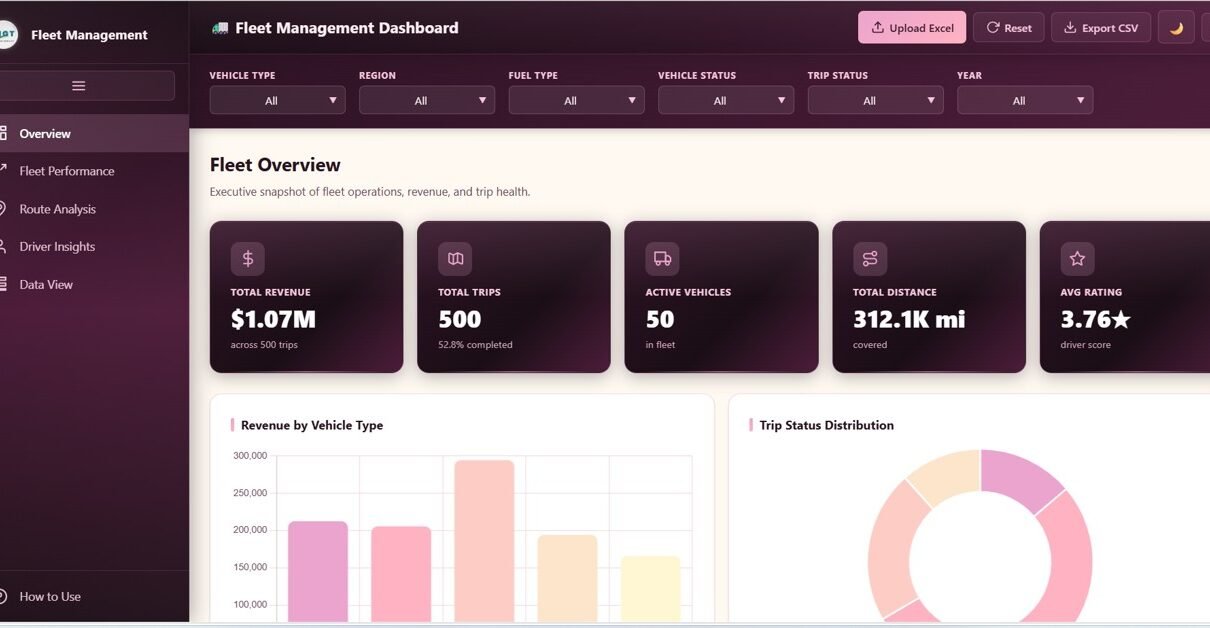
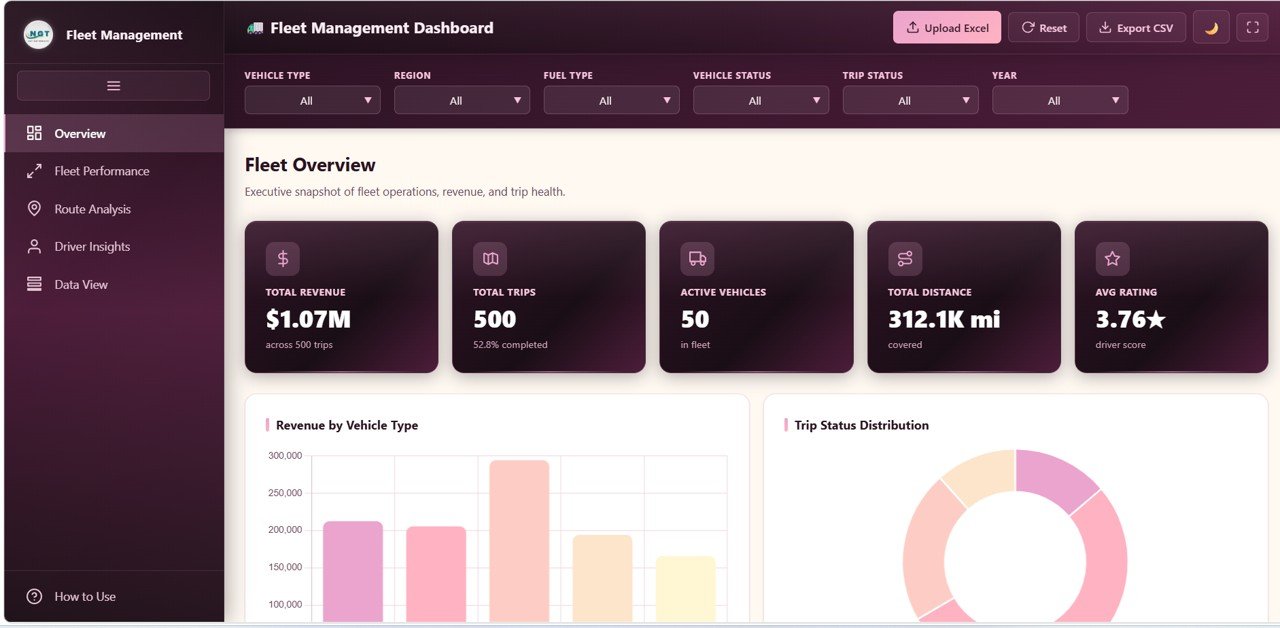
The Overview page serves as the command center for your entire fleet operation. At the top, five KPI cards give you an instant snapshot of Total Revenue, Total Trips, Active Vehicles, Total Distance, and Average Rating. Below the cards, five interactive charts provide deeper analysis: Revenue by Vehicle Type helps you identify which vehicle categories generate the most income, Trip Count by Trip Status shows how many trips are completed, in progress, or cancelled, Revenue by Month reveals seasonal revenue patterns and growth trends, Vehicle Count by Vehicle Status gives you a real-time view of how many vehicles are active, idle, or under maintenance, and Revenue by Region evaluates geographic performance across your service areas. Multiple slicers and filter controls allow you to instantly narrow down the data by any dimension.
Fleet Management Dashboard in HTML- Overview Page
2 — Fleet Performance
The Fleet Performance page provides granular vehicle-level operational analysis. Fuel Cost by Vehicle Type compares fuel expenses across different vehicle categories, helping you identify which types consume the most fuel relative to their revenue contribution. Maintenance Cost by Vehicle Type highlights which vehicles demand the highest maintenance investment, enabling proactive maintenance scheduling and budget planning. Distance Covered by Fuel Type shows how diesel, petrol, electric, and hybrid vehicles contribute to your total distance coverage. Average Speed by Vehicle Type benchmarks operational efficiency across your fleet, and Revenue by Vehicle ID lets you pinpoint your top-performing individual vehicles.
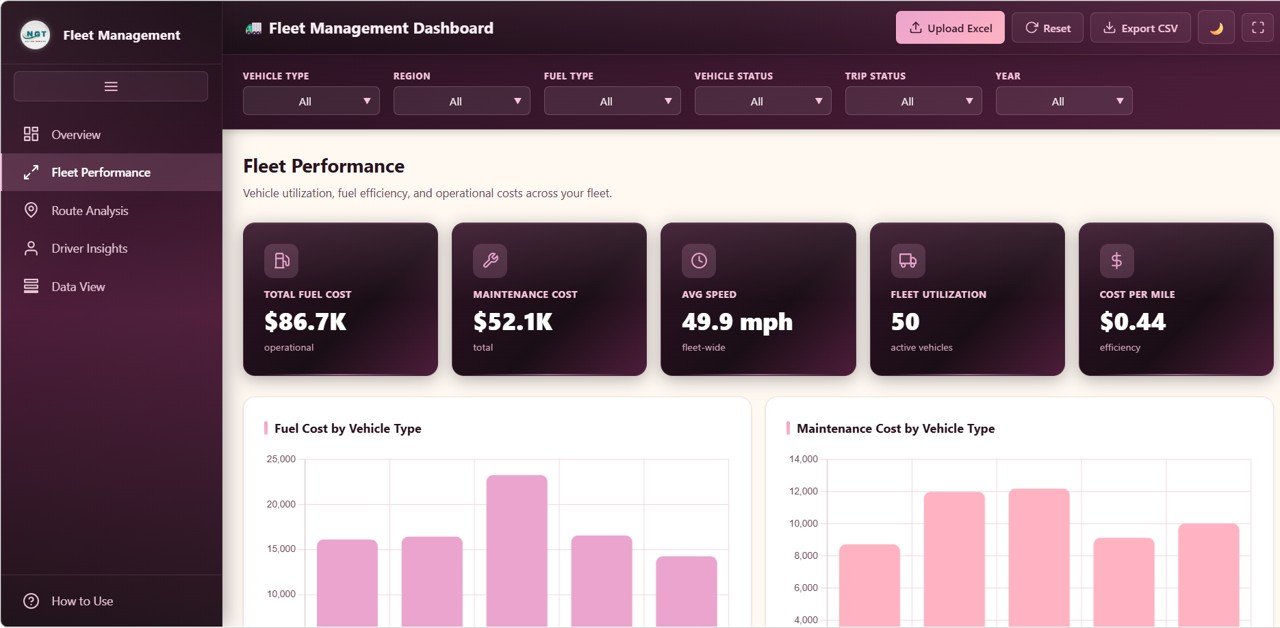
Fleet Performance
3 — Route Analysis
The Route Analysis page evaluates the profitability and efficiency of your fleet routes and regions. Revenue by Route identifies your most lucrative routes so you can allocate more vehicles and drivers to high-demand corridors. Trip Volume by Region shows where demand is concentrated, helping you plan expansion or rebalancing strategies. Average Trip Duration by Route measures how long each route takes on average, revealing potential bottlenecks or inefficiencies. Total Distance by Region provides geographic coverage insights, and Trip Volume by Month and Region combines temporal and geographic analysis to uncover seasonal demand patterns across different service areas.
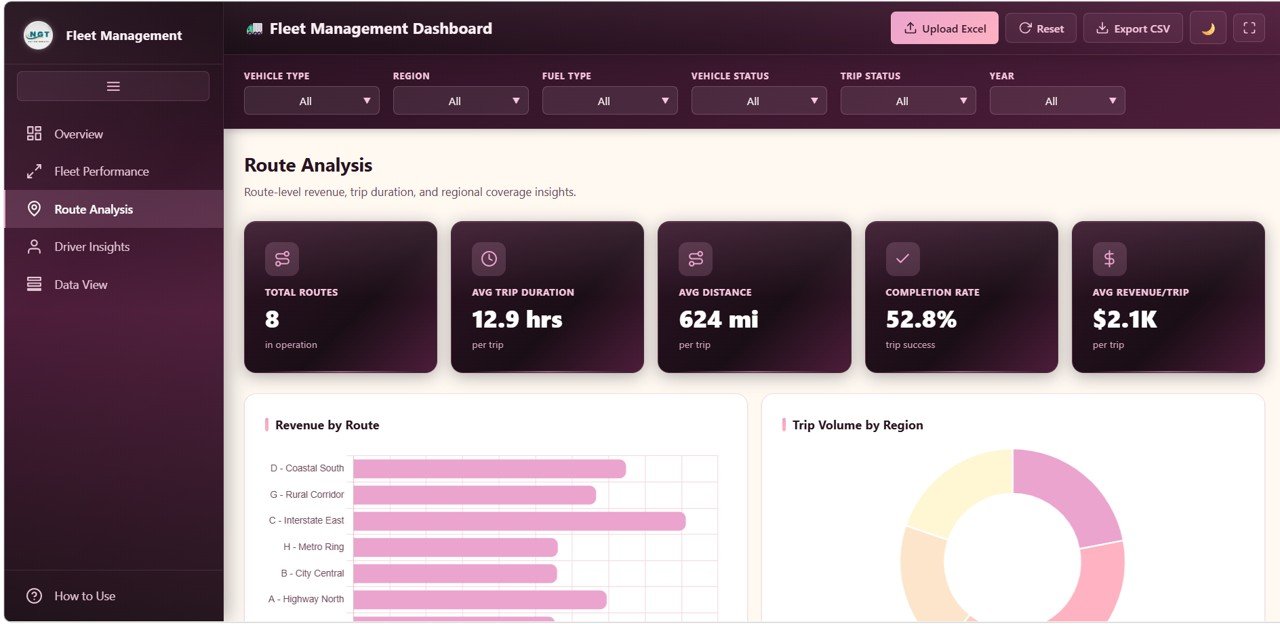
Route Analysis
4 — Driver Insights
The Driver Insights page gives fleet managers complete visibility into driver performance and contribution. Revenue by Driver ranks your drivers by total revenue generated, making it easy to identify top earners and reward high performers. Trip Count by Driver measures workload distribution to ensure fair assignment and prevent burnout. Driver Count by Rating Band segments your driver pool by customer satisfaction scores, showing the overall quality distribution of your team. Average Rating by Vehicle Type reveals whether certain vehicle assignments impact driver ratings, and Revenue by Distance per Driver evaluates earnings efficiency — helping you understand which drivers generate the most revenue relative to the distance they cover.
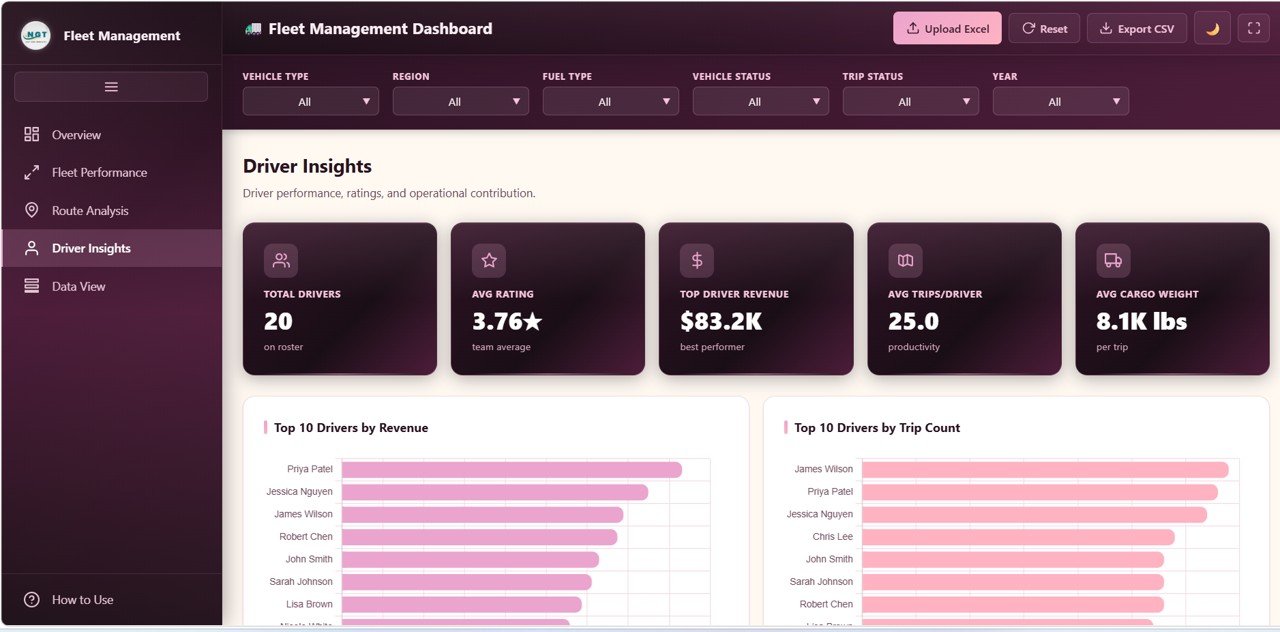
Driver Insights
5 — Data View
The Data View page is the detailed data table page. Here you can see all the records with search, sort, and pagination features. You can also export the filtered data to CSV for further analysis, reporting, or sharing with stakeholders. This page serves as the raw data backbone of the entire dashboard, giving you full control over every record in your fleet dataset.
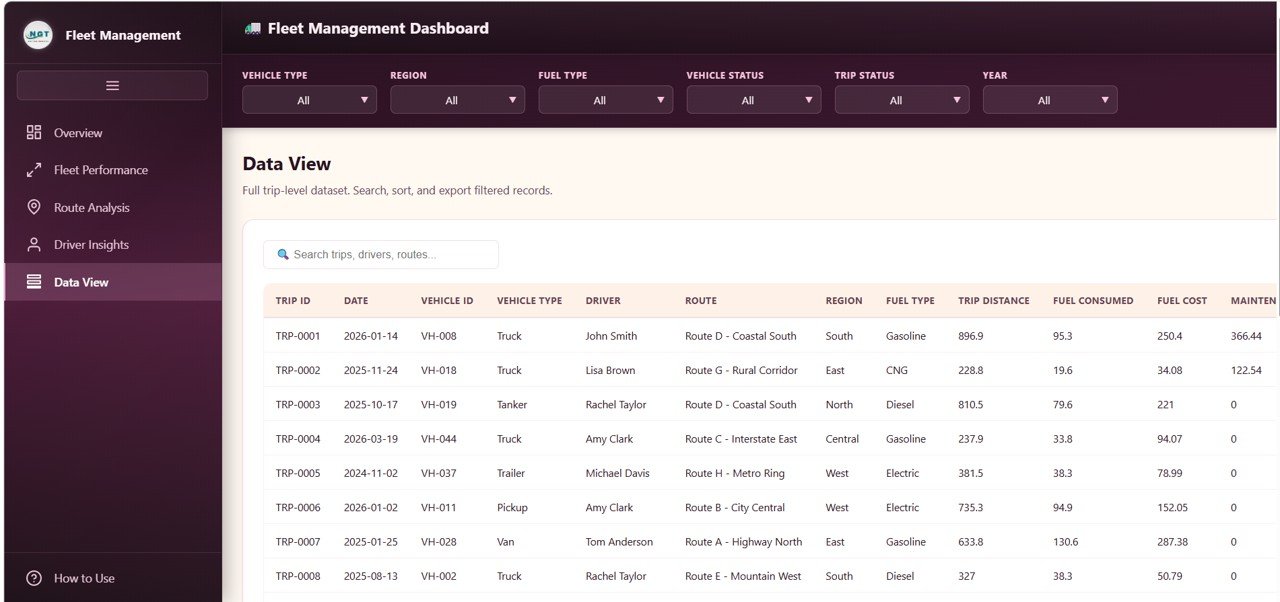
Data View Tab
Advantages of Fleet Management Dashboard in HTML
The Fleet Management Dashboard in HTML offers several compelling advantages over traditional fleet tracking methods. First, it requires absolutely no software installation — you can open it on any device with a web browser, making it accessible to everyone on your team regardless of their technical setup. Second, the dashboard provides a holistic 360-degree view of fleet operations across five dedicated analysis pages, covering everything from high-level KPIs to individual driver and vehicle metrics. Third, the interactive filter controls and slicers on every page let you drill down into specific vehicle types, regions, routes, or drivers within seconds. Fourth, the built-in CSV export functionality on the Data View page makes it easy to extract filtered data for external reporting, presentations, or integration with other systems. Finally, the professional SaaS-style design with clean charts and intuitive tab navigation makes this dashboard presentation-ready for stakeholder meetings, board reviews, and operational briefings.
Opportunities for Improvement
While this dashboard covers a comprehensive range of fleet metrics, there are some areas where users could extend its functionality. Adding real-time GPS integration would enable live vehicle tracking alongside the analytical dashboard. Incorporating fuel price data could enhance the Fuel Cost analysis with cost-per-mile calculations. A predictive maintenance module using historical maintenance data could help fleet managers anticipate vehicle breakdowns before they occur. Additionally, integrating driver scheduling and shift management would make the Driver Insights page even more actionable for day-to-day fleet operations.
Best Practices for Using the Fleet Management Dashboard in HTML
To get the most out of this dashboard, start by reviewing the Overview page daily to catch any anomalies in your KPIs early. Use the Fleet Performance page weekly to compare fuel and maintenance costs across vehicle types and identify vehicles that may need attention. Review the Route Analysis page monthly to evaluate route profitability trends and adjust your route planning accordingly. The Driver Insights page is best used during performance reviews and incentive planning to reward top performers and identify coaching opportunities. Finally, use the Data View page to export filtered reports before monthly management meetings or when preparing fleet performance documentation for stakeholders. Keep your data file updated regularly to ensure all charts and KPIs reflect the latest fleet operations data.
Explore Relevant Templates
If you are looking for fleet management analytics in other platforms, explore these related templates from NextGenTemplates:
- Fleet Management Dashboard in Power BI — Advanced fleet analytics with Power BI interactive visuals and dynamic slicers.
- Fleet Management Dashboard in Google Sheets — Cloud-based fleet analytics with Google Apps Script powered dashboards.
- Property Management Dashboard in HTML — Browser-based property management analytics with 5 interactive pages.
- Hotel and Hospitality Revenue Dashboard in HTML — Track hotel revenue, bookings, occupancy, and guest satisfaction in your browser.
Frequently Asked Questions
What KPIs does the Fleet Management Dashboard in HTML track?
The Fleet Management Dashboard in HTML tracks 5 key performance indicators: Total Revenue, Total Trips, Active Vehicles, Total Distance, and Average Rating. It also provides over 20 analytical charts across 5 interactive pages covering fleet performance, route analysis, driver insights, and a searchable data view with CSV export.
Do I need any software to use this HTML fleet dashboard?
No. This dashboard runs entirely in your web browser. Simply unzip the downloaded file and open index.html in Chrome, Edge, Firefox, or Safari. No Excel, Power BI, or coding knowledge required.
Can I track individual vehicle and driver performance?
Yes. The Fleet Performance page includes Revenue by Vehicle ID for individual vehicle tracking, and the Driver Insights page provides Revenue by Driver, Trip Count by Driver, and Rating Band analysis for complete driver-level performance visibility.
How do I replace the sample data with my own fleet data?
Open the data file included in the download package, replace the sample records with your own fleet data in the same column format, save the file, and reload the HTML dashboard in your browser. All charts, KPIs, and filters update automatically.
What is the best HTML dashboard template for fleet management?
The Fleet Management Dashboard in HTML from NextGenTemplates is one of the most comprehensive browser-based fleet analytics solutions available. It covers 5 interactive pages including vehicle cost tracking, route profitability, driver performance, and a searchable data table with CSV export — all without requiring any software installation.
Is this dashboard available in Excel, Power BI, or Google Sheets?
Yes. NextGenTemplates offers the Fleet Management Dashboard in multiple platforms including Power BI, Google Sheets, and Excel. Choose the platform that best fits your team’s workflow.
Conclusion
The Fleet Management Dashboard in HTML is a powerful, zero-installation analytics solution for fleet managers, logistics teams, and transportation companies who want to track fleet revenue, vehicle costs, route profitability, and driver performance from a single browser-based dashboard. With 5 interactive pages, 20+ analytical charts, dynamic filters, and CSV export capability, this template delivers enterprise-level fleet analytics without any software dependencies. Replace the sample data with your own, and you will have a presentation-ready fleet management dashboard running in minutes.
👉 Click here to Purchase Fleet Management Dashboard in HTML
👉 Visit our YouTube channel for step-by-step video tutorials: Youtube.com/@NeoTechNavigators