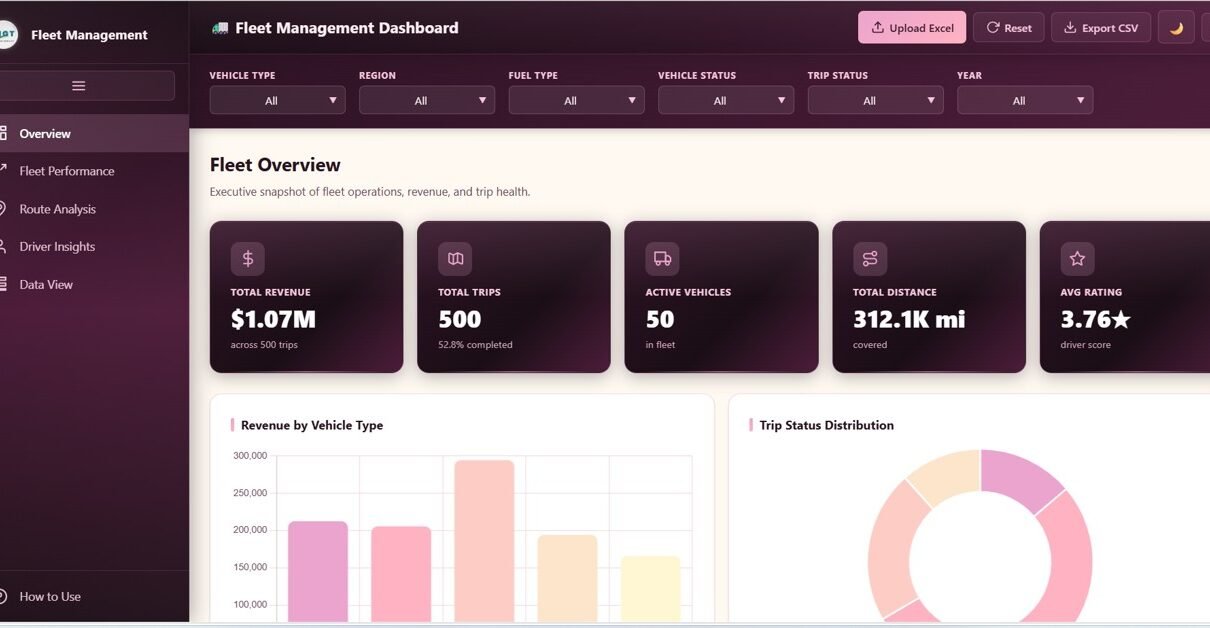
Fleet Management Dashboard in HTML with 5 interactive pages tracking fleet revenue, vehicle performance, route analysis, driver insights, and data view. Track Total Revenue, Total Trips, Active Vehicles, Total Distance, and Average Rating with 20+ analytical charts.
Tag: Power BI tricks
Field Parameters in Power BI with 3 easy examples
In the world of data visualization, Microsoft Power BI has revolutionized the way users interact with their data. One powerful is Field Parameters in Power BI, which allow users to create dynamic reports and dashboards by switching between different fields in their visuals. Whether you’re a beginner or an experienced Power BI user, mastering Field […]

