According to the UN Office for Disaster Risk Reduction, over 350 natural disasters affect communities worldwide each year, displacing millions and straining emergency response resources. Yet most disaster relief organizations track KPIs manually — using disconnected spreadsheets, paper logs, or expensive SaaS tools that charge per-user fees. The Disaster Relief KPI Dashboard in Google Sheets tracks 12+ KPIs across 6 interactive sheets with pre-built trend charts, conditional formatting arrows, and a month-selector dropdown — all for a one-time cost of $8.99.
Whether you’re monitoring response times, resource utilization, beneficiary reach, or shelter occupancy, this ready-to-use Google Sheets template gives your disaster relief team a structured KPI tracking system without SaaS subscriptions. Just copy the template to Google Drive, replace the sample data, and every metric updates automatically within 10 minutes.
Key Features of the Disaster Relief KPI Dashboard in Google Sheets
Click here to Purchase the Disaster Relief KPI Dashboard in Google Sheets
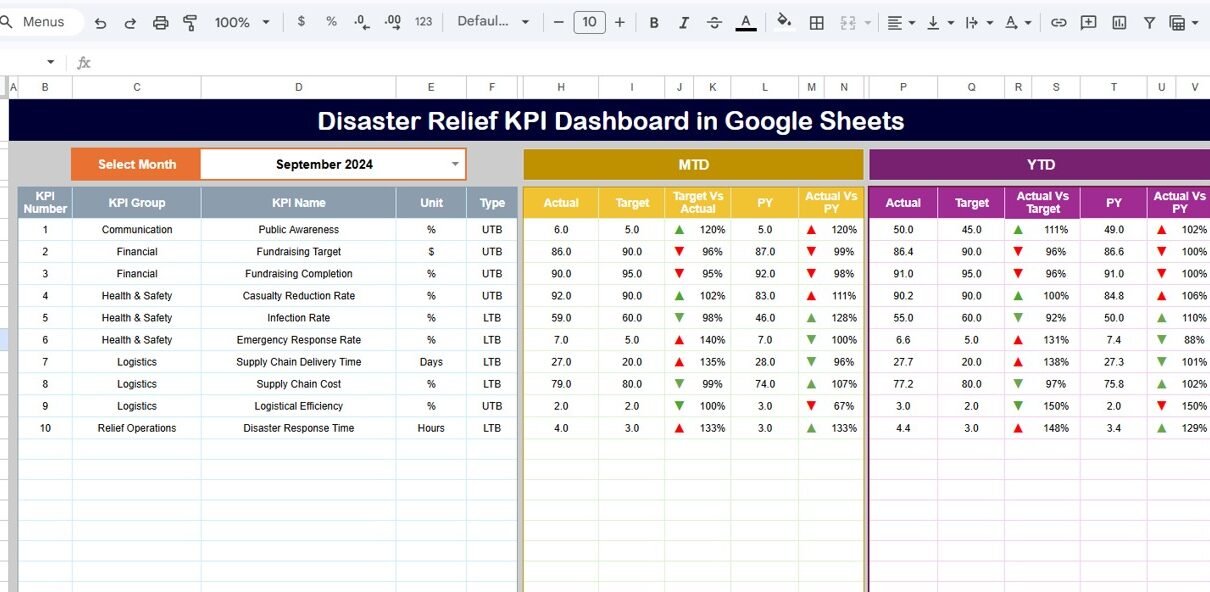
The Disaster Relief KPI Dashboard in Google Sheets includes a dynamic month-selector dropdown on cell D3 that refreshes all dashboard numbers for that specific month. It displays MTD Actual, Target, and Previous Year data alongside YTD Actual, Target, and Previous Year data — with conditional formatting up/down arrows showing Target vs Actual and PY vs Actual performance at a glance.
On the KPI Trend sheet, you can select any individual KPI from the dropdown on cell C3. The sheet displays the KPI Group, Unit of KPI, Type (Lower the Better or Upper the Better), Formula, and Definition — along with MTD and YTD trend charts comparing Actual, Target, and PY numbers over time.
Three dedicated data input sheets — Actual Numbers, Target Numbers, and Previous Year Numbers — keep raw data separate from analysis. The Actual Numbers sheet lets you change the starting month on cell E1 to align with your fiscal year. The KPI Definition sheet serves as a single source of truth where you define each metric with its name, group, unit, formula, definition, and type (LTB or UTB).
This template is designed for real-time collaboration. Because it runs on Google Sheets, multiple team members can input data simultaneously from any device with a browser — no version conflicts, no desktop licenses required.
Dashboard Sheets Explanation
The Disaster Relief KPI Dashboard in Google Sheets contains 6 purpose-built sheets. Here’s what each one does:
1. Dashboard Sheet
This is the main analysis page. Select any month from the dropdown on range D3, and the entire sheet updates to show MTD Actual, Target, Previous Year data plus YTD Actual, Target, Previous Year data. Conditional formatting arrows (up/down) indicate whether each KPI is ahead or behind Target and PY performance.
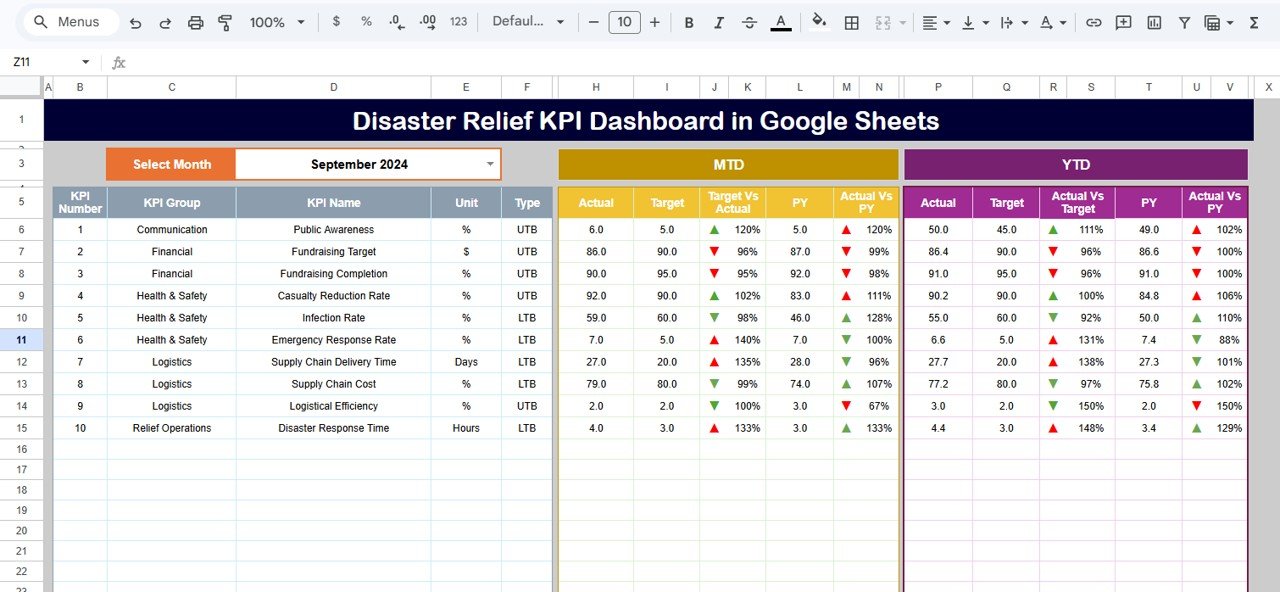
Disaster Relief KPI Dashboard in Google Sheets
2. KPI Trend Sheet
Select any KPI from the dropdown on cell C3. The sheet displays KPI Group, Unit, Type (LTB/UTB), Formula, and Definition. Below, MTD and YTD trend charts compare Actual, Target, and PY numbers across months — helping you spot patterns and seasonal variations in disaster response performance.
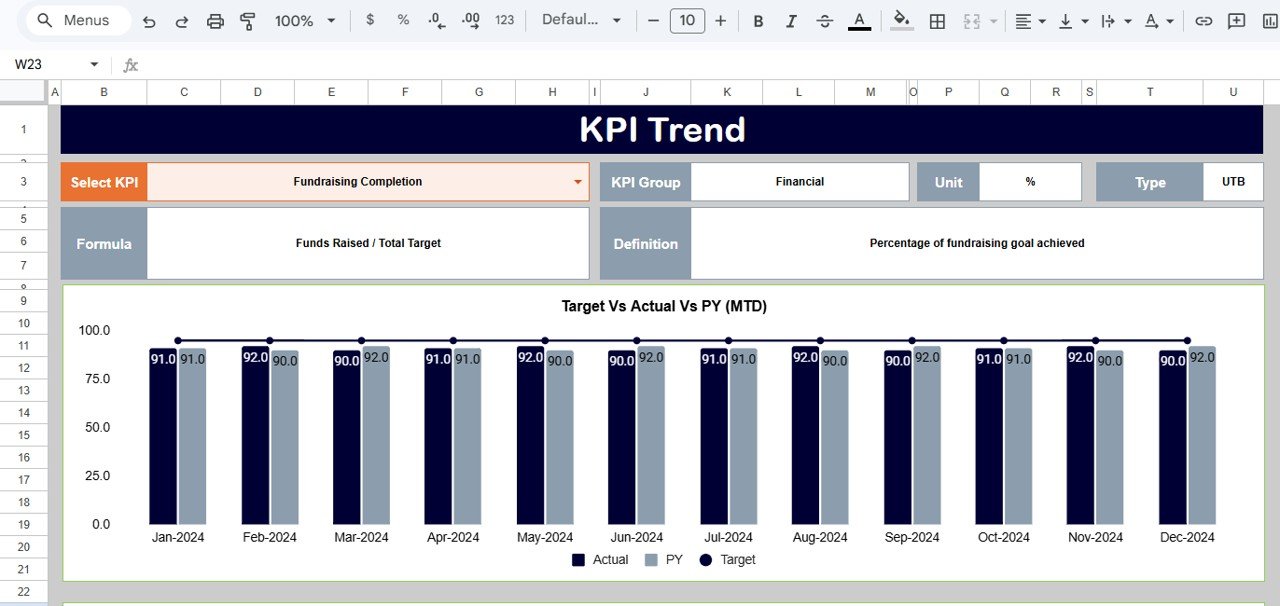
KPI Trend Sheet
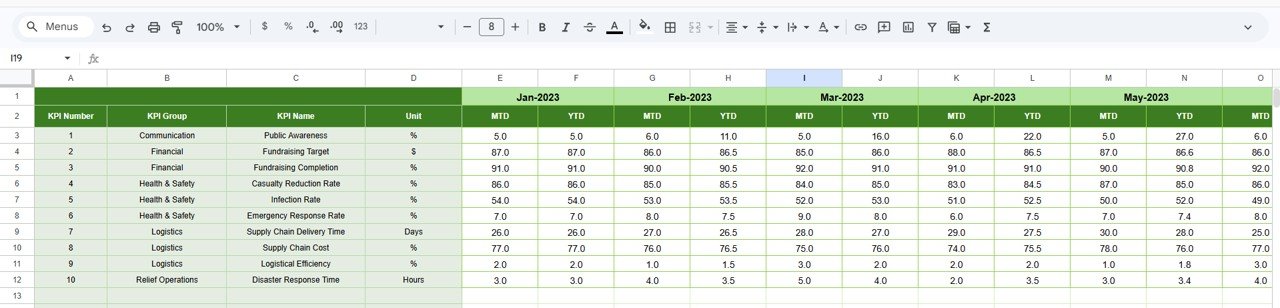
3. Actual Numbers Input Sheet
Enter your MTD and YTD actual numbers for each month. Set the starting month on cell E1 to align with your organization’s fiscal year. All formulas on the Dashboard and Trend sheets pull data from this sheet automatically.
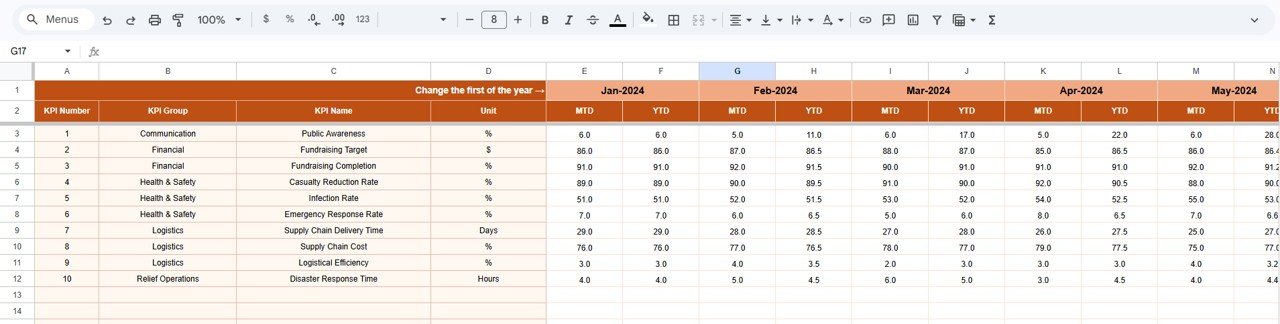
Actual Numbers Input Sheet
4. Target Number Input Sheet
Enter the target numbers for each KPI for each month — both MTD and YTD. These targets are used on the Dashboard sheet for Target vs Actual comparison with conditional formatting arrows.
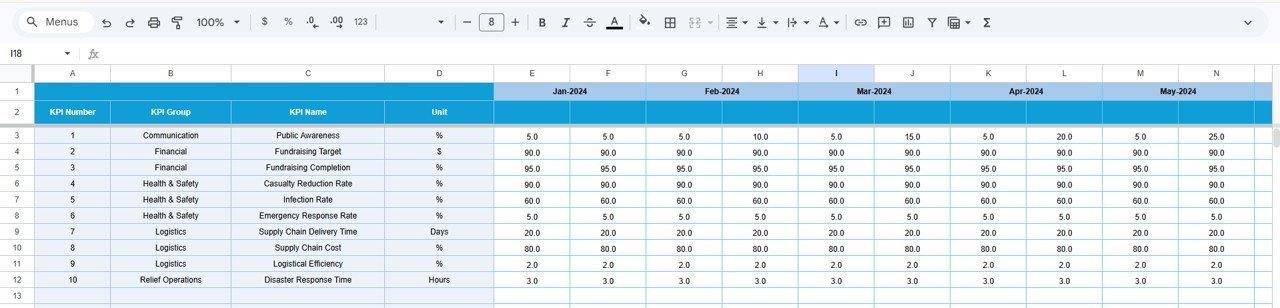
Target Number Input Sheet
5. Previous Year Number Sheet
Enter the previous year’s numbers in the same format as the current year data. This enables year-over-year comparison on the Dashboard and Trend sheets, with PY vs Actual arrows highlighting improvements or declines.
Previous Year Number Input Sheet
6. KPI Definition Sheet
Enter KPI Name, KPI Group, Unit, Formula, KPI Definition, and KPI Type as LTB (Lower the Better) or UTB (Upper the Better). This sheet serves as the reference for the KPI Trend page and ensures consistent reporting across your team.
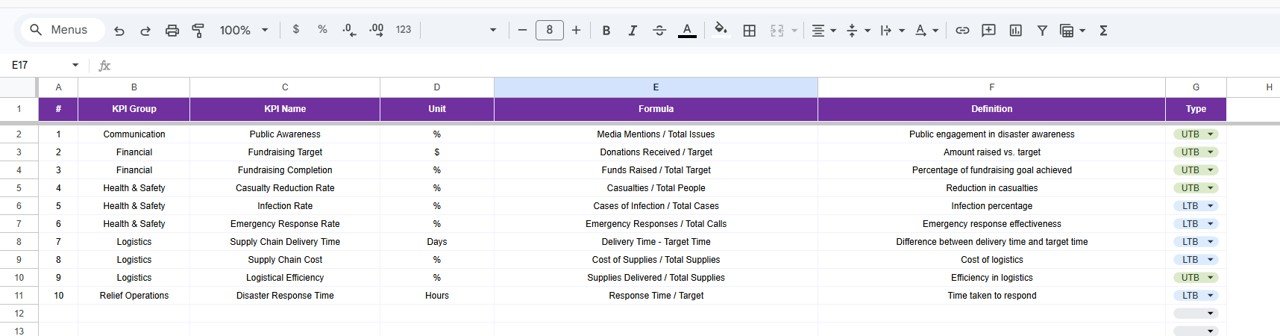
KPI Definition Sheet
Disaster Relief KPI Dashboard in Google Sheets vs. Microsoft Excel vs. Paid Disaster Management Software — Feature Comparison
| Feature | Disaster Relief KPI Dashboard in Google Sheets | Microsoft Excel Dashboard | Aidstream / ReliefWeb Analytics |
|---|---|---|---|
| Cost | $8.99 one-time | $14.99 one-time (NGT Excel version) | $50-200/user/month |
| Platform | Google Sheets (free, cloud) | Microsoft Excel (license needed) | Web-based SaaS |
| Setup Time | Under 10 minutes | Under 10 minutes | 2-4 weeks onboarding |
| Real-time Collaboration | ✅ Built-in | Limited (OneDrive needed) | ✅ Yes |
| Mobile Access | ✅ Any device with browser | Limited on mobile | ✅ Yes |
| Customizable KPIs | ✅ Fully editable | ✅ Fully editable | Limited to plan tier |
| Share with Link | ✅ One-click sharing | Requires OneDrive | ✅ Yes |
| Year-1 Cost at 5 Users | $8.99 total | $14.99 total | $3,000-12,000 |
| MTD/YTD Trend Charts | ✅ Built-in | ✅ Built-in | ✅ Yes |
For disaster relief teams that want structured KPI tracking without paying per-user SaaS fees, the Disaster Relief KPI Dashboard in Google Sheets sits in the sweet spot.
Who Should Use This Template
✅ Perfect for:
- NGO program managers tracking disaster response KPIs across field operations
- Government disaster relief coordinators monitoring response times and resource allocation
- Nonprofit organizations managing relief supplies distribution and beneficiary reach
- Small to mid-sized humanitarian organizations (10-500 staff) needing structured KPI tracking
- Emergency preparedness teams benchmarking performance against previous year data
❌ Not a fit if:
- You’re a large international agency needing real-time GIS mapping and satellite-integrated dashboards
- Your organization requires IATI/OCHA-compliant automated reporting pipelines
- You need multi-currency budgeting and automated donor reporting integrations
Real-World Use Cases
Click here to Purchase the Disaster Relief KPI Dashboard in Google Sheets
Maria manages disaster response for a regional Red Cross chapter. She uses the Disaster Relief KPI Dashboard in Google Sheets to track 15 KPIs including response time, shelter occupancy rate, and food distribution coverage. Each month, she selects the period from the dropdown and shares the live Google Sheet with her 8-person field team — no per-user license fees, no onboarding delays.
Ravi leads operations at a flood relief NGO in South Asia. With limited budget, his team tracks resource utilization, volunteer deployment rate, and medical response time using the KPI Definition and Trend sheets. The PY vs Actual arrows help him demonstrate year-over-year improvements in quarterly donor reports — a requirement for continued funding.
Elena coordinates FEMA-partnered disaster preparedness at a county government office. She customized the template with 12 KPIs aligned to federal reporting requirements. The separate Actual, Target, and PY input sheets make it easy for three department heads to contribute data simultaneously without overwriting each other’s entries.
Advantages of the Disaster Relief KPI Dashboard in Google Sheets
Cost savings: At $8.99 one-time with no per-user fees, this template saves $3,000-12,000 per year compared to SaaS disaster management platforms at 5 users.
Real-time collaboration: Google Sheets enables multiple team members to input data simultaneously from field locations, headquarters, or mobile devices — all changes sync instantly.
Year-over-year tracking: The dedicated Previous Year sheet and conditional formatting arrows make it straightforward to demonstrate improvement trends in donor reports and compliance reviews.
Full customization: Unlike SaaS platforms locked to predefined metrics, you can add, remove, or modify any KPI on the Definition sheet to match your specific disaster response framework.
No IT overhead: No installation, no server setup, no license management. Copy the template to Google Drive and start tracking within 10 minutes.
Opportunities for Improvement
Click here to Purchase the Disaster Relief KPI Dashboard in Google Sheets
The template does not include automated data import from external sources like field reporting apps or government databases — all data entry is manual. There is no built-in GIS mapping or geographic visualization of disaster zones. For organizations needing multi-language support or right-to-left script formatting, additional customization would be required. The template is optimized for monthly KPI tracking and may need structural adjustments for organizations tracking daily or weekly disaster response metrics.
Best Practices
Define KPIs before entering data: Start with the KPI Definition sheet. Clearly document each metric’s formula, unit, and type (LTB/UTB) to ensure consistent interpretation across your team.
Set the fiscal year first: On the Actual Numbers Input sheet, set cell E1 to your organization’s fiscal year starting month before entering any data.
Use the Trend sheet for donor reporting: The MTD and YTD trend charts with Actual vs Target vs PY comparisons are designed for inclusion in quarterly donor reports and compliance reviews.
Share with edit access for data contributors: Give data entry staff edit access to the three input sheets only. Keep the Dashboard and Trend sheets as view-only for leadership to prevent accidental formula changes.
Review monthly: Select each month from the Dashboard dropdown during monthly review meetings. Use the conditional formatting arrows to quickly identify KPIs that need attention.
Explore Relevant Templates
📊 Disaster Relief KPI Dashboard in Excel — Same KPI tracking structure in Microsoft Excel format for teams that prefer desktop-based analysis.
🚨 Emergency Management KPI Dashboard in Excel — Track emergency response times, resource utilization, communication efficiency, and incident resolution rates.
🌿 Grant Management KPI Dashboard in Google Sheets — Monitor grant utilization, compliance rates, and disbursement KPIs for nonprofit and government organizations.
🚚 Transportation Safety KPI Scorecard in Google Sheets — Track safety-related KPIs with a scorecard format including traffic light indicators.
🌍 ESG Environmental Dashboard in Google Sheets — Monitor environmental sustainability KPIs for ESG reporting.
Browse all Google Sheets Dashboard Templates on NextGenTemplates.
Frequently Asked Questions
Click here to Purchase the Disaster Relief KPI Dashboard in Google Sheets
What KPIs does the Disaster Relief KPI Dashboard in Google Sheets track?
The Disaster Relief KPI Dashboard in Google Sheets tracks any KPI you define — including response time, beneficiary reach, resource utilization, shelter occupancy, volunteer deployment rate, and more. All metrics are fully customizable via the KPI Definition sheet.
Can I change the fiscal year starting month?
Yes. On the Actual Numbers Input sheet, change the month on cell E1 to set your fiscal year start. All MTD and YTD calculations adjust accordingly across the Dashboard and Trend sheets.
How does this compare to paid disaster management software?
Paid platforms like Aidstream or ReliefWeb Analytics cost $50-200 per user per month. The Disaster Relief KPI Dashboard in Google Sheets costs $8.99 total with no per-user fees, real-time collaboration, and under 10 minutes setup time.
How long does setup take?
Setup takes under 10 minutes. Copy the template to Google Drive, enter your KPI definitions in the Definition sheet, input your actual and target data, and the dashboard works immediately with pre-built formulas and charts.
Can multiple team members edit at the same time?
Yes. Google Sheets supports real-time collaboration. Share the spreadsheet link with your team and multiple users can enter data simultaneously without version conflicts or merge issues.
Is the Excel version also available?
Yes. The Disaster Relief KPI Dashboard in Excel is available separately at $14.99 for teams that prefer Microsoft Excel.
Do I need Google Sheets formulas knowledge to use this?
No. All formulas, charts, and conditional formatting are pre-built in the template. You only need to replace the sample data with your own numbers in the three input sheets — Dashboard and Trend sheets update automatically.
About the Author
Built by PK — Microsoft Certified Professional with 15+ years of Excel, Google Sheets, and Power BI experience. Founder of NextGenTemplates, reaching 300K+ subscribers across YouTube channels. Every template is hand-built and tested before release.
Conclusion
The Disaster Relief KPI Dashboard in Google Sheets gives your disaster response team a structured, cloud-based KPI tracking system for $8.99 — replacing per-user SaaS subscriptions that cost thousands per year. With 6 organized sheets, trend charts, conditional formatting arrows, and full KPI customization, it’s ready to use in under 10 minutes.
Click here to Purchase the Disaster Relief KPI Dashboard in Google Sheets
✅ Instant download · One-time payment · No subscription
🎥 Visit our YouTube channel: YouTube.com/@NeoTechNavigators