Running a personal training business is a numbers game — revenue per trainer, sessions per month, average rating, calories burned, client retention rate — and tracking these in scattered notebooks or expensive booking software wastes both time and money. The Fitness Trainer Dashboard in Google Sheets consolidates 18 KPIs across 4 analysis pages plus a session lookup tool into one shareable spreadsheet that costs $9.99 once instead of $129-499 every month.
This guide walks you through every page of the dashboard, the KPIs and charts you get, who it works for, and how it compares against Excel, Power BI, and SaaS gym software like Mindbody and Trainerize. By the end you’ll know whether this template fits your studio or solo training business — and how to deploy it in under 10 minutes.
Key Features of the Fitness Trainer Dashboard in Google Sheets
👉 Click here to Purchase the Fitness Trainer Dashboard in Google Sheets
This dashboard is built natively in Google Sheets, which means real-time multi-user editing, free access via any browser, and a one-click mobile view through the Sheets app. It tracks 18 KPIs across Revenue, Sessions, Clients, and Trainers categories, with more than 20 pre-built charts that refresh automatically when you update the Data Sheet.
- 4 dedicated analysis pages — Overview, Sessions Analysis, Clients Analysis, and Trainers Analysis — plus a Search Sheet and a Data Sheet.
- Dropdown filters on every page for Trainer, Session Type, Workout Category, Client Status, and Membership Type — slice the entire dashboard in one click.
- Session lookup card — pick a Session ID and instantly see Date, Trainer, Client, Duration, Revenue, Calories Burned, and Rating without scrolling raw rows.
- Zero formulas to learn — the only thing you touch is the Data Sheet. All SUMIFS, COUNTIFS, FILTER, and QUERY functions are pre-wired.
- Shareable with one link — give your trainers view-only or edit access using standard Google Sheets sharing permissions.
Dashboard Pages Explanation
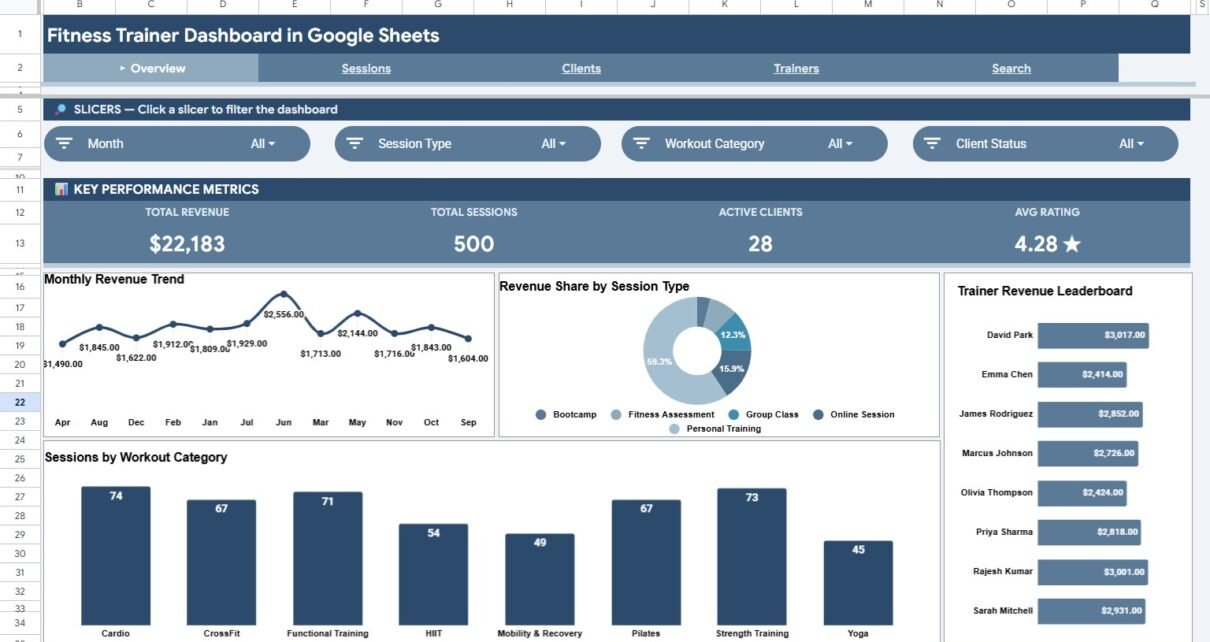
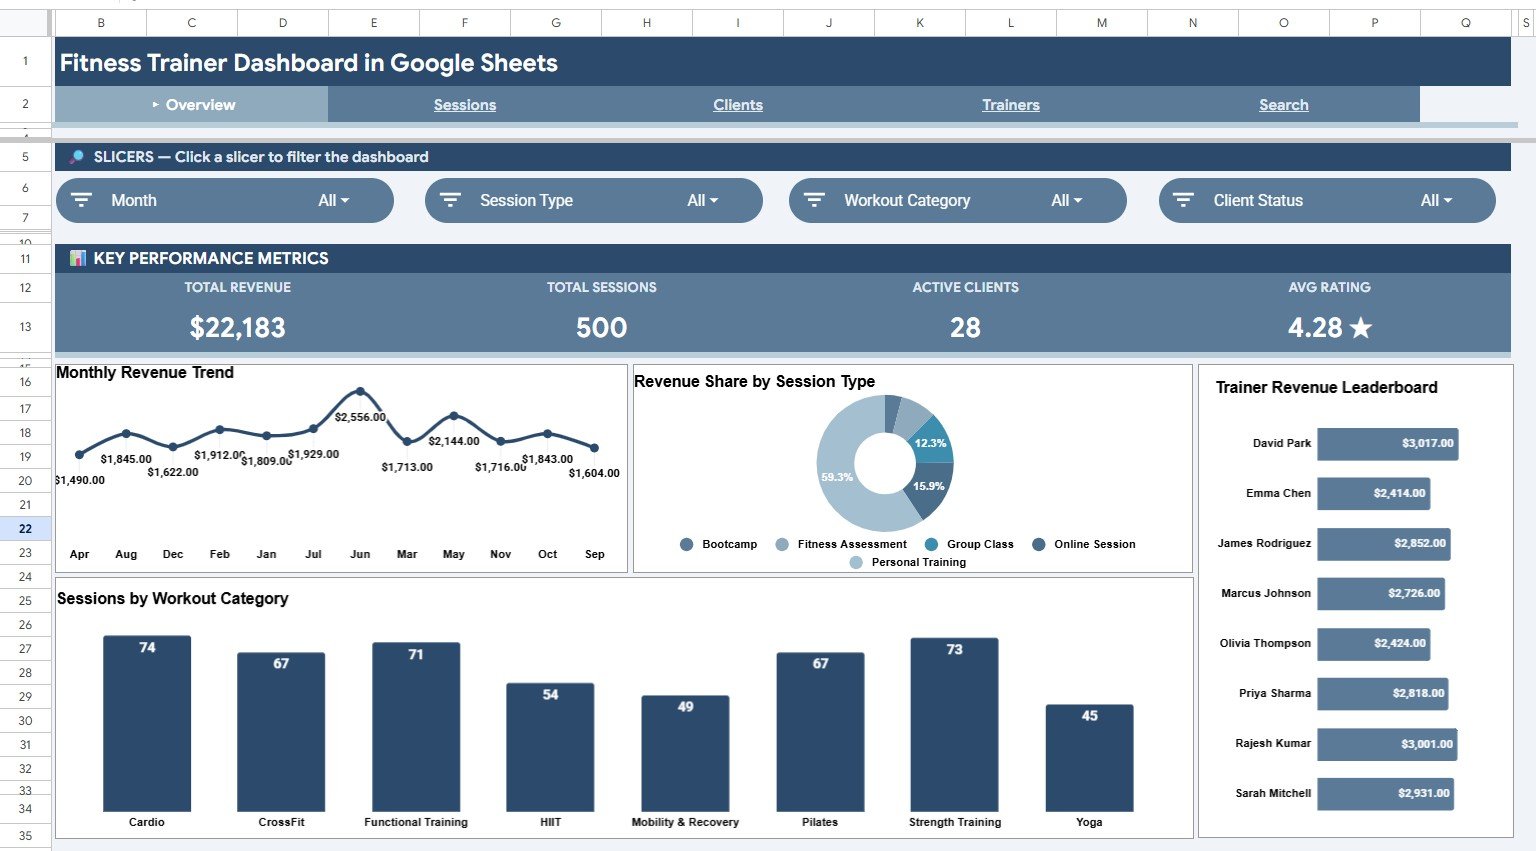
Page 1: Overview Dashboard
The Overview page is the high-level summary view. Four KPI cards at the top — Total Revenue, Total Sessions, Active Clients, and Average Rating — give an instant snapshot of business health. Below them, four charts: Monthly Revenue Trend by Month, Revenue Share by Session Type, Trainer Revenue by Trainer, and Sessions by Workout Category. Dropdown filters above the KPI cards let you slice every visualization on the page by trainer, session type, or workout category in a single click.
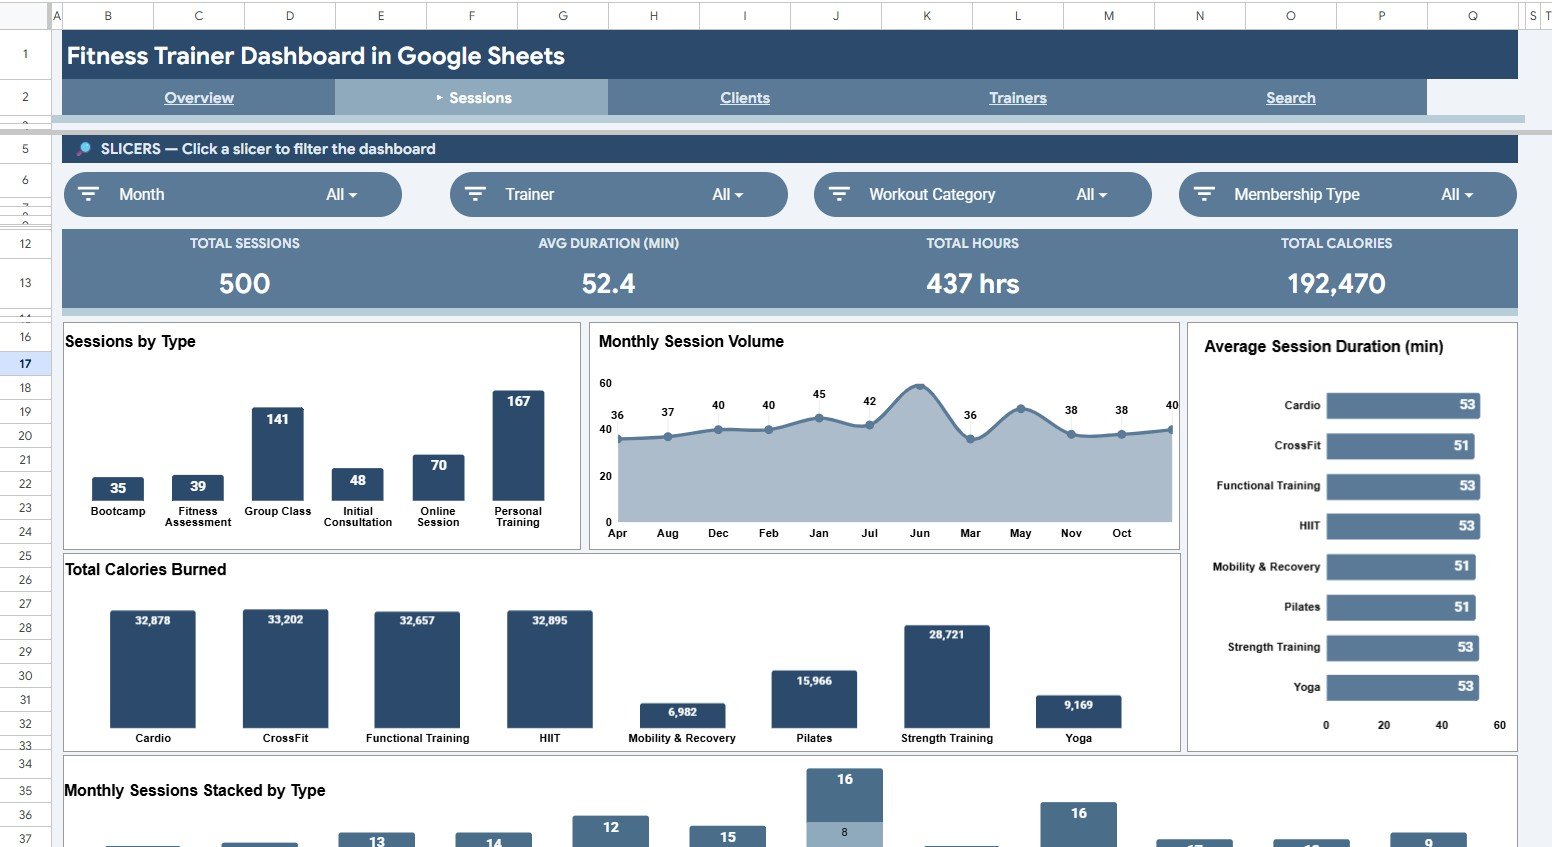
Page 2: Sessions Analysis
👉 Click here to Purchase the Fitness Trainer Dashboard in Google Sheets
The Sessions Analysis page focuses on the operational side of training delivery. KPI cards include Total Sessions, Average Duration in minutes, Total Hours, and Total Calories Burned. Charts: Sessions by Session Type, Monthly Session Volume by Month, Average Session Duration by Workout Category, Total Calories Burned by Workout Category, and Monthly Sessions Stacked by Session Type. Use this page to spot which formats fill the calendar and which deliver the heaviest training load per client.
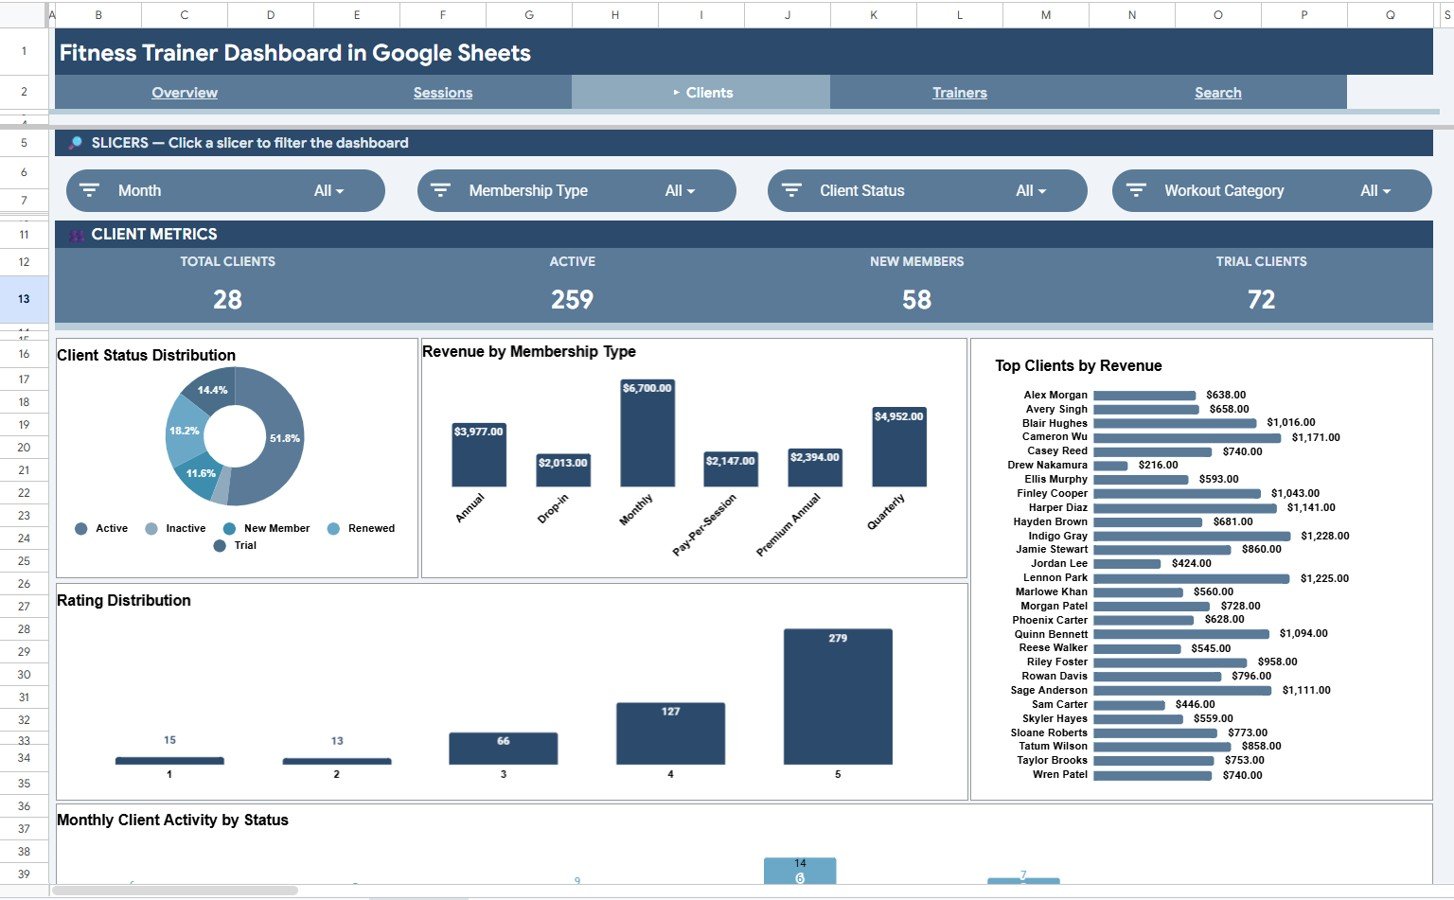
Page 3: Clients Analysis
The Clients Analysis page is built for retention and revenue concentration insights. KPI cards: Total Clients, Active Clients, New Members, and Trial Clients. Charts: Client Status Distribution by Status, Revenue by Membership Type, Top Clients by Revenue, Rating Distribution by Rating, and Monthly Client Activity by Status. Use it to spot churn risks before they cancel, find the top 20% of clients driving 80% of revenue, and surface low-rating sessions early.
Page 4: Trainers Analysis
👉 Click here to Purchase the Fitness Trainer Dashboard in Google Sheets
The Trainers Analysis page is where you run performance reviews and commission calculations. KPI cards include Total Trainers, Total Revenue, Average Revenue per Trainer, and Top Rating. Charts: Total Revenue by Trainer, Sessions per Trainer, Average Rating by Trainer, Revenue by Trainer and Session Type, and Monthly Revenue Stacked by Trainer. This is the most-requested view from gym owners who need defensible data when discussing pay tiers.

Page 5: Search Sheet
The Search Sheet is a session lookup tool. Type or pick any Session ID from the dropdown and you immediately see Session ID, Date, Trainer, Client, Session Type, Workout Category, Duration in minutes, Revenue, Calories Burned, Client Status, Membership Type, and Rating displayed on a single readable card — without scrolling through the raw data table.

Page 6: Data Sheet
👉 Click here to Purchase the Fitness Trainer Dashboard in Google Sheets
The Data Sheet is the master log. Replace the sample rows with your own session data, keeping the column order: Session ID, Date, Trainer, Client, Session Type, Workout Category, Duration, Revenue, Calories Burned, Client Status, Membership Type, Rating. Every chart and KPI across the dashboard recalculates automatically — no formulas to copy down, no chart ranges to fix.

Fitness Trainer Dashboard vs. Excel Dashboard vs. Paid Gym SaaS — Feature Comparison
| Feature | Fitness Trainer Dashboard (Google Sheets) | Excel Dashboard | Mindbody / Trainerize |
|---|---|---|---|
| Cost | $9.99 one-time | $15-25 one-time | $129-499 / month |
| Platform | Cloud-native Google Sheets | Desktop Excel (Windows / Mac) | Vendor-hosted web + app |
| Setup time | Under 10 minutes | 10-15 minutes | 2-4 weeks onboarding |
| Real-time team collaboration | ✅ Built-in, multi-user editing | ❌ Requires OneDrive / SharePoint | ✅ |
| Mobile access | ✅ Sheets app | ⚠️ Mostly read-only | ✅ Native apps |
| Customizable KPIs and charts | ✅ Full control | ✅ | ❌ Vendor-defined only |
| Year-1 cost at 5 users | $9.99 total | $15-25 total | $7,740 – $29,940 |
| Data ownership | ✅ Your Google Drive | ✅ Your computer | ❌ Vendor-hosted |
| Per-user fees | ✅ None | ✅ None | ❌ $30-70 per trainer / month |
For independent trainers and small studios that want professional revenue and session analytics without paying $129+ per month for booking-software dashboards, the Fitness Trainer Dashboard in Google Sheets sits in the sweet spot.
Who Should Use This Template
👉 Click here to Purchase the Fitness Trainer Dashboard in Google Sheets
Perfect for:
- Independent personal trainers running 20-200 sessions per month with 10-80 active clients.
- Boutique fitness studios and CrossFit gyms with 2-10 trainers needing a single shared revenue view.
- Online fitness coaches running 1-on-1 and group sessions over Zoom who want to monitor revenue mix and client ratings.
- Gym owners who already use Mindbody, Trainerize, or Glofox for bookings but want a custom revenue and trainer-performance layer they fully control.
Not a fit if:
- You run a large multi-location gym chain that needs automated POS integration, payment processing, and live class booking.
- You need SMS reminders, automatic billing, or wearables sync — this is a reporting dashboard, not a booking platform.
- You require granular role-based permissions. Google Sheets sharing is at sheet or file level, not row level.
Real-World Use Cases
Maya runs a boutique strength studio in Austin with 4 trainers and 90 active clients. Before the dashboard, she emailed Excel sheets back and forth and lost track of who closed how many sessions in any given month. Now she tracks monthly revenue per trainer in the Trainers Analysis page, uses Sessions per Trainer to set commission tiers, and shares a view-only link with her team so everyone sees the same numbers. The studio saved $716 per month previously spent on Trainerize Pro for analytics they didn’t fully use.
Jordan is a freelance online coach with 35 clients across three time zones. He logs every Zoom session in the Data Sheet, checks the Clients Analysis page weekly for ratings below 4.0 stars, and reaches out before clients churn. The Rating Distribution chart catches issues two full weeks earlier than the monthly Calendly review process he used before, which has bumped his renewal rate from 64% to 81%.
Sarah is the operations lead at a 3-location CrossFit franchise. She uses the Sessions Analysis page to compare Total Calories Burned by Workout Category across locations. When the data showed Strength sessions consistently burning fewer calories but holding higher ratings than HIIT classes, she added two extra Strength slots to the weekly schedule — and member feedback scores rose 12% the following quarter.
Advantages of the Fitness Trainer Dashboard in Google Sheets
- Massive cost savings. $9.99 once versus $129-499 monthly for SaaS gym software — payback in less than one billing cycle.
- Zero learning curve. If you can paste rows into a spreadsheet, you can run the entire dashboard. No SQL, no DAX, no Apps Script required.
- Real-time team collaboration. Unlike Excel, Google Sheets lets multiple trainers update the Data Sheet simultaneously without overwriting each other.
- Mobile-friendly. Check today’s revenue or a client’s rating from your phone in the free Google Sheets app on iOS or Android.
- You own the data. Everything lives in your Google Drive — no vendor lock-in, no migration headaches if you switch tools later.
- Fully customizable. Want to add a new KPI? Insert a column in the Data Sheet and a SUMIFS formula. Try doing that in Mindbody.
Opportunities for Improvement
👉 Click here to Purchase the Fitness Trainer Dashboard in Google Sheets
Being honest about limitations builds trust — the Fitness Trainer Dashboard isn’t a fit for every scenario. It’s a reporting dashboard, not a booking platform, so you’ll still need a tool like Calendly, Acuity, or Mindbody for client-facing scheduling. Data entry is manual — there’s no automatic import from POS systems, wearables, or payment processors. For studios above 10 trainers and 500+ sessions per month, native Google Sheets performance starts to slow; that scale typically benefits from a Power BI version or a custom BI build. Finally, role-based row-level security is not possible — anyone with edit access can see all data.
Best Practices
- Lock the formula cells. Protect the KPI and chart ranges in each analysis page so trainers can’t accidentally overwrite a formula. Use Data → Protected sheets and ranges.
- Use a consistent Session ID format. Something like
2026-001,2026-002keeps sorting and lookup smooth. - Update the Data Sheet weekly, not monthly. Weekly cadence catches churn signals (rating drops, missed sessions) early.
- Use Color Rules on the Rating column to red-flag any session rated below 4.0 stars. Conditional Formatting → Cell value less than 4.
- Make a duplicate copy quarterly. Snapshot your data at quarter-end for compliance and historical comparisons.
- Connect Google Sheets to Looker Studio for free if you want public-facing client report cards or trainer-specific landing pages.
Explore Relevant Templates
If the Fitness Trainer Dashboard works for you, these complementary templates from NextGenTemplates extend the toolkit:
- Fitness Performance and Revenue Dashboard in Google Sheets — broader revenue-focused fitness reporting in the same platform.
- Gym Retention Dashboard in Google Sheets — laser-focused on churn, retention, and member lifecycle.
- Yoga & Wellness Studio Dashboard in Excel — fitness category, Excel-first studio operators.
- Gym Retention Dashboard in Excel — Excel-platform alternative to this dashboard.
- Gym Retention Dashboard in Power BI — Power BI version for scale-up studios.
Also see the broader fitness dashboards tutorial on NeoTechNavigators and the gym retention dashboard walkthrough.
Frequently Asked Questions
👉 Click here to Purchase the Fitness Trainer Dashboard in Google Sheets
What KPIs does the Fitness Trainer Dashboard in Google Sheets track?
The Fitness Trainer Dashboard in Google Sheets tracks 18 KPIs across four areas: revenue (Total Revenue, Average Revenue per Trainer), sessions (Total Sessions, Average Duration, Total Hours, Total Calories Burned), clients (Total Clients, Active Clients, New Members, Trial Clients), and trainers (Total Trainers, Top Rating, Average Rating). Every KPI updates automatically when you edit the Data Sheet.
How does the Fitness Trainer Dashboard compare to Mindbody or Trainerize?
Mindbody and Trainerize charge $129-499 per month and bundle booking, payments, and reporting into one platform. The Fitness Trainer Dashboard in Google Sheets is a one-time $9.99 reporting layer — perfect if you already have a booking tool but want custom revenue, trainer, and client analytics you fully own.
How long does setup take?
Setup takes under 10 minutes for most users. Open the PDF guide included with your download, click the Google Sheets copy link to make your own editable copy in Google Drive, paste your session data into the Data Sheet in the existing column order, and the entire Fitness Trainer Dashboard recalculates automatically.
Can multiple trainers edit the dashboard at the same time?
Yes. The Fitness Trainer Dashboard runs natively in Google Sheets, which supports real-time multi-user editing. Trainers can update the Data Sheet simultaneously without overwriting each other. Use Google Sheets sharing permissions to control who has view-only versus edit access.
Does the Fitness Trainer Dashboard work on mobile devices?
Yes. The Fitness Trainer Dashboard opens correctly in the free Google Sheets mobile app on both iOS and Android. KPI cards and charts display well on phone and tablet screens, though we recommend editing the Data Sheet on a laptop for the best experience.
Is my client data private and secure?
Yes. The Fitness Trainer Dashboard file lives entirely in your own Google Drive — NextGenTemplates never sees your client data. You control all sharing through standard Google Drive permissions and can revoke any user’s access at any time.
Can I add my own KPIs and charts to the dashboard?
Absolutely. The Fitness Trainer Dashboard is fully unlocked. Add a column to the Data Sheet, write a SUMIFS or COUNTIFS formula on any analysis page, and insert a new chart. Because everything is native Google Sheets — no add-ons, no scripts — your customizations stay with you forever.
About the Author
Built by PK — Microsoft Certified Professional with 15+ years of Excel, Google Sheets, and Power BI experience. Founder of NextGenTemplates, reaching 300K+ subscribers across YouTube channels (@PK-AnExcelExpert, @NextGenTemplates, @NeoTechNavigators). Every template is hand-built and tested before release.
Conclusion
The Fitness Trainer Dashboard in Google Sheets pays for itself the moment you cancel an unused $129-per-month SaaS plan you’re keeping just for the reporting features. With 18 KPIs, 20+ pre-built charts, dropdown filters, and a session lookup tool — all running natively in Google Sheets with multi-user editing — it gives independent trainers and small studios professional-grade analytics without the per-user fees.
👉 Click here to Purchase the Fitness Trainer Dashboard in Google Sheets
✅ Instant Google Sheets copy · One-time payment · No subscription · No per-user fees · Lifetime access
🎥 Visit our YouTube channel for step-by-step video tutorials: YouTube.com/@NeoTechNavigators
📅 Last updated: May 2026