Lead Nurturing KPI Dashboard in Google Sheets is a ready-to-use KPI dashboard template for sales and marketing teams that want a clear monthly view of lead follow-up, lead quality, funnel progress, and conversion performance. Lead nurturing usually touches email campaigns, sales calls, CRM updates, demo requests, and multiple follow-up stages. Without a structured reporting system, it is easy to miss the signals that show whether leads are moving closer to a sales conversation or becoming inactive.Lead Nurturing KPI Dashboard in Google Sheets
In this article we have created Lead Nurturing KPI Dashboard in Google Sheets. This is a ready to use template in Google Sheets. The dashboard includes 6 worksheet tabs, MTD and YTD tracking, Actual vs Target comparison, Previous Year comparison, trend charts, KPI definitions, and input sheets for monthly performance data. You can also view the Lead Nurturing KPI Dashboard in Google Sheets product page on NextGenTemplates.
According to many CRM and marketing operations teams, the biggest reporting challenge is not a lack of data. The challenge is turning lead activity data into a simple, repeatable view that managers can review every month. This template helps solve that problem by bringing the key lead nurturing KPIs into a Google Sheets dashboard that is easy to update, share, and customizeLead Nurturing KPI Dashboard in Google Sheets
Key Features of This KPI Dashboard
Below are the key features of this KPI Dashboard:
- Google Sheets ready template: The dashboard works directly in Google Sheets, so your team can copy the file, update inputs, and collaborate online.
- 6 worksheet structure: The workbook includes Dashboard, KPI Trend, Actual Numbers Input, Target Number Input, Previous Year Number Input, and KPI Definition sheets.
- MTD and YTD KPI tracking: Monitor Month-to-Date and Year-to-Date performance for every lead nurturing KPI.
- Actual vs Target analysis: Compare actual results with monthly and yearly targets to see whether your nurturing process is on track.
- Previous Year comparison: Compare current performance with the same period from the previous year.
- Conditional formatting arrows: Up and down indicators make performance gaps easier to scan.
- KPI trend charts: View Actual, Target, and Previous Year trends for selected KPIs.
- Editable KPI definitions: Customize KPI names, groups, units, formulas, definitions, and KPI type.
- Flexible KPI type setting: Mark KPIs as LTB, Lower the Better, or UTB, Upper the Better.
- Reusable reporting structure: Use the same format every month for management reviews, campaign reviews, and sales funnel analysis.Lead Nurturing KPI Dashboard in Google Sheets
Dashboard Pages Explanation
1. Dashboard Sheet Tab
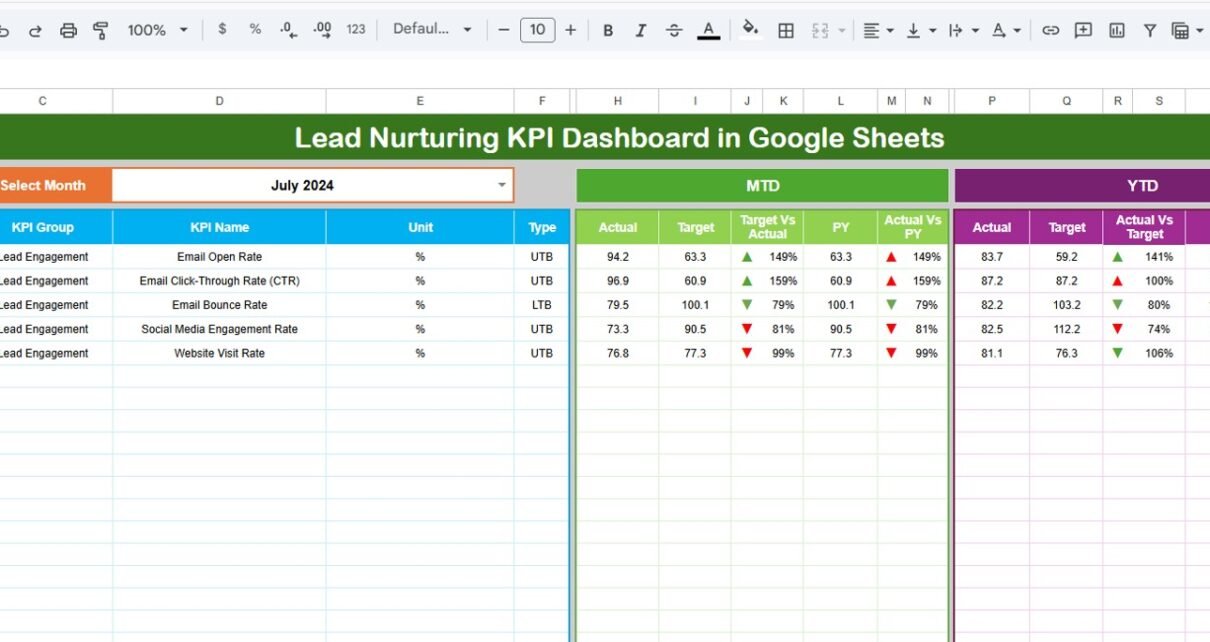
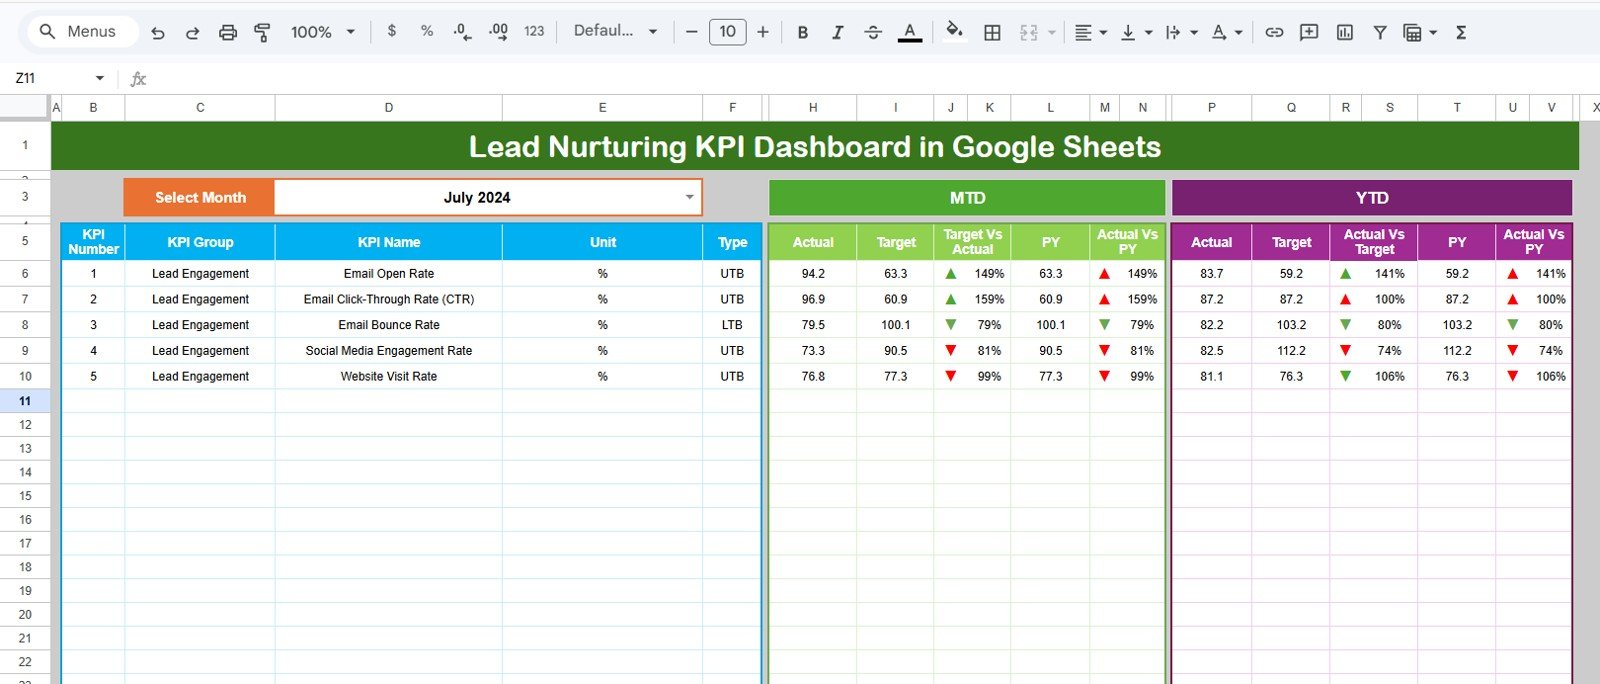
This is the main sheet tab. Here, we are showing all information about all of the KPIs. On range D3, you can select the Month from the drop-down. Whole dashboard numbers will be changed for that month.Lead Nurturing KPI Dashboard in Google Sheets
Here, we are showing the MTD Actual, Target, Previous Year data along with the Target Vs Actual and PY vs Actual with Conditional formatting up down arrow. We are also showing YTD Actual, Target, Previous Year data along with the Target Vs Actual and PY vs Actual with Conditional formatting up down arrow.
This sheet is designed for quick performance review. Sales leaders, marketing managers, and CRM owners can use it to understand whether lead nurturing activity is improving pipeline quality. For example, you can track KPIs such as qualified lead rate, follow-up completion, email engagement, demo conversion, nurture-to-opportunity rate, and inactive lead percentage.
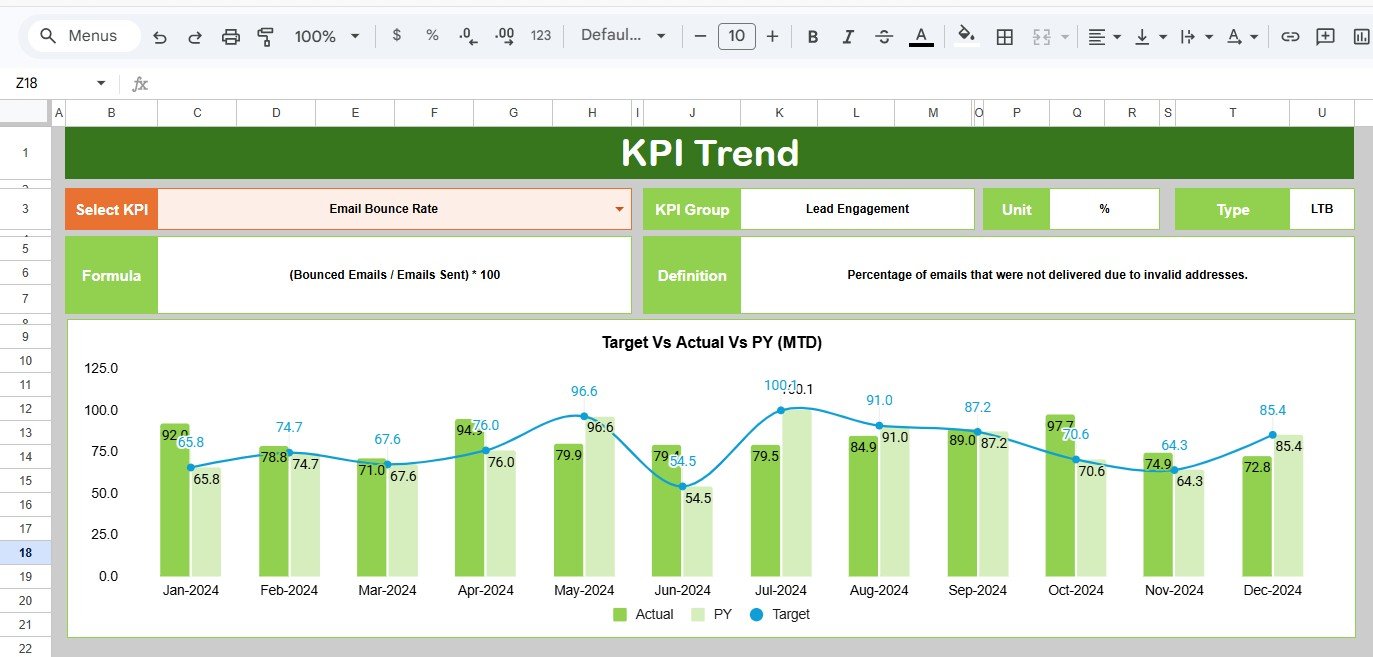
2. KPI Trend Sheet Tab
Here you can select the KPI name from the drop down available on range C3. We have displayed the KPI Group, Unit of KPI, Type of KPI, Formula of the KPI and Definition of the KPI.
We are also showing the MTD and YTD trend chart for Actual, Target and PY numbers. This makes the KPI Trend sheet useful for deeper analysis when one metric needs more attention. Instead of only seeing whether a KPI is above or below target for one month, you can see whether the trend is improving, declining, or staying flat over time.
For lead nurturing, trend visibility is important because short-term activity can be misleading. A one-month spike in lead response rate may look positive, but a trend chart can show whether the improvement is consistent across multiple months.
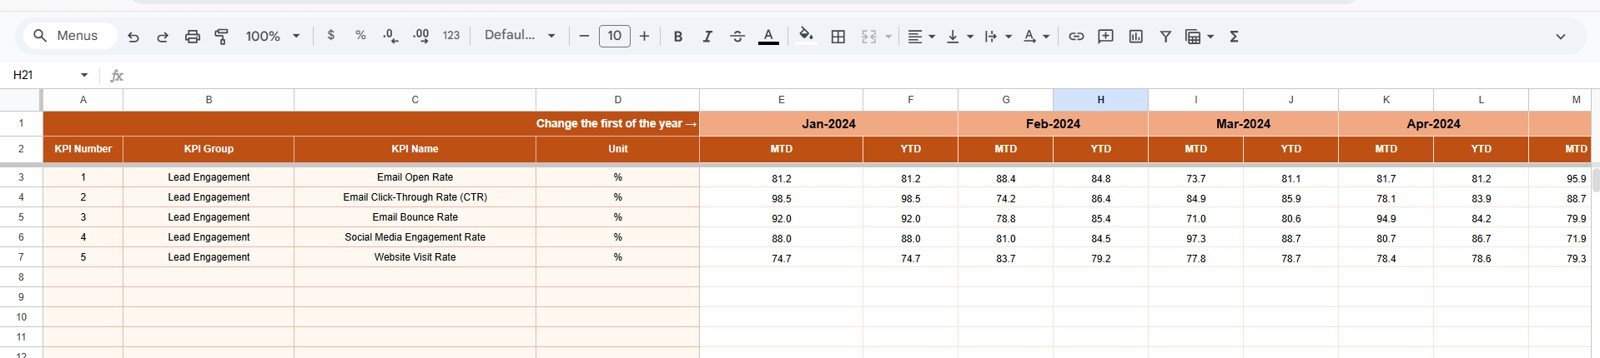
3. Actual Numbers Input Sheet
Here you have to enter the actual numbers for YTD and MTD for a particular month. You can change the months from range E1. Just input the first month of the Year on range E1.
This sheet is where your monthly performance data is entered. It keeps the dashboard clean because users do not need to edit formulas or charts on the visual dashboard tabs. You can update actual numbers from your CRM, sales reports, email marketing platform, or campaign performance exports.
Typical actual values may include the number of new leads, contacted leads, nurtured leads, marketing qualified leads, sales qualified leads, demo requests, follow-up completed leads, email opens, link clicks, and converted opportunities.
4. Target Number Input Sheet
In this sheet tab, you have to enter the Target numbers for each KPI for the particular month as MTD as well as YTD.Lead Nurturing KPI Dashboard in Google Sheets
Targets are essential because they turn raw performance numbers into management insight. If the team generated 500 nurtured leads, that number only becomes meaningful when compared with the monthly and yearly goal. The Target Number Input sheet lets you maintain those goals in a structured way.
Use this sheet to define targets for lead response time, nurture email engagement, conversion rate, lead qualification rate, opportunity creation, follow-up completion, and other sales funnel metrics. Once targets are entered, the dashboard automatically compares Actual vs Target and highlights performance direction.Lead Nurturing KPI Dashboard in Google Sheets
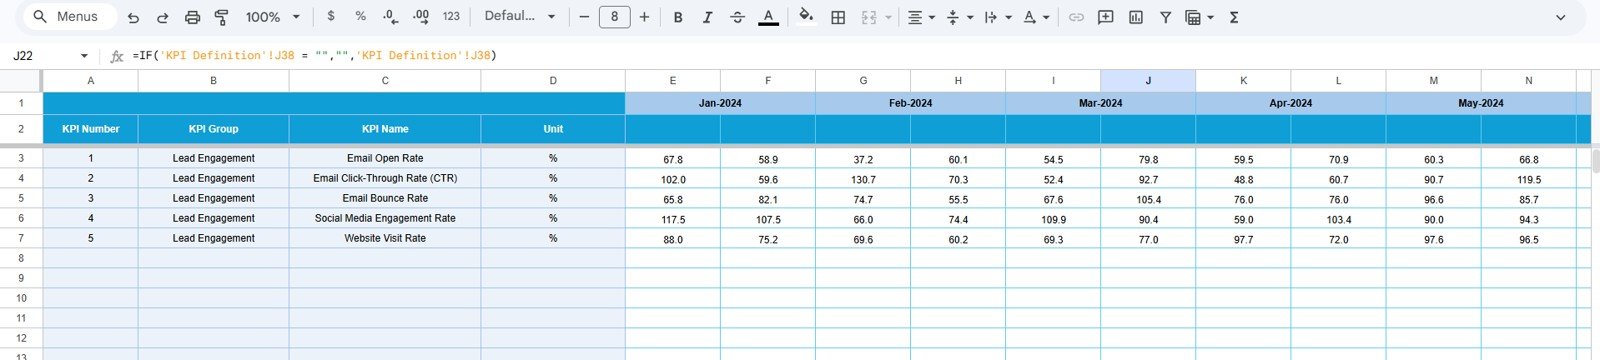
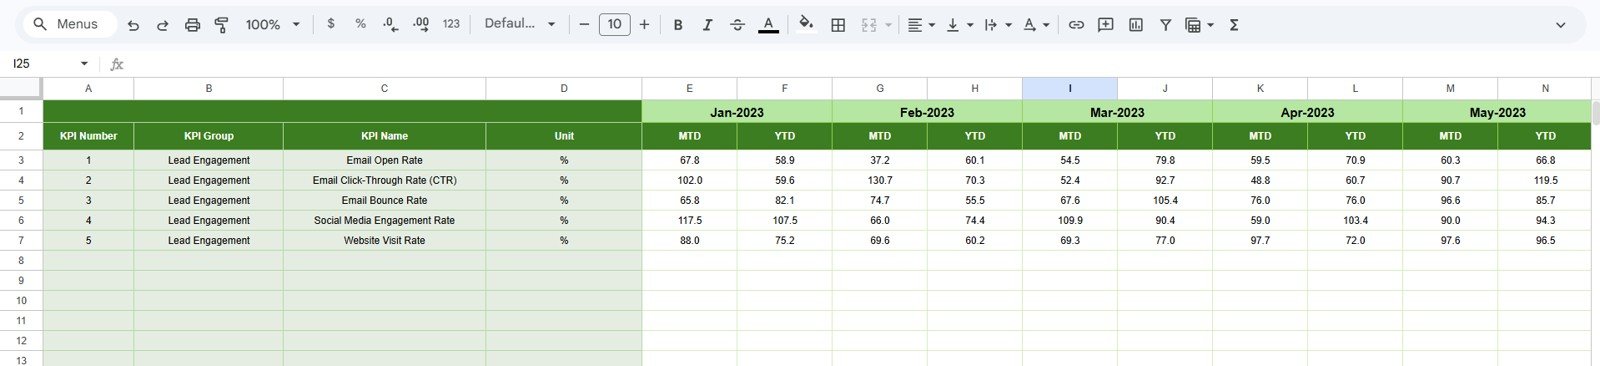
5. Previous Year Number Sheet Tab
Enter the here the numbers for the previous year same as you have entered for the current year.
Previous Year data helps teams understand whether current lead nurturing performance is improving over time. This is especially useful for seasonal marketing campaigns, annual sales cycles, and long nurturing journeys where month-to-month performance can vary.
For example, if your current nurture-to-opportunity conversion rate is below target but above the previous year, the business may still be improving. If it is below both target and previous year, the team may need to review lead quality, follow-up process, messaging, or sales handoff timing.
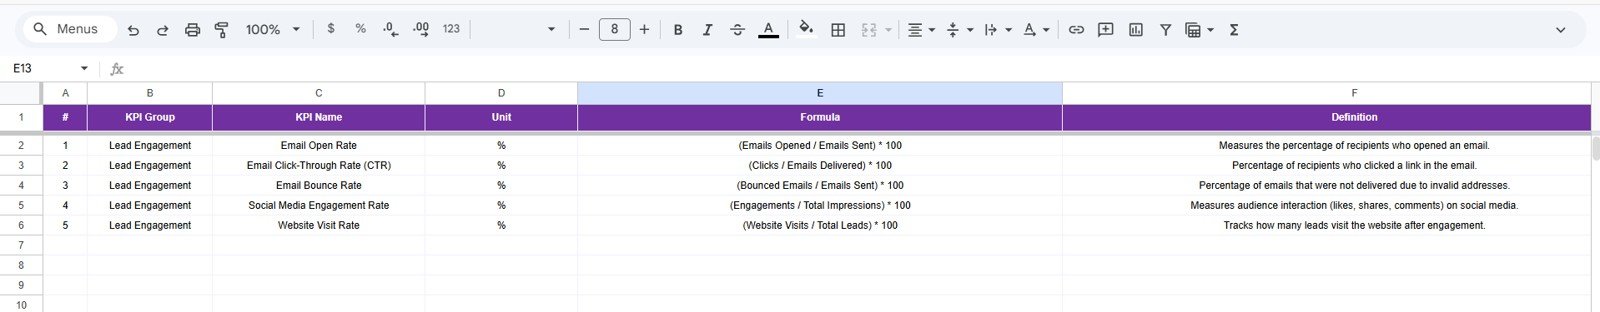
6. KPI Definition Sheet Tab
In this sheet tab, you have to enter the KPI Name, KPI Group, Unit, Formula and KPI definition. In the last column Enter the KPI type as LTB, Lower the better, or UTB, Upper the Better.Lead Nurturing KPI Dashboard in Google Sheets
The KPI Definition sheet makes the dashboard flexible. Every company has a slightly different lead nurturing process, so the metrics should be editable. You can define KPIs for email nurturing, CRM follow-up, sales qualification, lead scoring, funnel velocity, pipeline creation, and campaign engagement.Lead Nurturing KPI Dashboard in Google Sheets
The KPI type setting is especially useful for correct performance interpretation. For example, a higher lead conversion rate is better, so it should be marked UTB. A lower lead response time or inactive lead percentage is better, so it should be marked LTB.Lead Nurturing KPI Dashboard in Google Sheets
Lead Nurturing Dashboard vs Manual Reporting
Manual reporting often depends on copying numbers from multiple tools into presentation slides or scattered spreadsheets. That approach can work for a small team, but it becomes difficult as the number of campaigns, lead sources, and KPIs grows.
| Reporting Area | Manual Reporting | This Google Sheets KPI Dashboard |
|---|---|---|
| Monthly KPI Review | Often rebuilt from scratch | Reusable monthly dashboard format |
| Target Tracking | May be tracked separately | Built-in Actual vs Target comparison |
| Historical Comparison | Requires extra lookup work | Built-in Previous Year comparison |
| Trend Analysis | Usually manual charts | MTD and YTD trend charts by KPI |
| KPI Definitions | Often undocumented | Editable KPI definition sheet included |
| Sharing | Email attachments or static exports | Collaborative Google Sheets file |
If your team already uses Google Workspace, you can manage access through Google Sheets sharing settings. For more information, see Google’s documentation on Google Sheets sharing permissions.
Who Should Use This Dashboard?
- Marketing managers who want to track nurture campaign performance and lead engagement.
- Sales managers who need visibility into qualified leads, follow-up completion, and opportunity movement.
- CRM administrators who want a reporting structure outside the CRM for executive review.
- Revenue operations teams who monitor funnel performance and sales-marketing alignment.
- Small businesses that need a practical lead tracking dashboard without building a BI system.
- Consultants and agencies who report lead nurturing performance to clients.
Real-World Use Cases
This Google Sheets Lead Nurturing Dashboard can be used in many sales and marketing workflows:
- Monthly marketing performance reviews
- Sales funnel KPI tracking
- Lead follow-up monitoring
- Email nurturing performance reporting
- Campaign-to-opportunity conversion analysis
- CRM data review meetings
- Agency client reporting
- Executive dashboard summaries
- Sales and marketing alignment meetings
For example, a B2B team can use the dashboard to compare monthly marketing qualified leads, sales qualified leads, demo requests, and opportunity conversion against targets. If the MTD numbers are below target, the team can quickly review whether the problem is lead volume, lead quality, follow-up completion, or conversion rate.
Advantages of Using a Google Sheets KPI Dashboard
A Google Sheets KPI dashboard is practical because it is familiar, collaborative, and easy to customize. Teams do not need to install software or learn a complicated reporting platform. They can update monthly input sheets, review charts, and share the dashboard with stakeholders.
- Fast setup: Start with a ready-made dashboard structure instead of building from zero.
- Editable format: Change KPI names, groups, units, formulas, and definitions as your process evolves.
- Cloud collaboration: Work with team members inside Google Drive.
- Low cost: Use a one-time template instead of expensive dashboard software for simple KPI tracking.
- Consistent reporting: Review lead nurturing metrics in the same format every month.
Opportunities This Dashboard Can Reveal
Good lead nurturing reporting does more than show numbers. It helps teams find operational opportunities. With this dashboard, you may identify:
- Lead sources that produce strong initial interest but weak conversion.
- Campaigns that generate leads but do not move them into sales conversations.
- Follow-up delays that reduce lead engagement.
- KPIs that consistently miss target and need process improvement.
- Months where current performance is better than target but still below the previous year.
- Lead nurturing stages that need stronger content, automation, or sales handoff rules.
Best Practices for Using This Template
- Update inputs monthly: Enter Actual, Target, and Previous Year values on a fixed monthly schedule.
- Agree on KPI definitions: Use the KPI Definition sheet so everyone understands each metric the same way.
- Use consistent data sources: Pull numbers from the same CRM or marketing system each month to avoid reporting drift.
- Review both MTD and YTD: MTD shows current month performance, while YTD shows the broader annual trend.
- Investigate performance gaps: Use the trend sheet to understand why a KPI is above or below target.
- Limit the KPI list: Focus on the lead nurturing KPIs that actually influence pipeline quality and revenue outcomes.
Explore Relevant Templates
If you want to compare formats or build a wider sales and marketing reporting system, you may also like these related templates:
- Lead Nurturing KPI Dashboard in Excel
- Lead Nurturing KPI Dashboard in Power BI
- CRM KPI Dashboard in Google Sheets
- Sales Funnel KPI Dashboard in Power BI
You can get the complete Lead Nurturing KPI Dashboard in Google Sheets from NextGenTemplates.
Frequently Asked Questions
Is this Lead Nurturing KPI Dashboard ready to use?
Yes. It is a ready-to-use Google Sheets template. After creating your own copy, you can update the input sheets and start tracking your KPIs.
Can I customize the KPIs?
Yes. The KPI Definition sheet allows you to edit KPI names, KPI groups, units, formulas, definitions, and KPI type.
Does the dashboard include MTD and YTD tracking?
Yes. The dashboard includes both Month-to-Date and Year-to-Date tracking for Actual, Target, and Previous Year values.
Can I use this for sales and marketing reporting?
Yes. The dashboard is designed for lead nurturing, sales funnel, marketing performance, and CRM reporting use cases.
Do I need advanced Google Sheets knowledge?
No. The template is structured so you can mainly update input sheets and review the dashboard outputs. Basic Google Sheets knowledge is helpful for customization.
About the Author
NeoTechNavigators creates practical tutorials, templates, and automation resources for Google Sheets, Excel, dashboards, and business reporting. Our goal is to help professionals save time, improve reporting consistency, and build better data workflows without unnecessary complexity.
Conclusion
The Lead Nurturing KPI Dashboard in Google Sheets gives sales and marketing teams a clean way to track lead nurturing performance across monthly actuals, targets, previous year results, trend charts, and KPI definitions. With 6 worksheet tabs and a ready-made dashboard structure, it can help teams standardize their reporting and review lead nurturing performance with more confidence.
To use the template, visit the Lead Nurturing KPI Dashboard in Google Sheets product page.
For more dashboard tutorials and Google Sheets resources, visit the NeoTechNavigators YouTube channel.