The Property Portfolio Dashboard in Google Sheets tracks 4 headline KPIs across 6 interactive pages, renders 15 formula-driven charts, and includes a Property ID record lookup — all for a one-time $9.99 instead of the $50–$300 per month that property SaaS platforms charge. Setup takes under 10 minutes: replace the sample rows in the Data Sheet and every card, chart, and slicer recalculates on its own.
If you manage rental units in scattered spreadsheets, rent, occupancy, and maintenance numbers rarely line up in one place. This Property Portfolio Dashboard in Google Sheets pulls them into a single shareable file so landlords, property managers, and investors can see portfolio health at a glance and drill into any property in two clicks.
Key Features of the Property Portfolio Dashboard in Google Sheets
Click here to purchase the Property Portfolio Dashboard in Google Sheets.
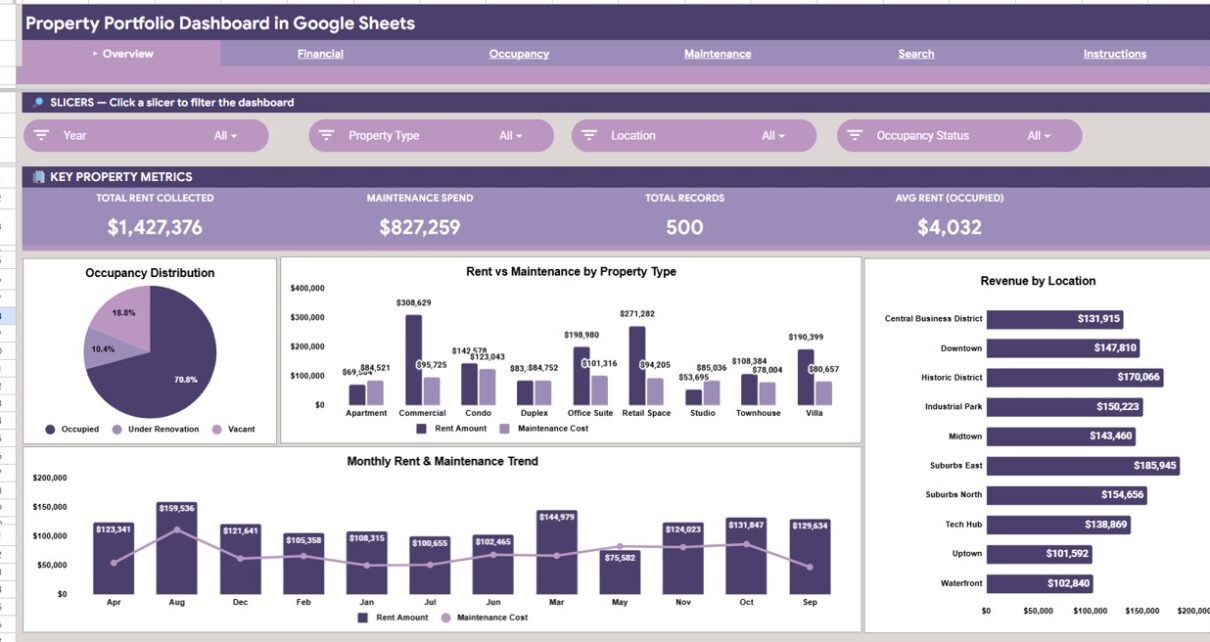
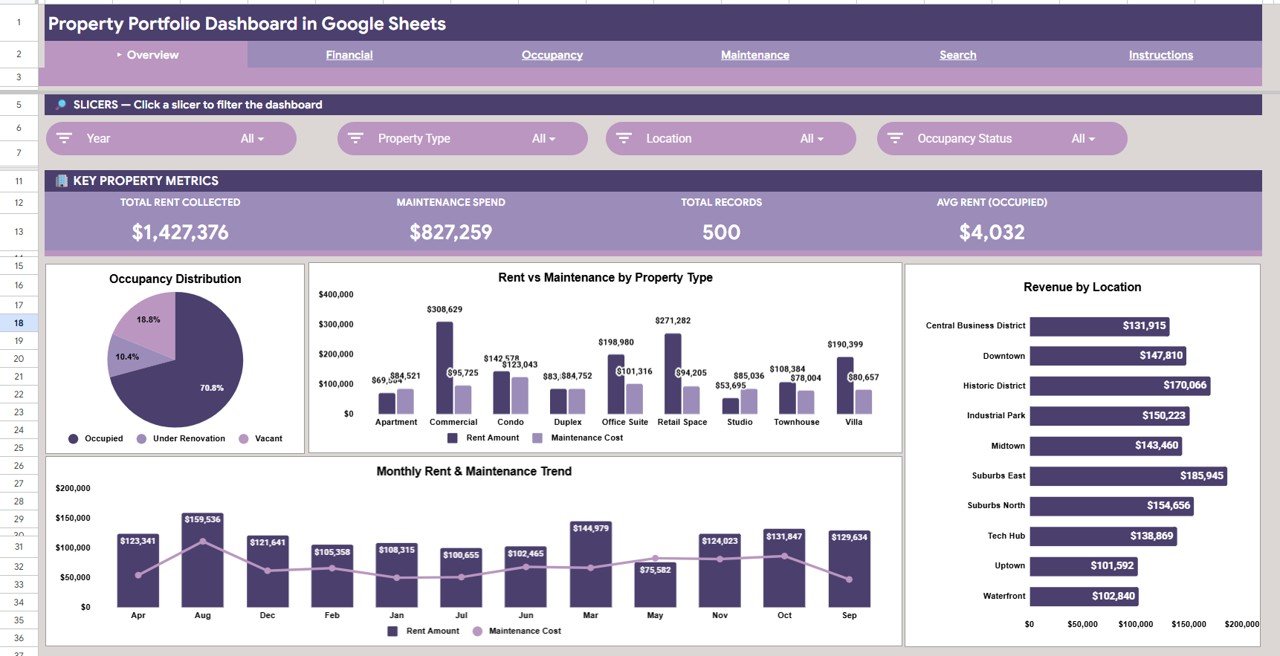
The dashboard puts four headline KPI cards — Total Rent Collected, Maintenance Spend, Total Records, and Avg Rent (Occupied) — at the top of the Overview page so the most important portfolio numbers are visible the moment the file opens.
Across the Overview, Financial, Occupancy, and Maintenance pages it renders 15 pre-built charts, every one formula-driven and tied to the Data Sheet. Multiple slicers let you filter the whole report by property type, location, or occupancy status without rebuilding anything.
- 4 KPI cards covering income, repair burden, record count, and rent efficiency
- 15 charts spanning financial, occupancy, and maintenance views
- Property ID lookup on a dedicated Search Sheet
- Native Google Sheets — no add-ons, macros, or monthly fees
Dashboard Pages Explanation
Page 1: Overview
The Overview page combines the 4 KPI cards with charts for Occupancy by Status, Rent and Maintenance by Property Type, Revenue by Location, and Rent and Maintenance by Month. Slicers at the top filter the entire page instantly.
Page 2: Financial Analysis
Click here to purchase the Property Portfolio Dashboard in Google Sheets.
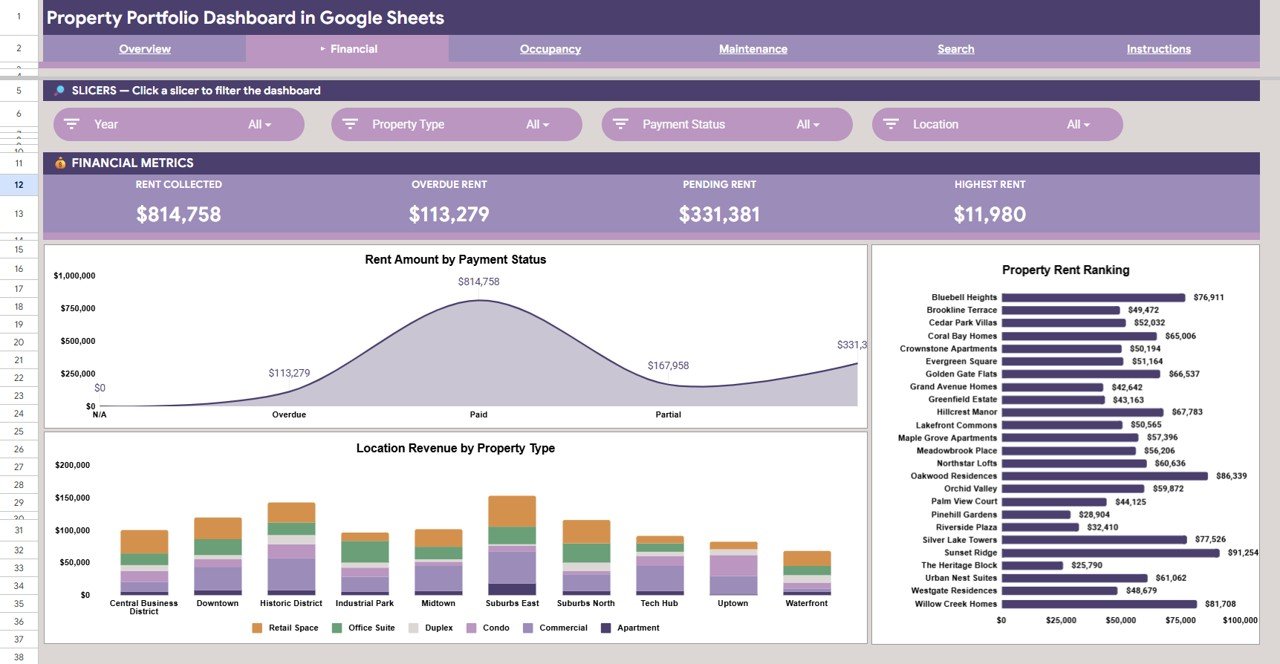
The Financial page breaks income down with Rent Amount by Payment Status, Rent by Property, and Revenue by Location and Property Type — making it easy to see top earners and tenants with outstanding balances.
Page 3: Occupancy Analysis
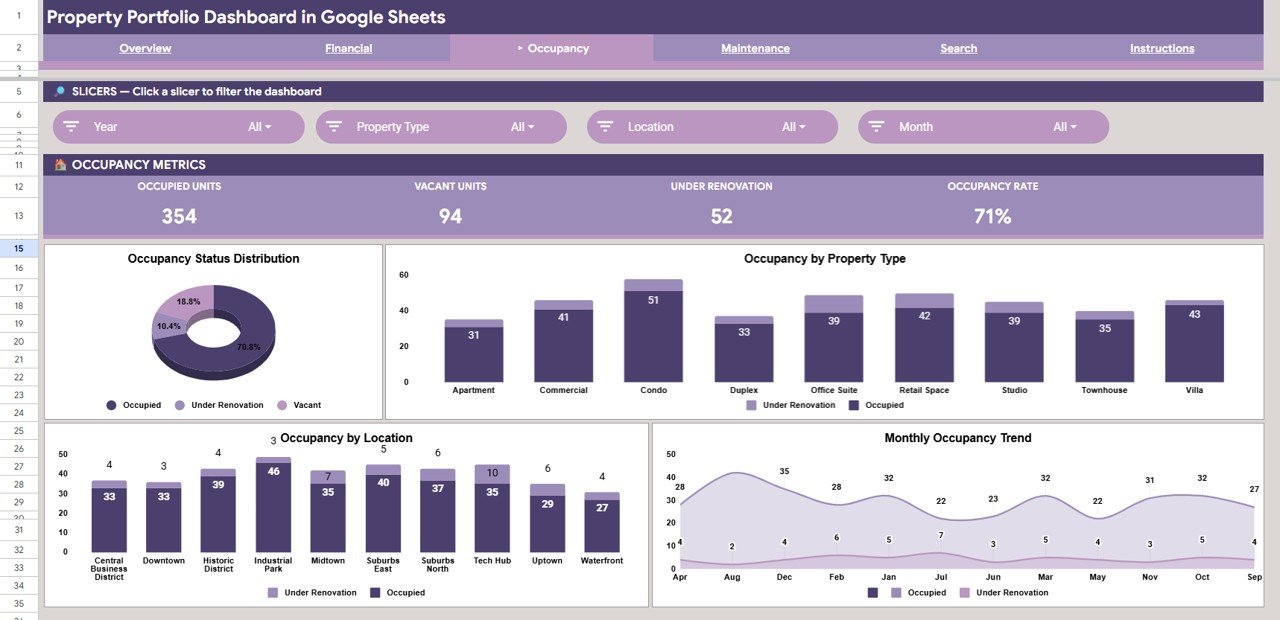
The Occupancy page tracks Occupancy by Status, Occupancy by Property Type, Occupancy by Location, and Occupancy by Month, so vacancy patterns and tenant-acquisition needs surface quickly.
Page 4: Maintenance Analysis
Click here to purchase the Property Portfolio Dashboard in Google Sheets.
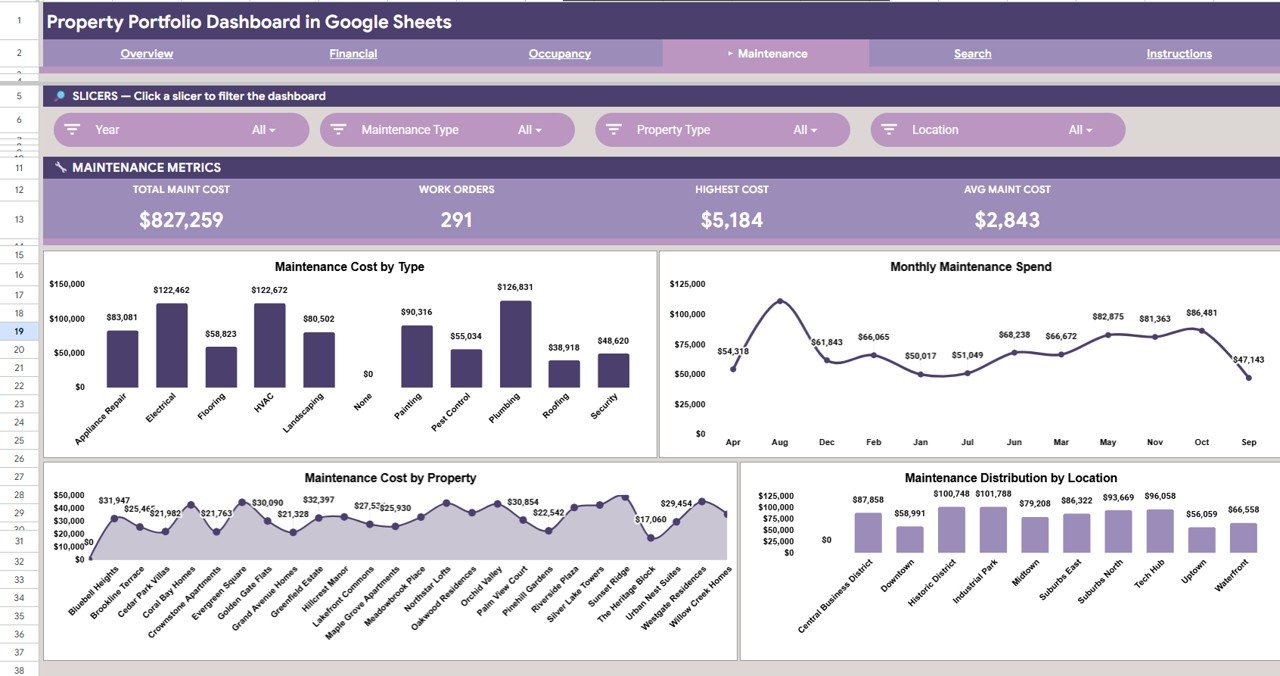
The Maintenance page covers Maintenance Cost by Type, Maintenance Spend by Month, Maintenance Cost by Property, and Maintenance Cost by Location — a clear view of where the repair budget goes.
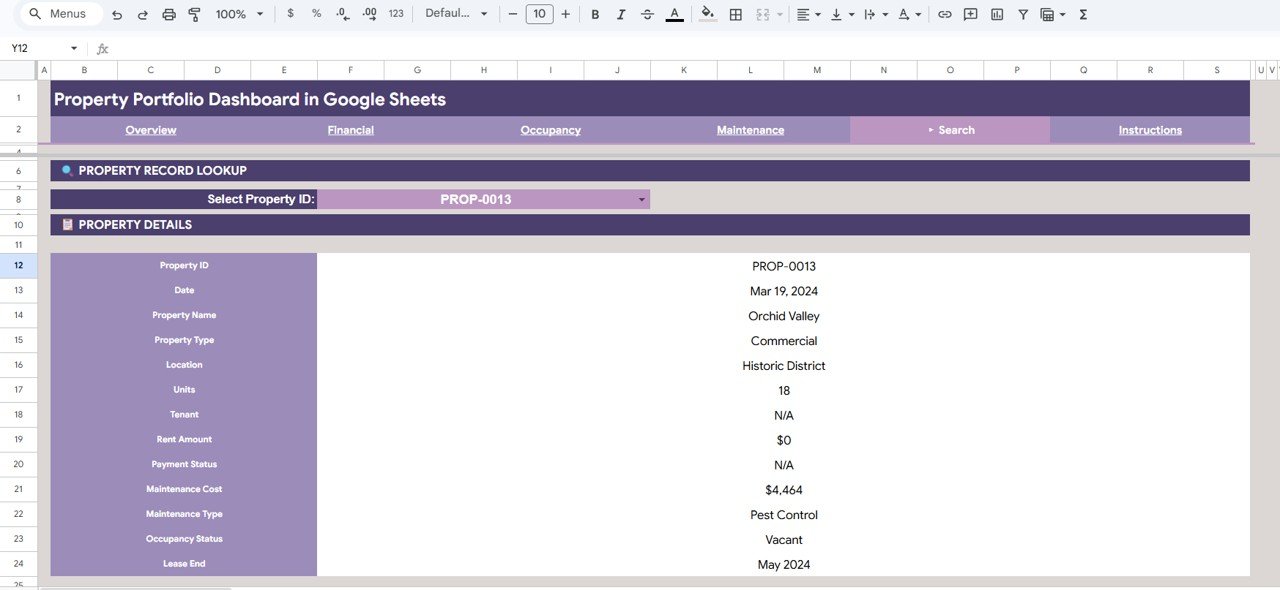
Page 5: Search Sheet
The Search Sheet is a property record lookup. Pick a Property ID from the dropdown and every detail appears at once — property name, type, location, units, tenant, rent amount, payment status, maintenance cost, maintenance type, occupancy status, and lease end date.
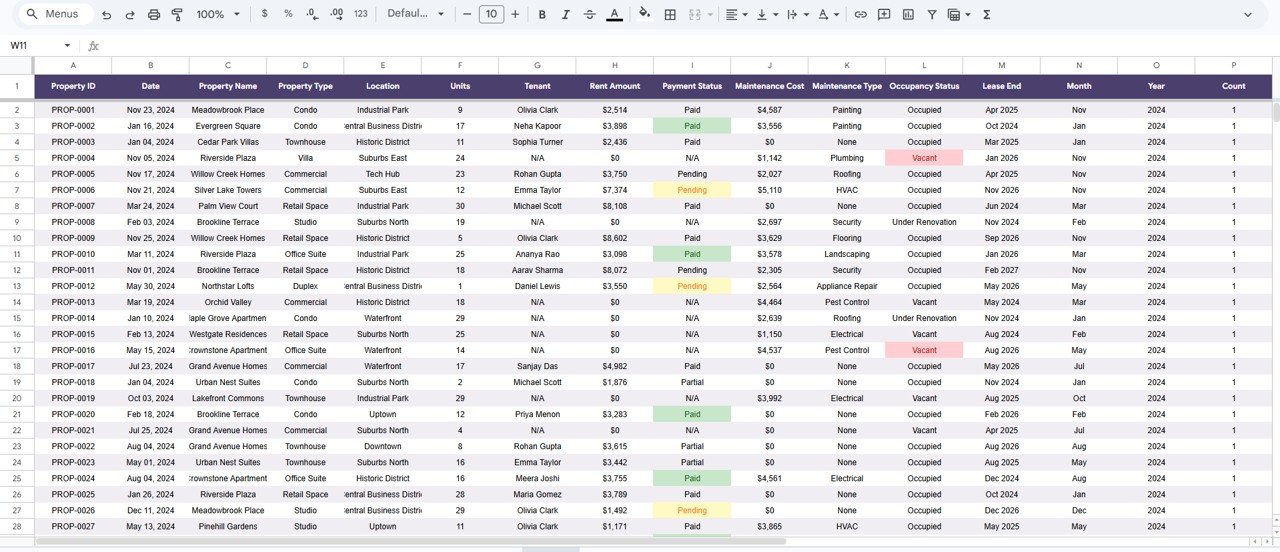
Page 6: Data Sheet
Click here to purchase the Property Portfolio Dashboard in Google Sheets.
The Data Sheet is the single input tab. Add your records in the same column format and every page, card, chart, and lookup updates automatically.
Property Portfolio Dashboard in Google Sheets vs. Microsoft Excel vs. Paid Property SaaS — Feature Comparison
| Feature | Property Portfolio Dashboard in Google Sheets | Microsoft Excel Dashboard | Paid SaaS (Buildium / AppFolio / Stessa) |
|---|---|---|---|
| Cost | $9.99 one-time | $17.99 one-time | $50–$300 / month |
| Platform | Google Sheets (any browser) | Microsoft Excel (desktop + web) | Cloud SaaS only |
| Setup time | Under 10 minutes | Under 10 minutes | 2–6 weeks onboarding |
| Real-time team collaboration | ✅ Built-in (Google Drive) | ⚠️ OneDrive only | ✅ Paid seat per viewer |
| Mobile access | ✅ Google Sheets app | ⚠️ Limited on mobile | ✅ |
| Customizable fields | ✅ Fully editable | ✅ Fully editable | ⚠️ Vendor-controlled |
| Property ID record lookup | ✅ Built-in Search Sheet | ✅ | ⚠️ Higher tier only |
| Year-1 cost at 5 users | $9.99 | $17.99 | $600–$3,600 |
For landlords and portfolio managers who want rent, occupancy, and maintenance visibility without paying $600–$3,600 a year for enterprise SaaS, the Property Portfolio Dashboard in Google Sheets sits in the sweet spot.
Who Should Use This Template
Click here to purchase the Property Portfolio Dashboard in Google Sheets.
Perfect for:
- Landlords and portfolio owners managing 5–150 residential or commercial units
- Property managers preparing monthly or quarterly owner and investor reports
- Real estate investors comparing rent yields, occupancy, and maintenance spend across properties
- Small property-management firms wanting owner-ready reports without Buildium or AppFolio
Not a fit if:
- You need tenant portals, automated rent collection, and payment processing
- You require SOC 2 compliance, audit trails, and granular role-based permissions
- You need automated lease-document generation, e-signatures, or tenant screening
Real-World Use Cases
Priya owns a 35-unit residential portfolio in Pune. She tracks monthly rent collected across four property types, flags tenants with pending payments on the Financial page, and shares an occupancy summary with her investors through a single link — dropping a recurring SaaS subscription in the process.
Daniel manages a 12-building commercial portfolio in Texas. He updates 200+ rows in the Data Sheet each month; the Maintenance page shows cost by building and repair type while the Overview cards report total rent, maintenance spend, and average occupied rent without a single manual formula.
Aisha handles 9 rental properties for private owners across two cities. She duplicates the sheet per client, drops in their data, and walks owners through occupancy and maintenance trends during quarterly reviews — a one-time purchase instead of a monthly tool.
Advantages of the Property Portfolio Dashboard in Google Sheets
Click here to purchase the Property Portfolio Dashboard in Google Sheets.
The biggest advantage is cost certainty: a single $9.99 purchase replaces a recurring per-unit subscription that can climb past $3,600 a year for a five-seat team. Because it is built in Google Sheets, sharing, version history, and real-time collaboration come for free through Google Drive.
It is also fast to adopt. There is no onboarding period — paste your data, and the KPI cards, 15 charts, slicers, and Search Sheet are live the same afternoon. Every field stays editable, so the dashboard bends to your property types and locations rather than forcing you into a vendor’s schema.
Opportunities for Improvement
This is a reporting and analysis tool, not an operations platform. It does not collect rent, send tenant notifications, or store lease documents, so teams needing those workflows will still want a dedicated system alongside it. Very large portfolios with tens of thousands of rows may also notice Google Sheets slowing down, in which case a database-backed tool is a better fit. For most small and mid-size portfolios, though, these limits rarely bite.
Best Practices
Keep the Data Sheet column order intact — the charts and lookup reference those positions. Standardize values for property type, location, and occupancy status so the slicers group cleanly. Duplicate the file per client or per year to keep historical snapshots, and lean on Google Sheets’ built-in version history; you can read more about how Sheets handles collaboration and revisions in Google’s official Sheets documentation.
Explore Relevant Templates
Get the dashboard here: Property Portfolio Dashboard in Google Sheets.
- Property Management Dashboard in Google Sheets — the close companion focused on day-to-day management reporting.
- REITs KPI Dashboard in Excel — fund-level metrics like FFO, NAV, and dividend yield.
- Home Inspection Dashboard in Google Sheets — track inspections and property condition.
- Coworking Space Dashboard in Google Sheets — a related occupancy-and-revenue view for shared workspaces.
Browse the full Google Sheets Dashboard Templates library for 200+ industry-specific dashboards.
Frequently Asked Questions
Click here to purchase the Property Portfolio Dashboard in Google Sheets.
What KPIs does the Property Portfolio Dashboard in Google Sheets track?
The Property Portfolio Dashboard in Google Sheets tracks 4 headline KPIs — Total Rent Collected, Maintenance Spend, Total Records, and Avg Rent (Occupied) — plus 15 charts across financial, occupancy, and maintenance analysis on 6 pages with slicer filtering.
How long does setup take?
Under 10 minutes. Open the PDF guide, click the Google Sheets copy link, paste your records into the Data Sheet, and every card, chart, slicer, and the Search Sheet lookup update automatically.
How does this compare to Buildium or AppFolio?
Buildium and AppFolio run $50–$300 per month with multi-week onboarding. The Property Portfolio Dashboard in Google Sheets is $9.99 one-time and delivers the reporting layer most landlords need without per-unit fees.
Can I customize property types, locations, and maintenance categories?
Yes. Every field in the Data Sheet is editable, and the charts and KPI cards update automatically when you change property types, locations, or maintenance categories.
Does the dashboard work on mobile devices?
Yes. It runs in the Google Sheets app for iOS and Android, so it is viewable on tablets and phones, though a desktop browser gives the fullest view of the charts and slicers.
Is this a one-time payment?
Yes. The Property Portfolio Dashboard in Google Sheets is a one-time $9.99 purchase with lifetime access — no subscription and no per-user fees.
About the Author
Built by PK — Microsoft Certified Professional with 15+ years of Excel, Google Sheets, and Power BI experience. Founder of NextGenTemplates, reaching 300K+ subscribers across YouTube channels. Every template is hand-built and tested before release.
Conclusion
If you want rent, occupancy, and maintenance visibility across your whole portfolio without a monthly bill, this template earns its place fast. Click here to purchase the Property Portfolio Dashboard in Google Sheets.
Instant download · One-time payment · No subscription
🎥 For step-by-step video tutorials, visit YouTube.com/@NeoTechNavigators.
Last updated: June 2026