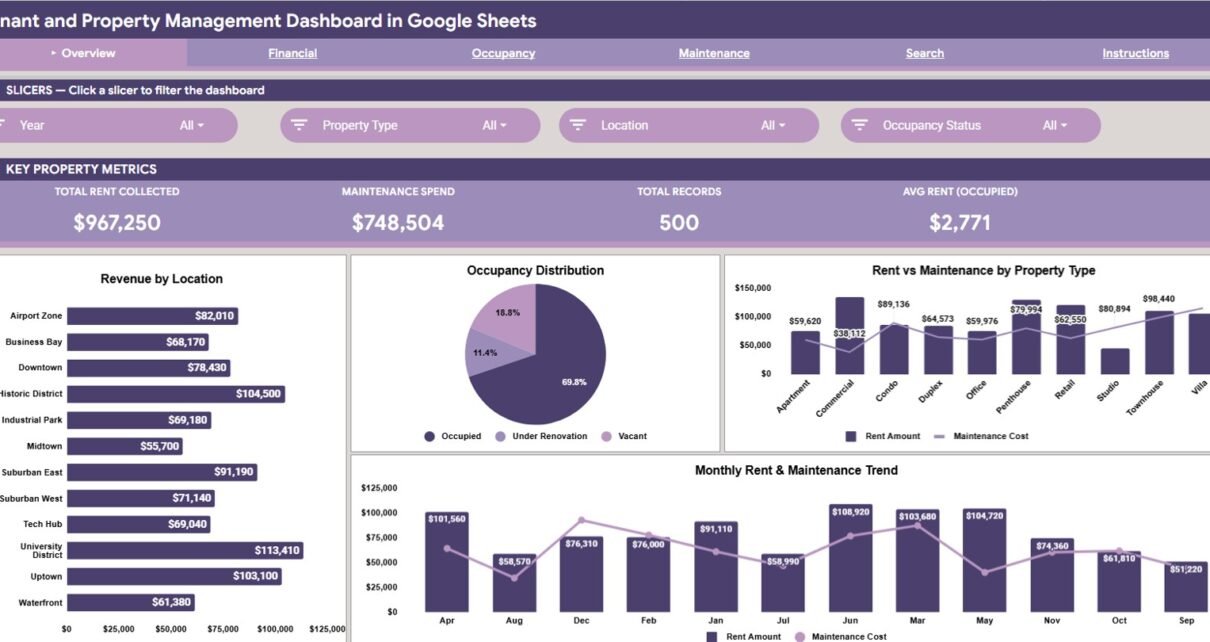
The Tenant and Property Management Dashboard in Google Sheets tracks 4 headline KPIs and 15 pre-built charts across 6 linked sheets — Overview, Financial, Occupancy, Maintenance, Search and Data. Slicers sit at the top of each analysis page, so filtering rent, occupancy and maintenance numbers by location, property type or payment status takes a single click. Setup takes under 10 minutes because every chart is already bound to the Data sheet.
Most landlords and small property managers end up with the same mess: one sheet for rent, another for repairs, a third for lease dates, and no single place that answers “which properties are actually making money?” This dashboard puts rent collection, occupancy status and maintenance spend on one screen so that question takes seconds instead of an afternoon of copy-paste.
Key Features of the Tenant and Property Management Dashboard in Google Sheets
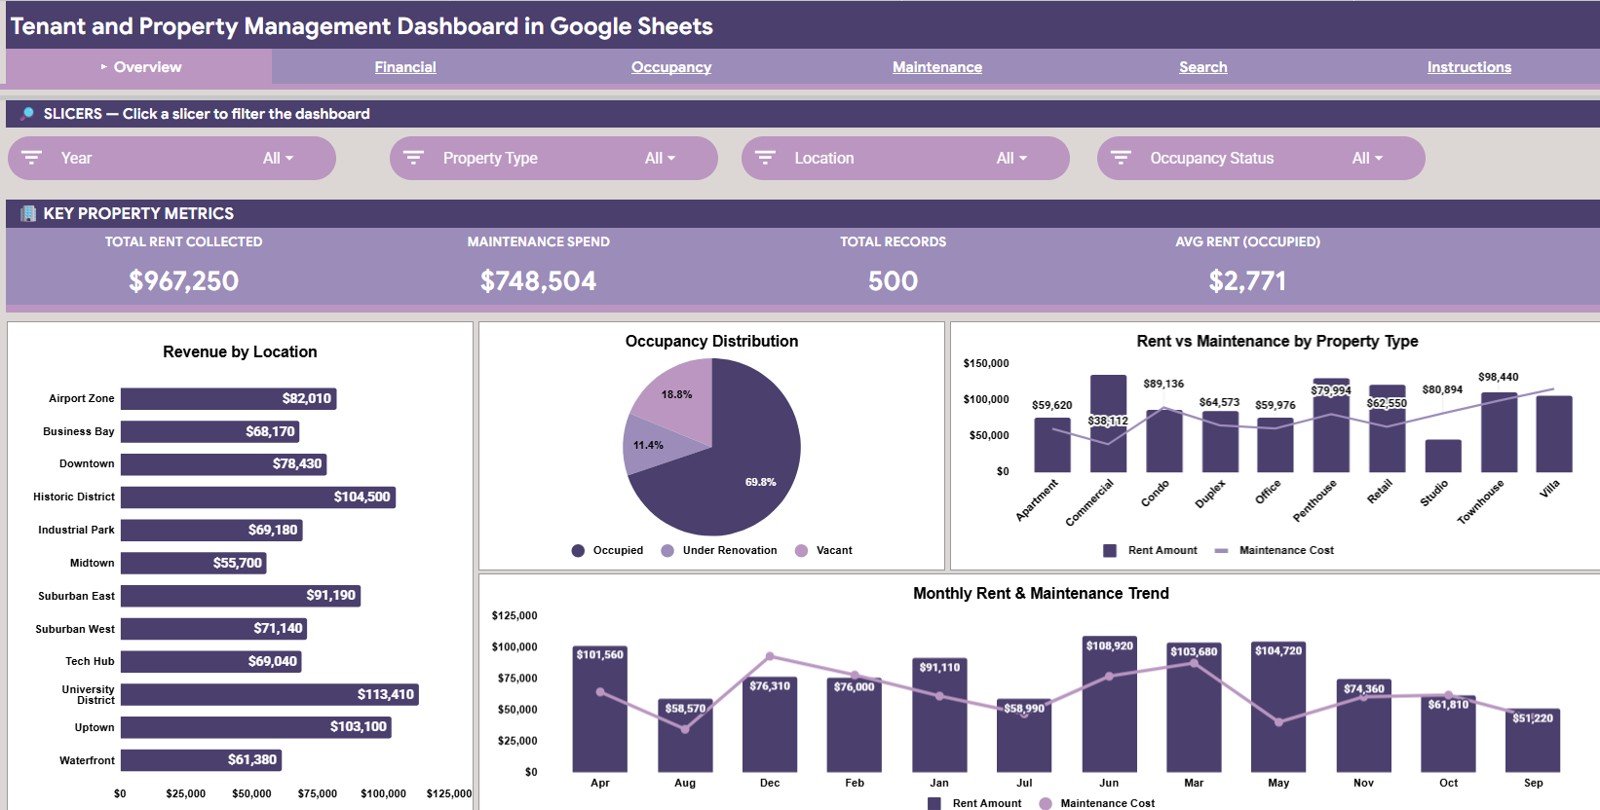
- 4 executive KPI cards — Total Rent Collected, Maintenance Spend, Total Records and Avg Rent (Occupied) sit across the top of the Overview page and recalculate every time a slicer changes.
- 15 charts across 4 analysis pages — 4 on Overview, 3 on Financial, 4 on Occupancy and 4 on Maintenance. None of them need a chart editor.
- Slicer-driven filtering — filter by location, property type, payment status and occupancy status; all cards and charts on the page respond together.
- Property ID lookup sheet — pick one Property ID and read back property name, type, location, units, tenant, rent amount, payment status, maintenance cost, maintenance type, occupancy status and lease end date.
- Rent versus maintenance view — shows which property types collect well but quietly lose margin to repairs.
- Runs entirely in the browser — Google Sheets on desktop, tablet or phone, shared with a link, no software install.
Dashboard Pages Explanation
Page 1: Overview
The Overview page opens with four KPI cards — Total Rent Collected, Maintenance Spend, Total Records and Avg Rent (Occupied) — followed by four charts and a row of slicers that filter the whole page. Revenue by Location shows which city or area carries your rent roll. Occupancy Distribution by Status splits units across occupied, vacant and other states. Rent vs Maintenance by Property Type puts income and repair cost side by side for each asset class. Monthly Rent and Maintenance Trend plots both lines month over month so widening gaps are obvious.
Page 2: Financial
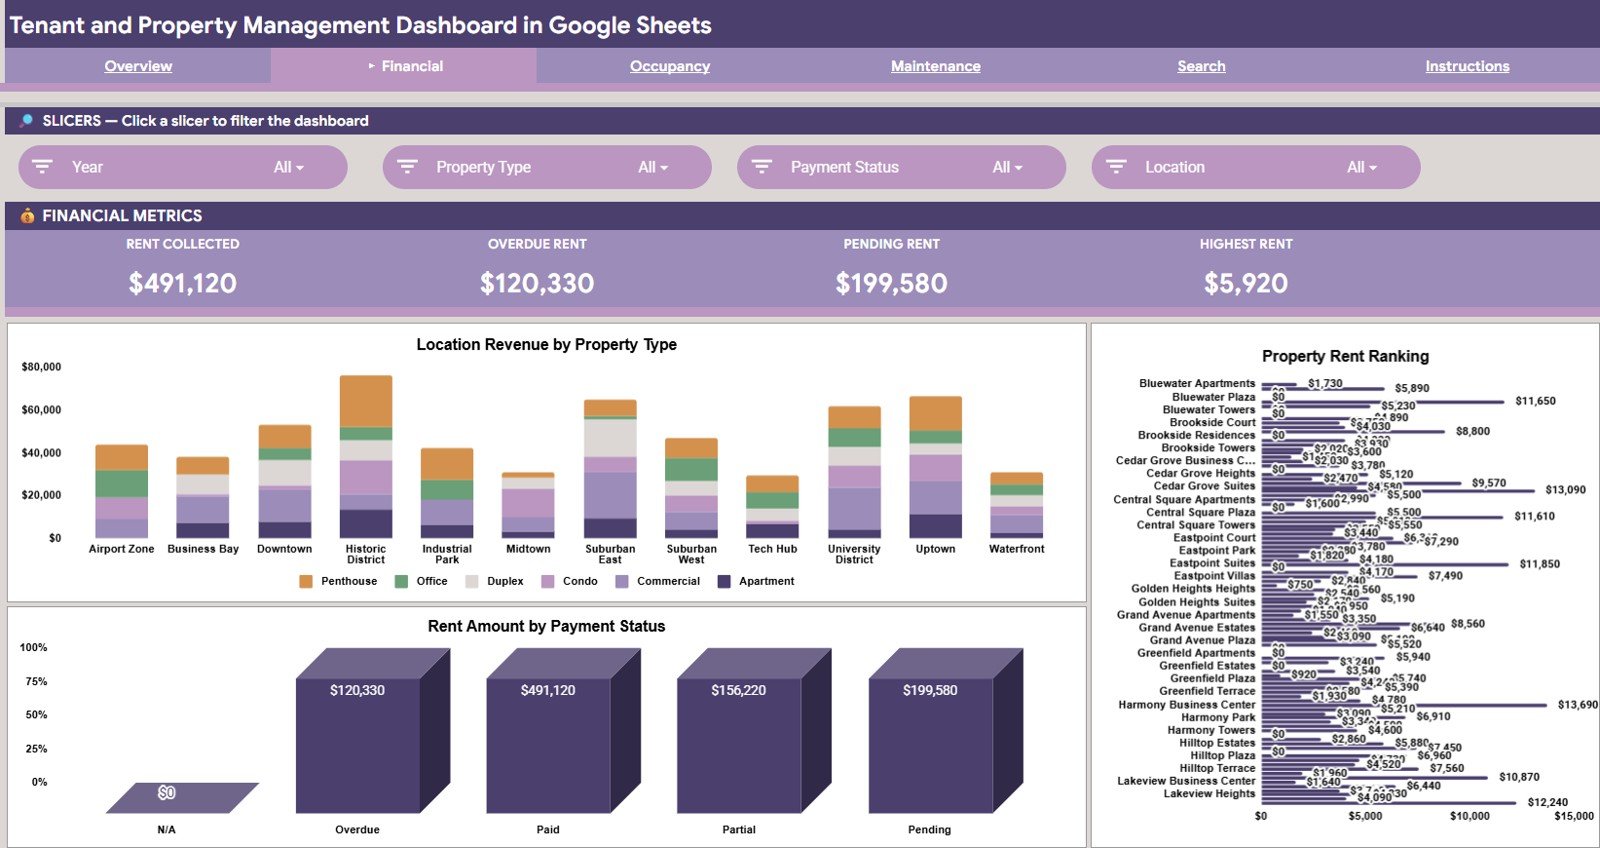
The Financial page drills into where rent money comes from. Location Revenue by Property Type crosses geography with asset class so you can see, for example, whether apartments in one location out-earn villas in another. Property Rent Ranking orders every property by rent contribution, putting top and bottom performers on screen without manual sorting. Rent Amount by Payment Status separates collected rent from pending and overdue amounts, which is the fastest way to size your collection gap.
Page 3: Occupancy
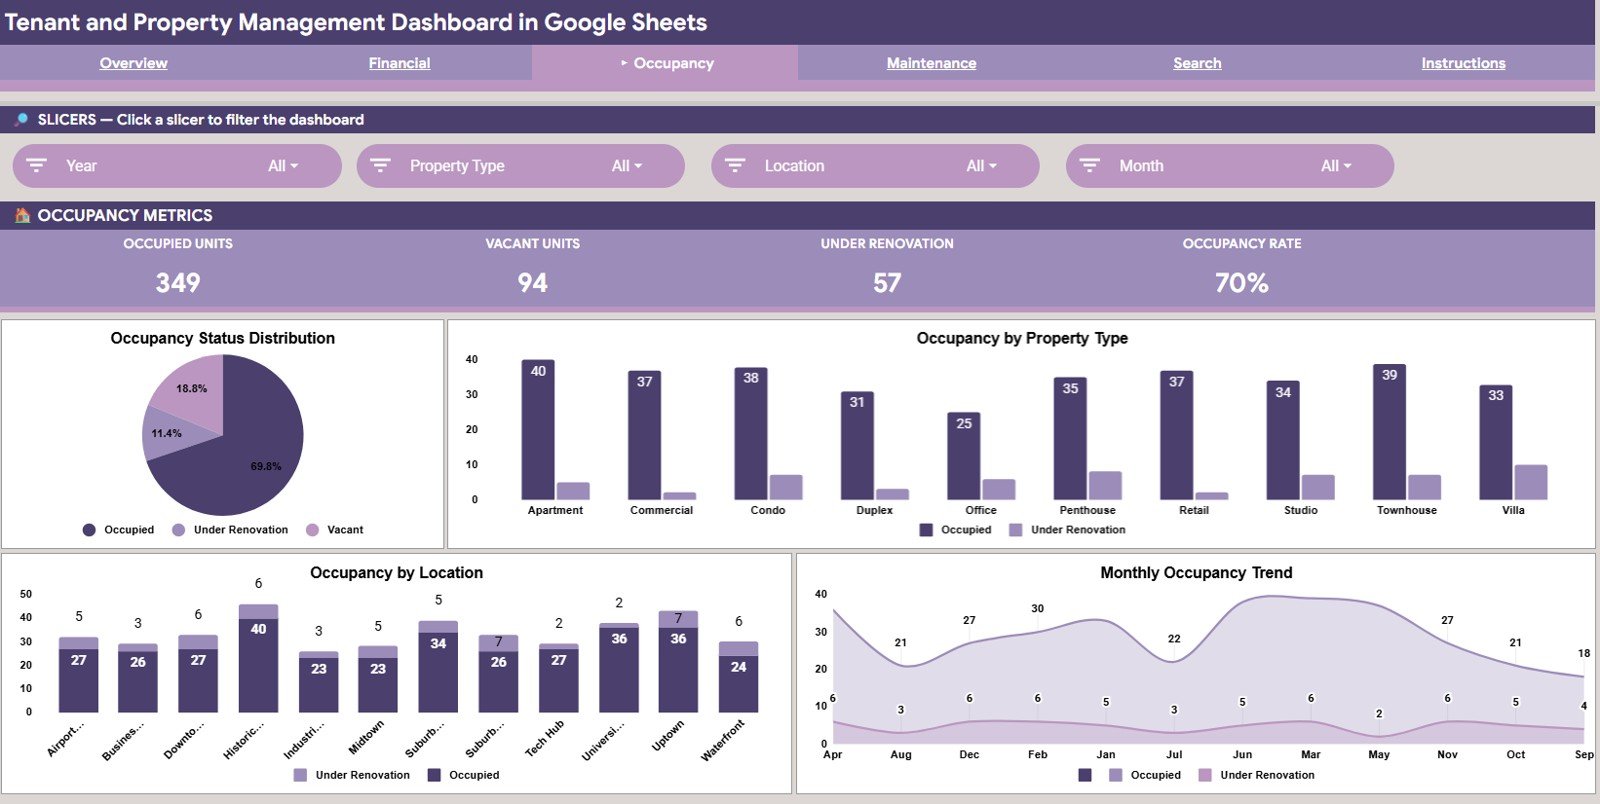
The Occupancy page answers how much of your portfolio is earning. Occupancy Status Distribution gives the headline split of occupied versus vacant units. Occupancy by Property Type shows which asset classes fill fastest and which sit empty. Occupancy by Location does the same across your geographic footprint. Monthly Occupancy Trend tracks the movement over time, which is where seasonal vacancy patterns become visible.
Page 4: Maintenance
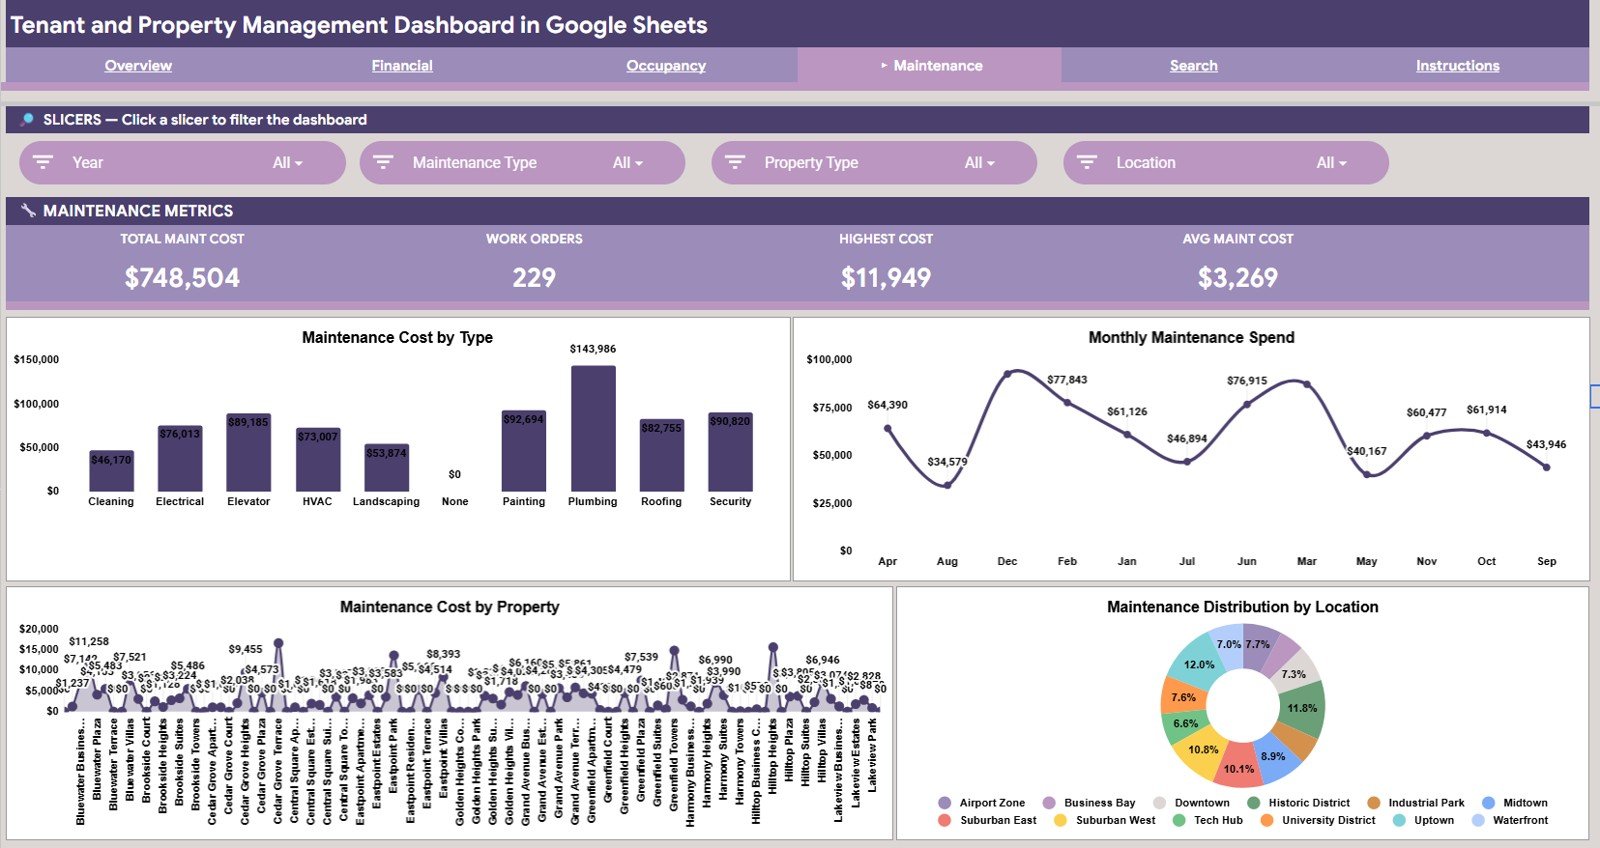
The Maintenance page tracks where repair budget goes. Maintenance Cost by Type breaks spend into plumbing, electrical, painting and whatever categories you use. Monthly Maintenance Spend shows the seasonal shape of your repair bill. Maintenance Cost by Property surfaces the units that keep coming back for work. Maintenance Distribution by Location shows whether one area is absorbing a disproportionate share of the budget.
Page 5: Search Sheet
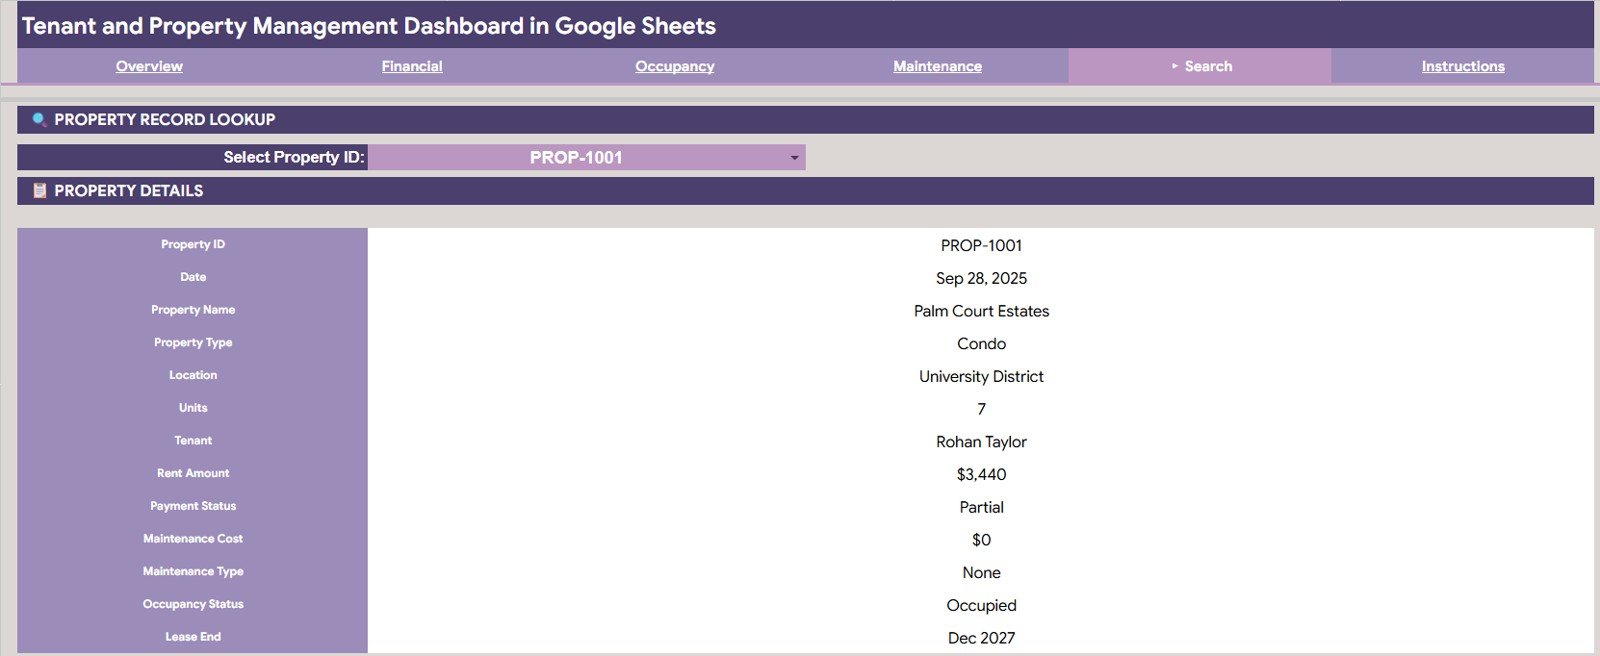
The Search sheet is the single-property view. Select any Property ID from the dropdown and the sheet instantly returns property name, property type, location, units, tenant, rent amount, payment status, maintenance cost, maintenance type, occupancy status and lease end date. It is the page to open when a tenant calls and you need their full record in one glance.
Page 6: Data Sheet
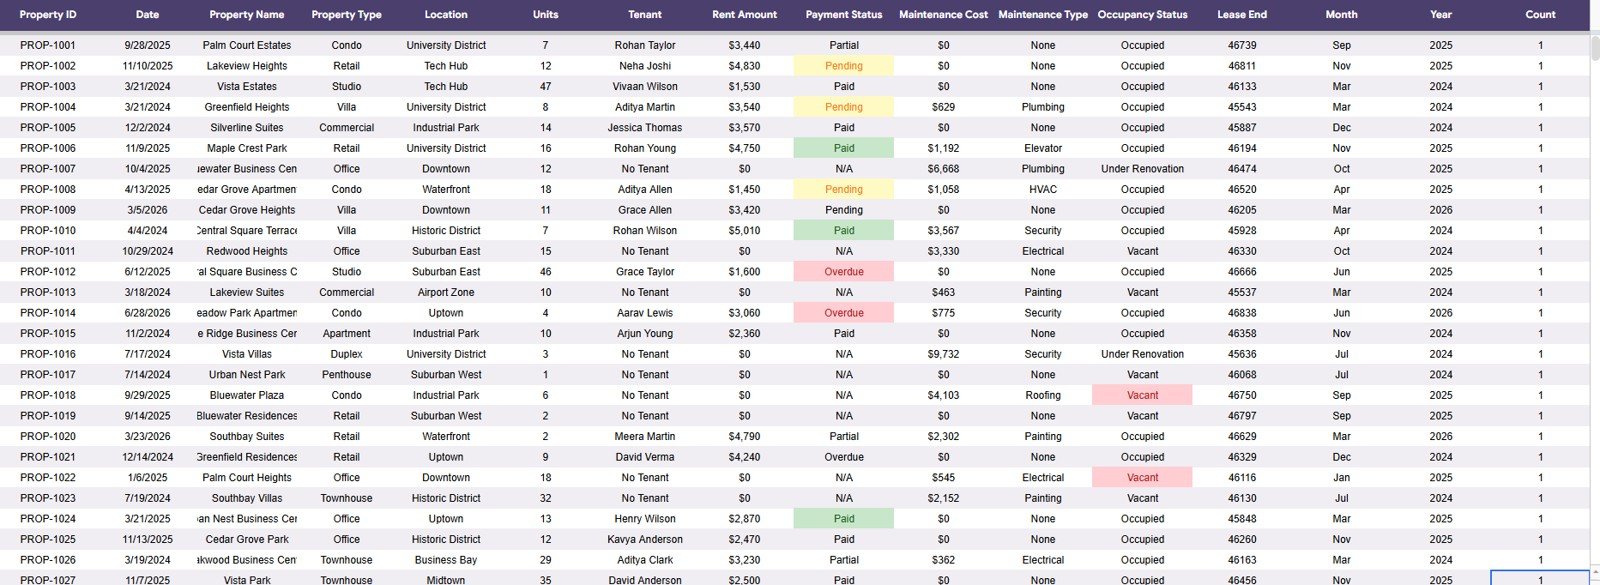
The Data sheet holds every property record and feeds all four analysis pages plus the Search sheet. Add your rows in the same column order as the sample data and the entire dashboard updates on its own — no formula editing, no chart range adjustments.
Tenant and Property Management Dashboard in Google Sheets vs. Microsoft Excel Dashboard vs. Buildium / AppFolio — Feature Comparison
| Feature | Tenant and Property Management Dashboard in Google Sheets | Microsoft Excel Dashboard | Buildium / AppFolio |
|---|---|---|---|
| Cost | $9.99 one-time ✅ | $10–$20 one-time, plus a Microsoft 365 licence | Monthly subscription, commonly $50–$300+ depending on unit count |
| Platform | Any browser — nothing to install ✅ | Desktop Excel required for full fidelity | Vendor cloud platform |
| Setup time | Under 10 minutes ✅ | Under 15 minutes | Days to weeks, often with onboarding calls |
| Real-time team collaboration | Built in ✅ | Only via OneDrive co-authoring | Built in ✅ |
| Mobile access | Google Sheets mobile app ✅ | Limited on Excel mobile | Native mobile app ✅ |
| Customisable fields and charts | Fully editable, you own the file ✅ | Fully editable ✅ | Restricted to vendor field schema |
| Share with a link | Two clicks ✅ | Requires cloud upload first | Seat-based access only |
| Property ID instant lookup | Dedicated Search sheet ✅ | Usually needs manual formula work | Built in ✅ |
| Year-1 cost at 5 users | $9.99 total ✅ | $10–$20 plus licences | Typically $600–$3,600+ |
For landlords and small managers who want portfolio visibility without a per-unit monthly bill, the Tenant and Property Management Dashboard in Google Sheets sits in the sweet spot.
Who Should Use This Template
Perfect for:
- Independent landlords managing roughly 5–100 rental units across one or several locations
- Small property management firms that need reporting without paying per unit every month
- Real estate investors tracking rent yield and maintenance drag across a mixed portfolio
- Family offices and co-owners who want a shareable, link-based view of portfolio performance
- Facility and estate teams already living inside Google Workspace
Not a fit if:
- You need automated rent collection, online tenant payments or bank reconciliation — this is a reporting layer, not a payments platform
- You need tenant screening, e-signed leases or maintenance ticket workflows with vendor assignment
- You manage thousands of units and need role-based permissions and audit trails
- Your organisation prohibits Google Workspace for property data
Real-World Use Cases
Ravi owns 22 rental units across two cities. He opens the Overview page every month, filters by location, and compares Total Rent Collected against Maintenance Spend. When one city’s maintenance line started climbing three months in a row on the Monthly Rent and Maintenance Trend chart, he traced it through the Maintenance Cost by Property chart to two ageing units and scheduled a proper renovation instead of paying for repeat call-outs.
Priya runs a five-person property management firm handling 60 units. Her team shares one copy of the dashboard with view-only links for owners. Before each owner call she filters the Financial page to that owner’s properties and screenshots the Property Rent Ranking and Rent Amount by Payment Status charts — replacing what used to be a manual monthly report in a word processor.
Daniel is a real estate investor evaluating whether to expand into commercial units. He uses Occupancy by Property Type and Rent vs Maintenance by Property Type together to check whether his commercial units actually return more net of upkeep than his residential ones. The answer changed his acquisition plan for the year.
Advantages of the Tenant and Property Management Dashboard in Google Sheets
The clearest advantage is cost structure. A $9.99 one-time purchase replaces a recurring per-unit subscription, and there are no seat fees when you add a bookkeeper or a co-owner. Over a single year at five users the difference is typically hundreds of dollars.
The second advantage is speed. Because the KPI cards, all 15 charts and the Search sheet already reference the Data sheet, the work of building a dashboard is done. You paste data and read results. There is no chart range to redefine and no pivot to refresh.
The third is ownership. The file lives in your Google Drive. You can add a column, change a chart type, translate labels, or rebuild a page entirely — none of which is possible inside a closed SaaS product. If you want to go deeper on pivot-driven layouts, Google’s own pivot table documentation is a useful companion.
Opportunities for Improvement
Being straightforward about the limits: this dashboard reports, it does not transact. There is no rent collection gateway, no automated payment reminders and no tenant portal. If a tenant pays late, you record it — the sheet will not chase them.
Lease end dates appear on the Search sheet but there is no automatic expiry alert. Setting up a conditional format or a Google Apps Script trigger for leases inside 60 days is a sensible addition if renewals are a big part of your workload.
Very large portfolios will also feel the ceiling. Google Sheets handles a few thousand property records comfortably, but at tens of thousands of rows recalculation slows down and a database-backed tool becomes the better answer.
Best Practices
- Keep the Data sheet column order exactly as supplied — every chart and the Search lookup depend on it.
- Use consistent spelling for location, property type and payment status. “Apartment” and “apartment” will split into two chart categories.
- Record maintenance cost in the same month it was incurred so the Monthly Rent and Maintenance Trend chart stays honest.
- Duplicate the file at the start of each financial year and archive the previous one, rather than letting a single sheet grow indefinitely.
- Share owner copies as view-only links so nobody edits your formulas by accident.
- Review Property Rent Ranking and Maintenance Cost by Property side by side each quarter — that pairing is where underperforming units reveal themselves.
Explore Relevant Templates
- Property Portfolio Dashboard in Google Sheets — portfolio-level value, yield and asset mix reporting.
- Real Estate Property Tracker in Google Sheets — a lighter, single-page tracker for smaller portfolios.
- Rent Collection Data Entry System in Excel — a VBA form for capturing rent receipts at the point of collection.
- Property Enquiry Data Entry System in Excel — log and follow up inbound property enquiries.
- Home Inspection Dashboard in Power BI — inspection findings and condition reporting.
💎 Save 66% — get all 7 templates in the Real Estate & Property Bundle →
Related reading on this site: Property Portfolio Dashboard in Google Sheets, Property Management Dashboard in Google Sheets, Real Estate Property Tracker in Google Sheets and Property Management Dashboard in HTML.
Frequently Asked Questions
What KPIs does the Tenant and Property Management Dashboard in Google Sheets track?
The Tenant and Property Management Dashboard in Google Sheets tracks four headline KPIs — Total Rent Collected, Maintenance Spend, Total Records and Avg Rent (Occupied) — supported by 15 charts covering revenue by location, occupancy status, rent versus maintenance and monthly trends. All figures respond to the slicers on each page.
How long does setup take?
Setup takes under 10 minutes. Open the copy link from the included PDF guide, create your own copy in Google Drive, then paste your property records into the Data sheet using the same column order as the sample rows. Every card and chart updates automatically after that.
How does this compare to Buildium or AppFolio?
Buildium and AppFolio are full property management platforms with rent collection, tenant portals and maintenance ticketing, billed monthly. The Tenant and Property Management Dashboard in Google Sheets is a $9.99 one-time reporting layer — no transactions, no seat fees, and you own and can edit the file completely.
Can I add my own property types and locations?
Yes. Type any location, property type, payment status or occupancy status directly into the Data sheet and the charts and slicers in the Tenant and Property Management Dashboard in Google Sheets pick up the new values automatically. Keep spelling consistent so categories do not split.
How many properties can the dashboard handle?
The Tenant and Property Management Dashboard in Google Sheets comfortably handles a few thousand property records. Beyond roughly ten thousand rows, Google Sheets recalculation slows noticeably and a database-backed tool becomes a better fit for the portfolio.
Does it work on mobile?
Yes. Because the Tenant and Property Management Dashboard in Google Sheets runs entirely in Google Sheets, it opens in the Google Sheets mobile app on both Android and iOS. Charts render fine; the KPI cards and Search sheet are the most practical pages on a small screen.
Can I share it with owners or accountants?
Yes. Share the file with a view-only link and they see the same live dashboard without being able to change formulas. There are no per-user charges, so adding an accountant or a co-owner costs nothing extra.
About the Author
Built by PK — Microsoft Certified Professional with 15+ years of Excel, Google Sheets and Power BI experience. Founder of NextGenTemplates, reaching 300K+ subscribers across YouTube channels. Every template is hand-built and tested before release.
Conclusion
If rent, occupancy and maintenance currently live in three separate files, the Tenant and Property Management Dashboard in Google Sheets consolidates them into one screen with 4 KPI cards, 15 charts and a Property ID lookup — for a single $9.99 payment instead of a monthly per-unit bill.
👉 Click here to Purchase the Tenant and Property Management Dashboard in Google Sheets
✅ Instant download · One-time payment · No subscription
🎥 For step-by-step video walkthroughs, visit Youtube.com/@NeoTechNavigators.
📅 Last updated: July 2026