The Tenant and Property Management Dashboard in Google Sheets tracks 4 headline KPIs and 15 pre-built charts across linked Overview, Financial, Occupancy, Maintenance, Search and Data sheets, plus an Instructions tab. Slicers sit at the top of each analysis page, so filtering rent, occupancy and maintenance numbers by year, property type, location, payment status or occupancy status takes a single click. Setup takes under 10 minutes because every chart is already bound to the Data sheet.
Many landlords and small property managers end up with one sheet for rent, another for repairs and a third for lease dates, and no single place that answers “which properties are actually making money?” This dashboard puts rent collection, occupancy status and maintenance spend on one screen so that question takes seconds instead of an afternoon of copy-paste.
🎥 Watch the Video Tutorial
Get the Tenant and Property Management Dashboard
Key Features of the Tenant and Property Management Dashboard in Google Sheets
- 4 executive KPI cards — Total Rent Collected, Maintenance Spend, Total Records and Avg Rent (Occupied) across the top of the Overview page, recalculating whenever a slicer changes.
- Page-level metric strips — the Financial, Occupancy and Maintenance pages each add four more metrics of their own.
- 15 charts across 4 analysis pages — 4 on Overview, 3 on Financial, 4 on Occupancy and 4 on Maintenance.
- Slicer-driven filtering — every analysis page has a row of four slicers (for example Year, Property Type, Location and Occupancy Status on the Overview page).
- Property ID lookup sheet — pick one Property ID and read back the full record, including tenant, rent, payment status, maintenance and lease end.
- Runs in the browser — Google Sheets on desktop, tablet or phone, shared with a link, nothing to install.
Dashboard Pages Explained
Page 1: Overview
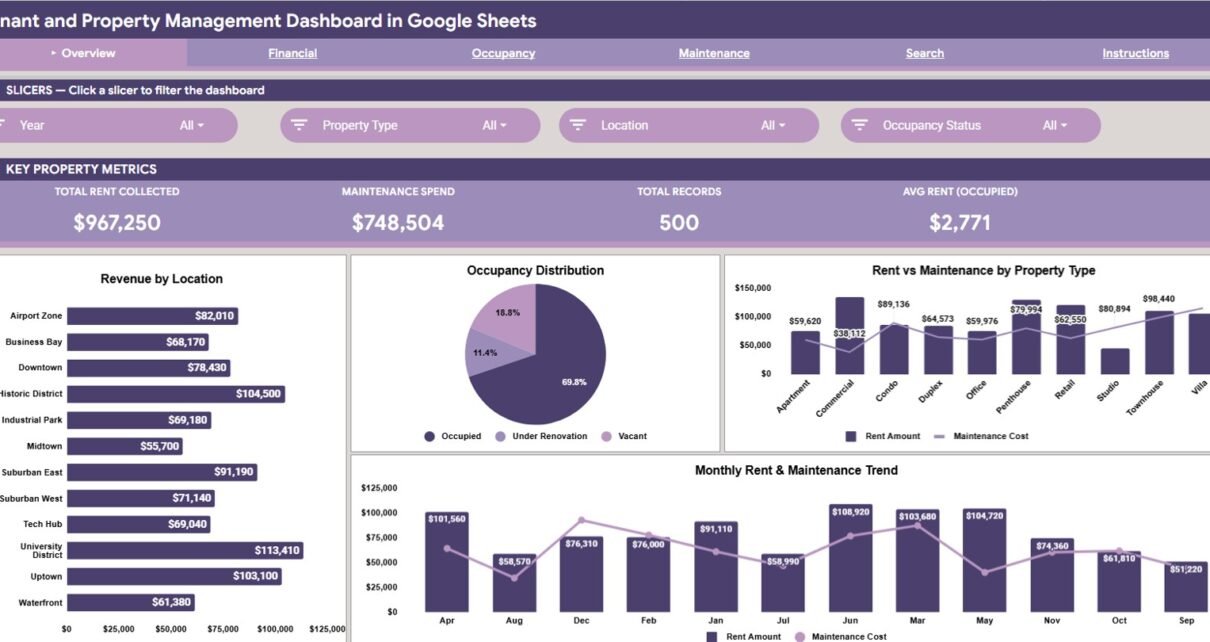
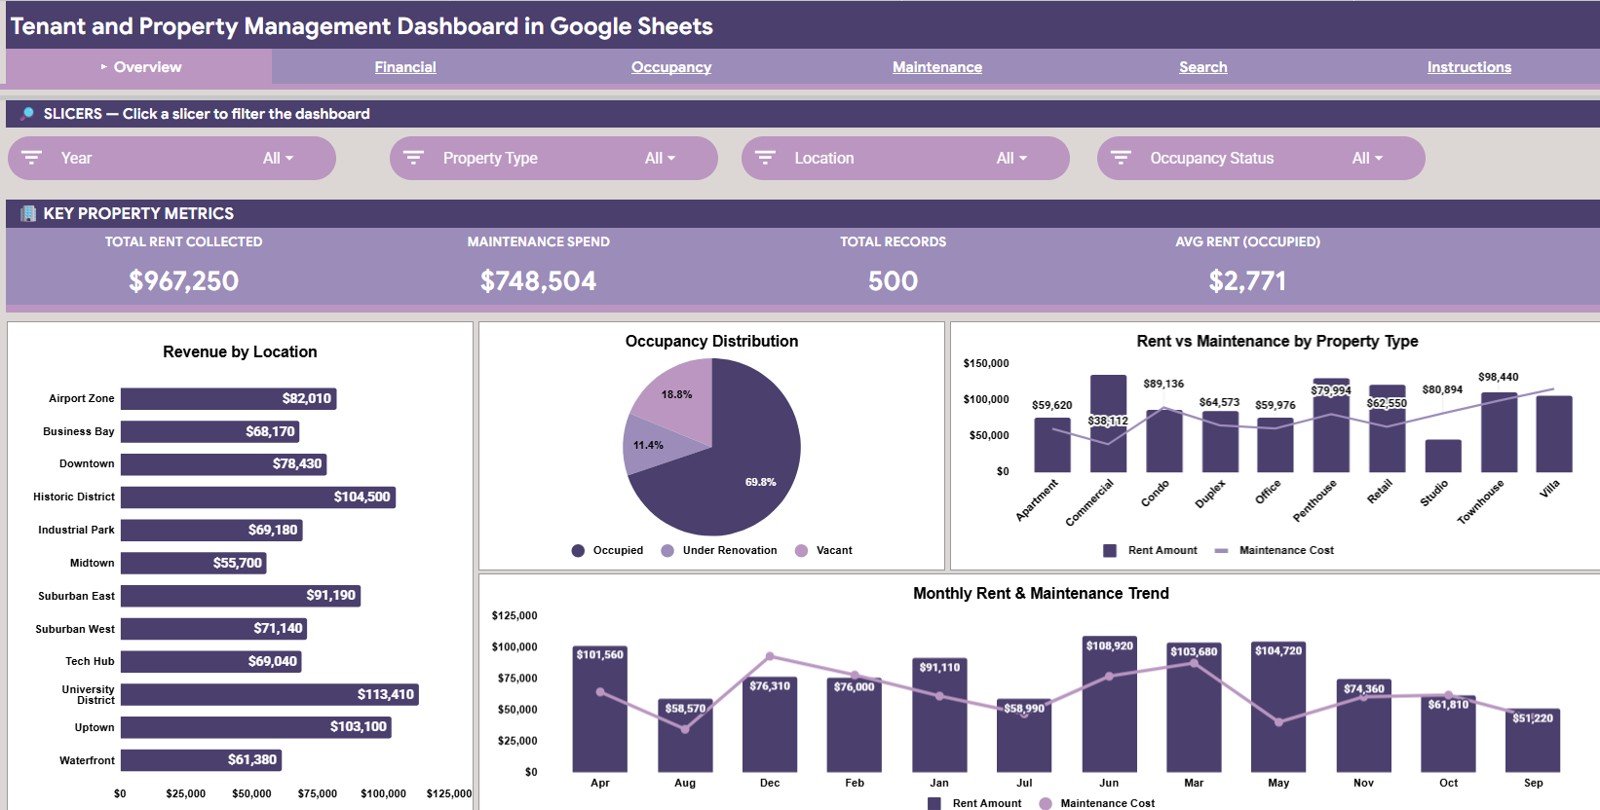
The Overview page opens with slicers for Year, Property Type, Location and Occupancy Status, then four KPI cards — Total Rent Collected, Maintenance Spend, Total Records and Avg Rent (Occupied). Four charts follow: Revenue by Location shows which area carries your rent roll; Occupancy Distribution splits units into Occupied, Under Renovation and Vacant; Rent vs Maintenance by Property Type puts income and repair cost side by side for each asset class; and Monthly Rent & Maintenance Trend plots both month by month so a widening gap is obvious.
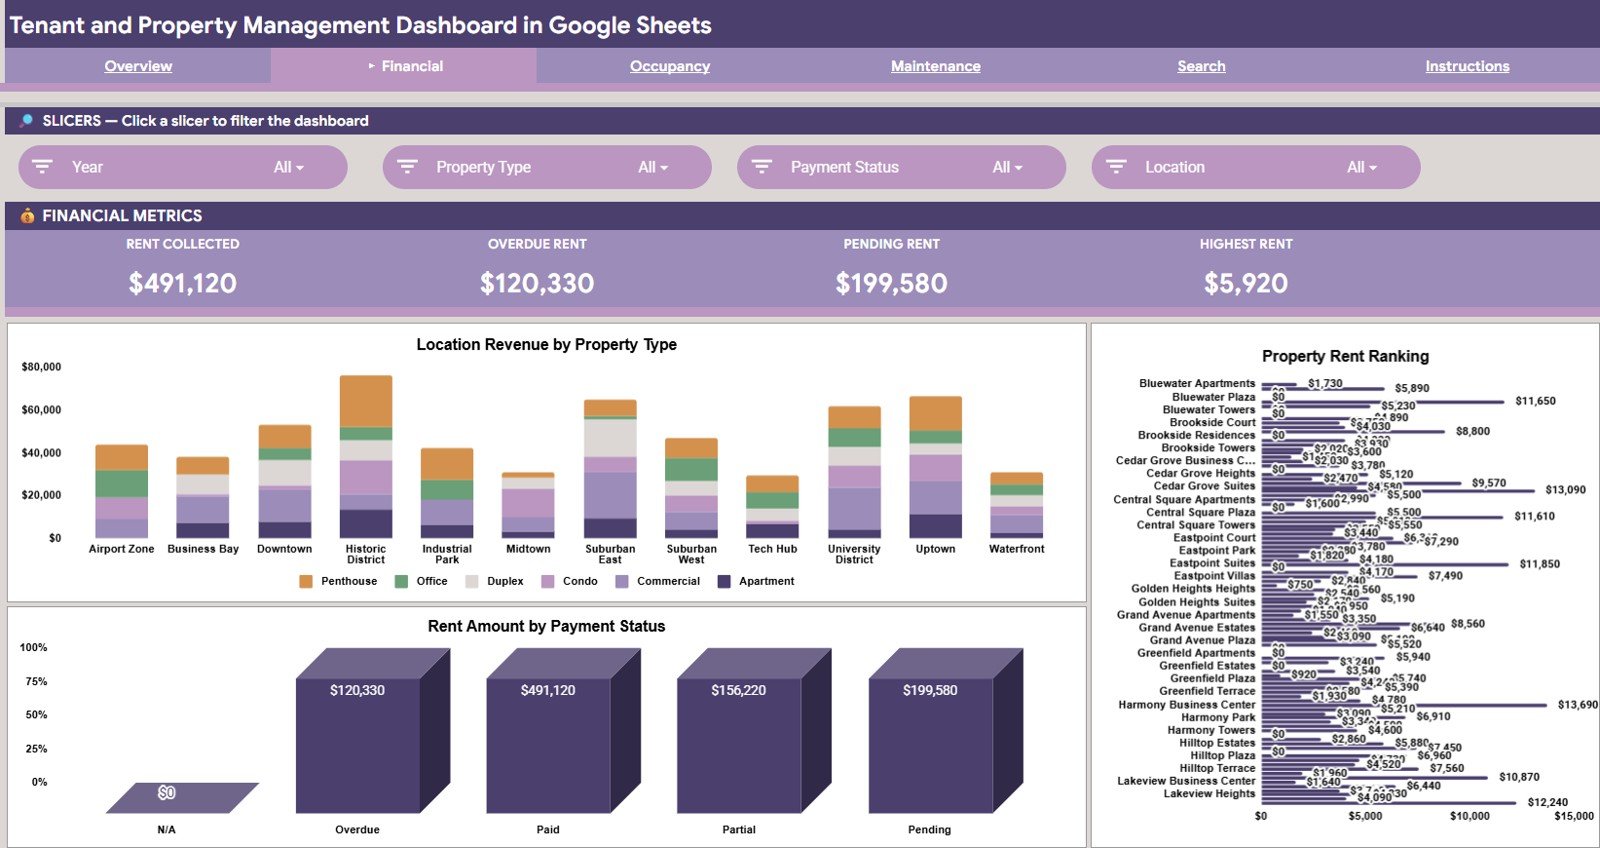
Reading the cards with the sample data: Avg Rent (Occupied) is total rent divided by occupied units — $967,250 ÷ 349 = $2,771. Note that the Overview card labelled Total Rent Collected ($967,250) adds rent across every payment status: Paid $491,120 + Partial $156,220 + Overdue $120,330 + Pending $199,580 = $967,250. The amount actually received is the Rent Collected metric on the Financial page ($491,120, Paid only), so use that figure when you report cash collected.
Page 2: Financial
The Financial page uses slicers for Year, Property Type, Payment Status and Location, with four metrics — Rent Collected (Paid rows only), Overdue Rent, Pending Rent and Highest Rent. Location Revenue by Property Type crosses geography with asset class; Property Rent Ranking orders properties by rent so top and bottom performers stand out; and Rent Amount by Payment Status separates Paid, Partial, Pending and Overdue amounts — the fastest way to size your collection gap.
Page 3: Occupancy
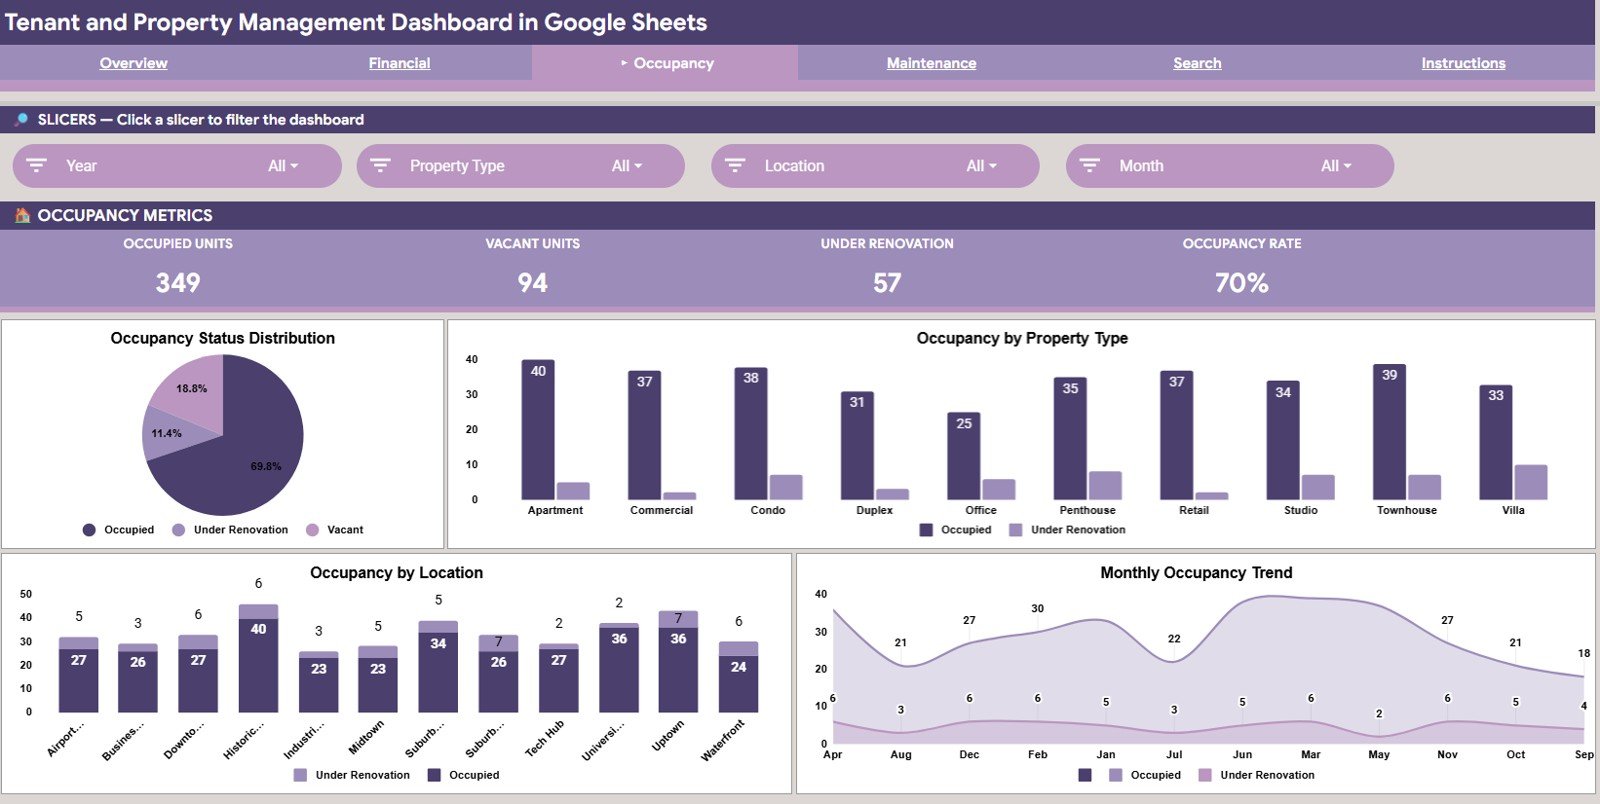
The Occupancy page filters by Year, Property Type, Location and Month and shows Occupied Units, Vacant Units, Under Renovation and Occupancy Rate. Occupancy Status Distribution gives the headline split; Occupancy by Property Type and Occupancy by Location show which asset classes and areas fill fastest; and Monthly Occupancy Trend reveals seasonal vacancy patterns.
Page 4: Maintenance
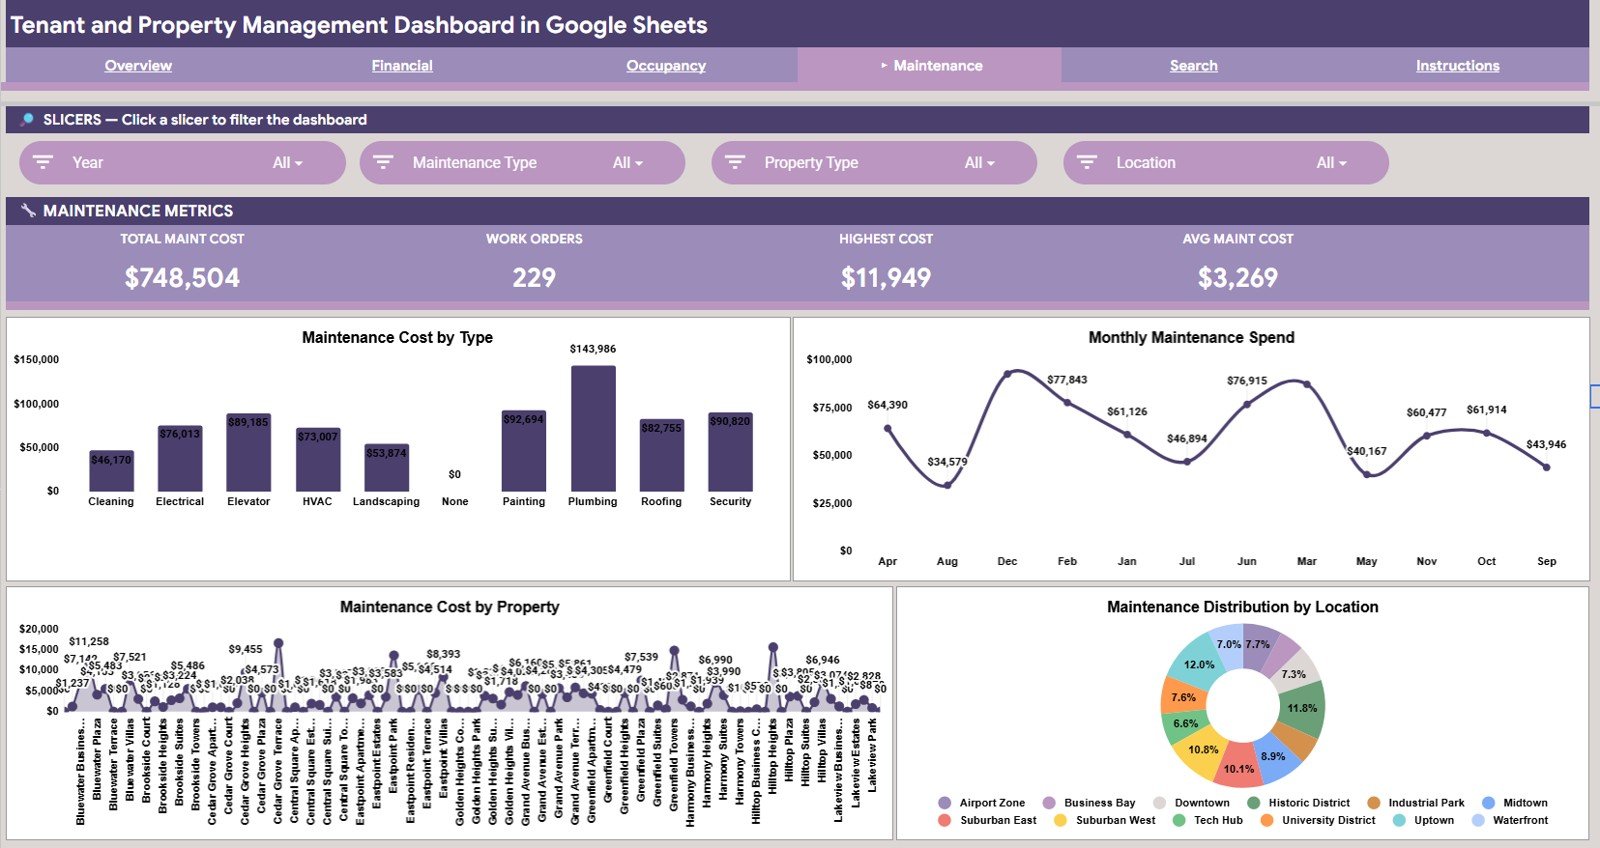
The Maintenance page filters by Year, Maintenance Type, Property Type and Location and shows Total Maint Cost, Work Orders, Highest Cost and Avg Maint Cost (in the sample, $748,504 ÷ 229 work orders = $3,269). Maintenance Cost by Type breaks spend into categories such as Cleaning, Electrical, Elevator, HVAC, Landscaping, Painting, Plumbing, Roofing and Security; Monthly Maintenance Spend shows the seasonal shape of your repair bill; Maintenance Cost by Property surfaces units that keep needing work; and Maintenance Distribution by Location shows whether one area absorbs a large share of the budget.
Page 5: Search
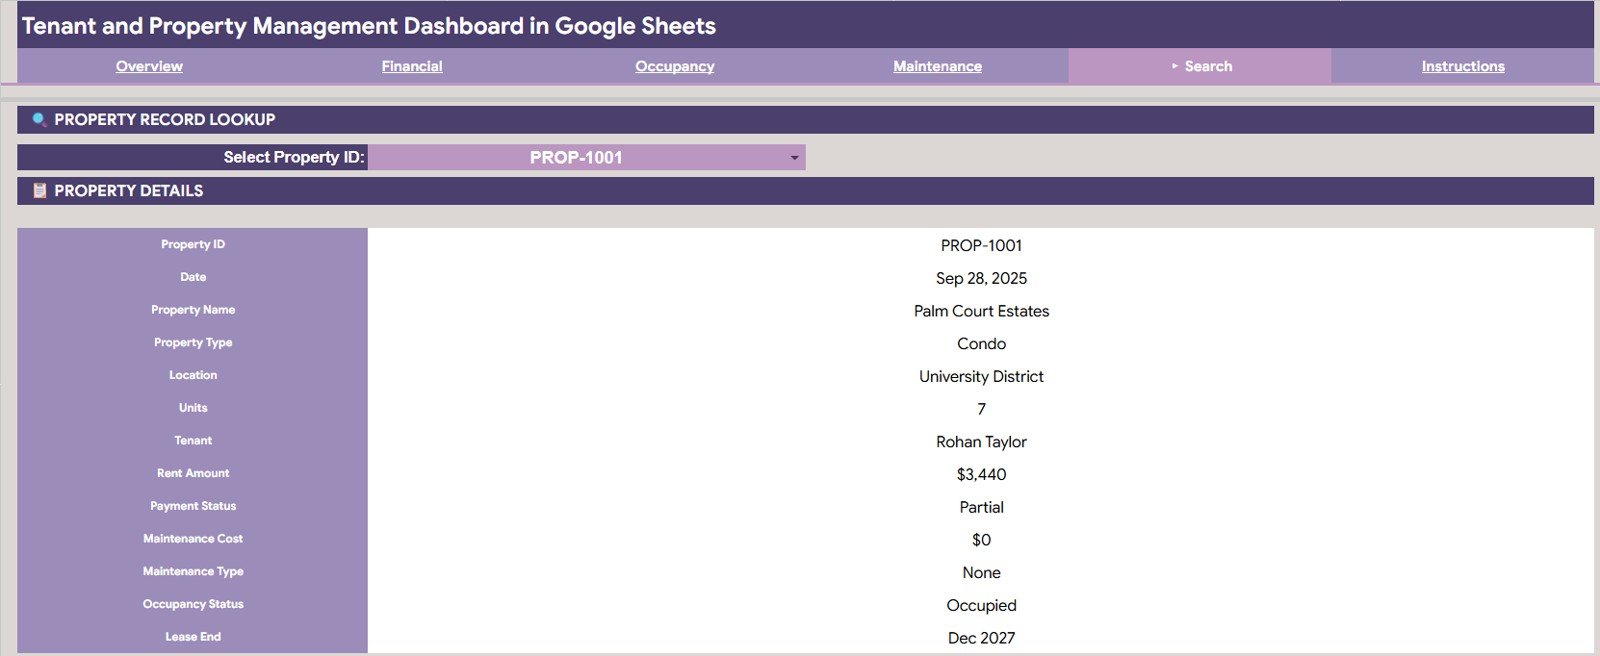
The Search sheet is the single-property view. Select a Property ID and it returns Property ID, Date, Property Name, Property Type, Location, Units, Tenant, Rent Amount, Payment Status, Maintenance Cost, Maintenance Type, Occupancy Status and Lease End — the page to open when a tenant calls.
Page 6: Data
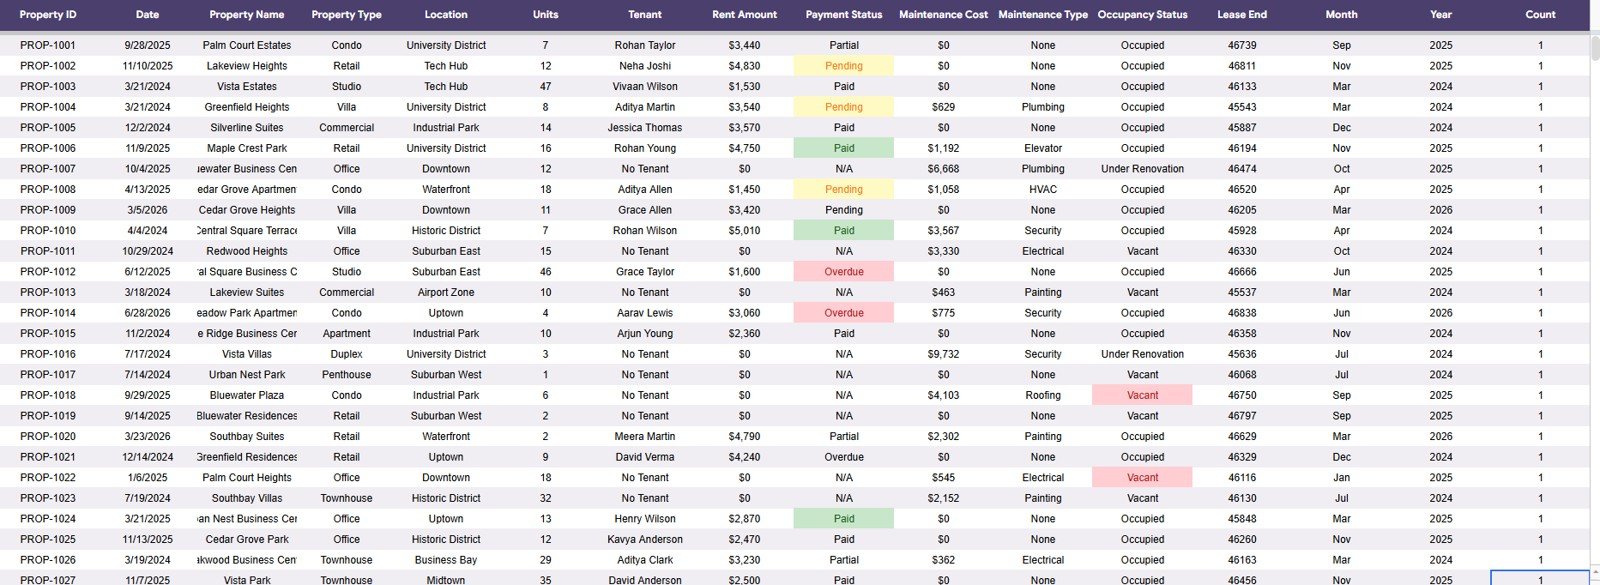
The Data sheet holds every property record and feeds all four analysis pages and the Search sheet. Its columns include Property ID, Date, Property Name, Property Type, Location, Units, Tenant, Rent Amount, Payment Status, Maintenance Cost, Maintenance Type, Occupancy Status, Lease End, Month, Year and a Count helper column. In the sample Data sheet, Lease End is stored as a date serial number; format the column as a date if you want to read it there (the Search sheet already shows it as month and year). Add rows in the same column order and the dashboard updates — no chart ranges to adjust.
Google Sheets Dashboard vs Excel vs Property Management Software
| Feature | Tenant and Property Management Dashboard (Google Sheets) | Excel dashboard | Property management software |
|---|---|---|---|
| Cost | $9.99 one-time | Template cost plus Microsoft 365 | Monthly subscription, often based on unit count |
| Platform | Any browser | Desktop Excel for full fidelity | Vendor cloud platform |
| Setup time | Under 10 minutes | Minutes | Days to weeks with onboarding |
| Real-time collaboration | Built in | Via OneDrive co-authoring | Built in |
| Customizable fields and charts | Fully editable | Fully editable | Limited to vendor schema |
| Property ID lookup | Dedicated Search sheet | Needs formula work | Built in |
| Rent collection / tenant portal | No — reporting only | No | Usually included |
For landlords and small managers who want portfolio visibility without a per-unit monthly bill, the dashboard is a practical reporting layer.
How to Use It With Your Own Portfolio
- Open the copy link from the included PDF guide and save your own copy in Google Drive.
- Read the Instructions tab, then open the Data sheet.
- Replace the sample rows with your property records, keeping the column order and using consistent spelling for locations, property types and statuses.
- Check the Overview KPI cards, then review the Financial, Occupancy and Maintenance pages.
- Use the Search sheet whenever you need one property’s full record.
Who Should Use This Template
A good fit for:
- Independent landlords managing roughly 5–100 rental units across one or several locations
- Small property management firms that need reporting without per-unit fees
- Real estate investors tracking rent and maintenance across a mixed portfolio
- Co-owners who want a shareable, link-based view of portfolio performance
Not a fit if:
- You need automated rent collection, online payments or bank reconciliation
- You need tenant screening, e-signed leases or maintenance ticket workflows
- You manage thousands of units and need role-based permissions and audit trails
Real-World Use Cases
Landlord with units in two cities. Filters the Overview page by location each month and compares Total Rent Collected with Maintenance Spend. When one area’s maintenance line rises several months in a row, Maintenance Cost by Property points to the units behind it, so a planned renovation can replace repeat call-outs.
Small management firm. Shares view-only links with owners. Before each owner call, the team filters the Financial page and uses Property Rent Ranking and Rent Amount by Payment Status instead of building a monthly report by hand.
Investor weighing commercial units. Reads Occupancy by Property Type together with Rent vs Maintenance by Property Type to check whether commercial units return more after upkeep than residential ones.
Advantages and Limitations
The clearest advantage is cost structure: a one-time purchase instead of a recurring per-unit subscription, with no seat fees when you add a bookkeeper or co-owner. It is also fast — the cards, charts and Search sheet already reference the Data sheet — and you own the file, so you can add columns or rebuild a page. If you want to build similar dashboards yourself, the Pivot Tables & Dashboards course on NextGenTemplates Academy covers the techniques, and Google’s pivot table documentation is a useful companion.
Limitations: the dashboard reports but does not transact — no payment gateway, automated reminders or tenant portal. Lease end dates appear on the Search sheet, but there is no automatic expiry alert; a conditional format or Apps Script trigger for leases ending within 60 days is a sensible addition. Very large portfolios will also slow Google Sheets down, at which point a database-backed tool is a better fit.
Best Practices
- Keep the Data sheet column order exactly as supplied — the charts and Search lookup depend on it.
- Use consistent spelling: “Apartment” and “apartment” will split into two categories.
- Record maintenance cost in the month it was incurred so the monthly trend stays accurate.
- Duplicate the file at the start of each financial year and archive the previous one.
- Share owner copies as view-only links so formulas are not edited by accident.
- Review Property Rent Ranking and Maintenance Cost by Property together each quarter.
Related Templates and Guides
On this site: the Property Management Dashboard in Google Sheets, the Property Portfolio Dashboard in Google Sheets, the Real Estate Property Tracker in Google Sheets and the Property Management Dashboard in HTML.
Related products: Property Portfolio Dashboard in Google Sheets, Rent Collection Data Entry System in Excel and the Real Estate & Property Bundle.
Frequently Asked Questions
What KPIs does the Tenant and Property Management Dashboard in Google Sheets track?
Four headline KPIs — Total Rent Collected, Maintenance Spend, Total Records and Avg Rent (Occupied) — plus page-level metrics such as Overdue Rent, Pending Rent, Occupancy Rate, Work Orders and Avg Maint Cost, supported by 15 charts.
How long does setup take?
Under 10 minutes. Make your own copy, paste your property records into the Data sheet in the same column order, and every card and chart updates.
Which slicers are included?
Each analysis page has four slicers. Year, Property Type and Location appear throughout; the Overview adds Occupancy Status, Financial adds Payment Status, Occupancy adds Month and Maintenance adds Maintenance Type.
Can I add my own property types and locations?
Yes. Enter new values in the Data sheet and the charts and slicers pick them up. Keep spelling consistent so categories do not split.
Does it work on mobile?
Yes. It opens in the Google Sheets mobile app. The KPI cards and Search sheet are the most practical pages on a small screen.
Can I share it with owners or accountants?
Yes. Share a view-only link so they see the live dashboard without being able to change formulas.
About the Author
Built by PK — Microsoft Certified Professional with 15+ years of Excel, Google Sheets and Power BI experience, and founder of NextGenTemplates. Every template is hand-built and tested before release.
Wrapping Up
If rent, occupancy and maintenance currently live in three separate files, the Tenant and Property Management Dashboard in Google Sheets brings them onto one set of linked pages with slicers, 15 charts and a Property ID lookup. Load your records, start with the Overview page and review the Financial page before each owner or accountant meeting.
Get the Tenant and Property Management Dashboard
📅 Last updated: October 2026