Managing customer relationships efficiently is essential for any business striving for growth. In today’s data-driven world, using key performance indicators (KPIs) allows companies to track and improve customer interactions. One of the most effective ways to monitor these KPIs is through a CRM KPI Dashboard in Google Sheets.
This article will guide you through everything you need to know about this powerful tool, including its features, KPIs, and best practices for use. We’ll also cover opportunities for improvement, provide actionable tips, and answer common questions about using a CRM KPI dashboard in Google Sheets.
What is a CRM KPI Dashboard in Google Sheets?
Click to buy CRM KPI Dashboard in Google Sheets
A CRM KPI Dashboard is a visual representation of key metrics that help businesses evaluate their customer relationship strategies. By using Google Sheets, a cloud-based spreadsheet tool, you can access and manage customer data in real time, share it easily with your team, and make data-driven decisions. The CRM KPI Dashboard lets you track metrics such as customer satisfaction, retention rates, sales performance, and more—all in one place.
Google Sheets offers flexibility, customization, and ease of use, making it the perfect tool for tracking CRM KPIs. With the template available for download, setting up and managing your CRM dashboard becomes a quick and efficient process.
Key Features of the CRM KPI Dashboard in Google Sheets
The CRM KPI Dashboard is designed to offer a complete and customizable solution for tracking various customer relationship metrics. The dashboard consists of six different worksheets, each serving a unique purpose. Here’s an overview of each sheet and its function:
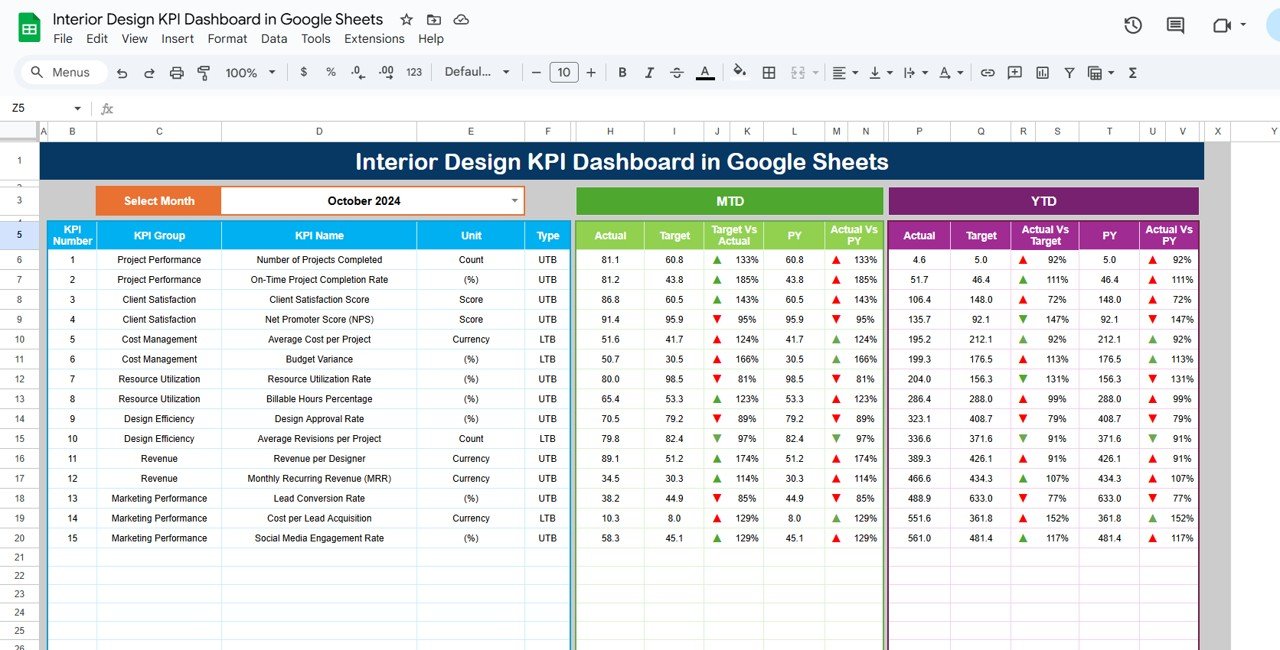
1. Dashboard Sheet Tab:
Main Overview: This is the central sheet where all the data from various KPIs is summarized and displayed.
Month Selector: On range D3, you can select the month using a drop-down menu. The data for the entire dashboard will update accordingly, making it easy to view monthly changes.
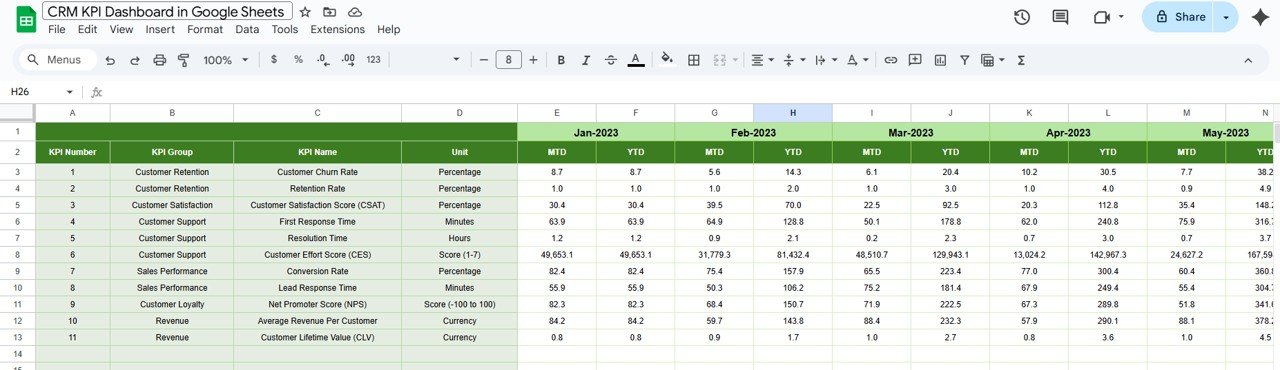
Data Display: The dashboard includes:
- MTD (Month-to-Date) data for actual values, targets, and previous year comparisons.
- YTD (Year-to-Date) data for the same metrics.
- Target vs Actual and Previous Year vs Actual comparisons, with conditional formatting (up/down arrows) to visually represent performance.

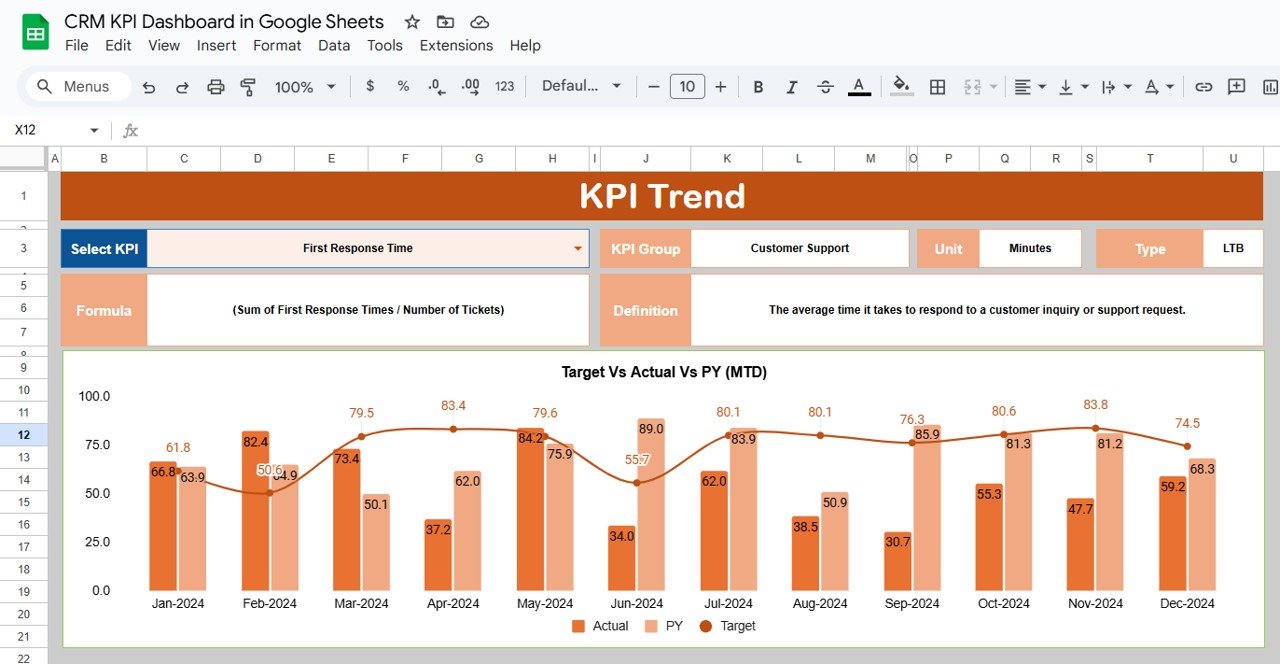
2. KPI Trend Sheet Tab:
Click to buy CRM KPI Dashboard in Google Sheets
KPI Tracking: In this tab, you can select a KPI from the dropdown menu (range C3). The sheet will display:
- KPI Group: The category to which the KPI belongs (e.g., Sales, Customer Satisfaction).
- Unit: The measurement unit used for the KPI (e.g., percentage, dollar amount).
- KPI Type: Whether the KPI requires a higher value (Upper the better) or a lower value (Lower the better).
- Formula and Definition: The formula to calculate the KPI and its definition to provide clarity on how it’s measured.
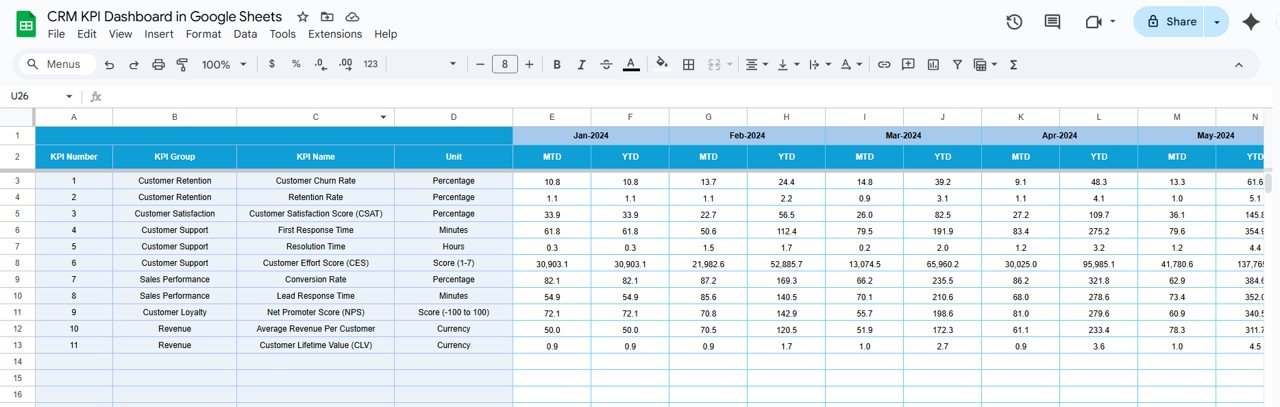
3. Actual Numbers Sheet Tab:
Click to buy CRM KPI Dashboard in Google Sheets
-
Data Entry: This sheet allows you to enter the actual performance numbers for MTD and YTD. Simply change the month in Range E1, and the sheet will update the data for that particular month.
-
Flexibility: You can input and adjust data for different months as required.
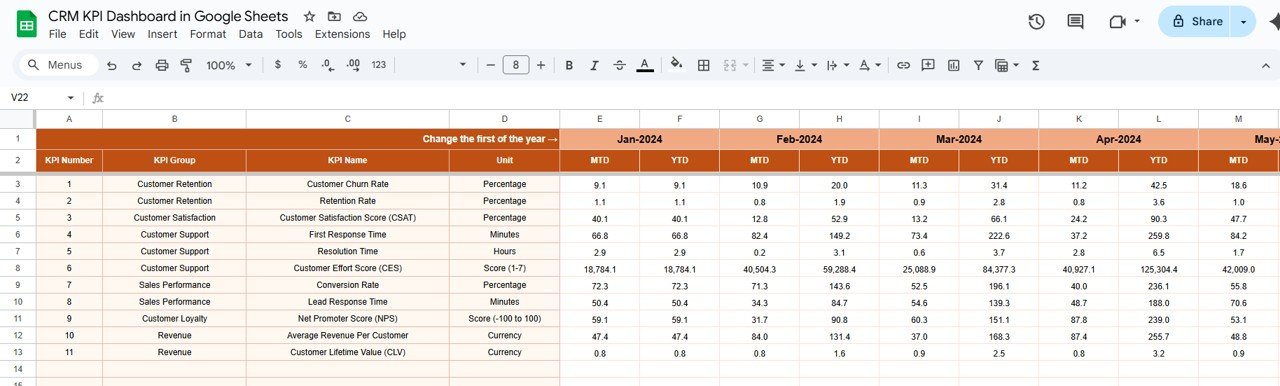
4. Target Sheet Tab:
Click to buy CRM KPI Dashboard in Google Sheets
-
Setting Targets: In this tab, you can enter the target numbers for each KPI on a monthly (MTD) and yearly (YTD) basis.
-
Goal Setting: This sheet is crucial for comparing actual performance to pre-established targets, providing insight into whether you’re meeting your goals.
5. Previous Year Numbers Sheet Tab:
-
Historical Comparison: This sheet allows you to enter the previous year’s numbers, which can be compared against current data to assess year-over-year growth.
-
Analysis: The ability to compare current and past performance helps identify trends and areas of improvement.
Click to buy CRM KPI Dashboard in Google Sheets
6. KPI Definition Sheet Tab:
KPI Breakdown: This tab is dedicated to defining each KPI used in the dashboard. You will find:
- KPI Name: The name of the indicator (e.g., Customer Retention Rate).
- KPI Group: The category under which the KPI falls.
- Unit: The unit of measurement (e.g., percentage, number).
- Formula: The exact formula used to calculate the KPI.
- Definition: A clear definition of the KPI and its relevance to CRM goals.

Click to buy CRM KPI Dashboard in Google Sheets
Advantages of Using a CRM KPI Dashboard in Google Sheets
Implementing a CRM KPI Dashboard in Google Sheets offers several advantages for businesses looking to improve their customer relationship management processes.
- Centralized Customer Data: The dashboard consolidates all CRM-related data in one place, making it easy for teams to access and monitor the metrics that matter most.
- Real-Time Performance Tracking: With the ability to update and refresh data in real time, the dashboard ensures that you are always working with the latest information.
- Customization and Flexibility: You can easily customize the dashboard to meet your specific business needs. Add new KPIs, adjust formulas, and tailor the design to fit your brand’s style.
- Improved Decision Making: With a clear view of your CRM performance, you can make better decisions about how to improve customer relationships and optimize your marketing and sales efforts.
- Easy Collaboration: Google Sheets makes it easy to share the dashboard with your team or stakeholders, ensuring that everyone is on the same page.
Opportunities for Improvement in CRM KPI Dashboard
Click to buy CRM KPI Dashboard in Google Sheets
While the CRM KPI Dashboard in Google Sheets is a powerful tool, there is always room for enhancement. Here are some opportunities for improvement:
- Automated Data Collection: Automating the collection of data from your CRM system or other tools would eliminate manual data entry, reducing errors and saving time.
- Advanced Visuals and Reporting: Incorporating more advanced charts, graphs, and visualizations could help teams interpret data more quickly and make insights more actionable.
- Alerting System for KPI Thresholds: Setting up automated alerts when KPIs go above or below certain thresholds would allow teams to act quickly when there are issues or opportunities for growth.
- Integration with Other Tools: By integrating with other platforms (like Salesforce, HubSpot, or email marketing tools), you can pull in data directly into your dashboard, streamlining your CRM workflow.
Best Practices for Using a CRM KPI Dashboard
Click to buy CRM KPI Dashboard in Google Sheets
To maximize the effectiveness of your CRM KPI Dashboard, consider implementing the following best practices:
- Set Clear CRM Goals: Define what you want to achieve with your CRM strategies. Setting specific, measurable goals will help you choose the right KPIs to track.
- Regularly Update and Review the Dashboard: Keep your dashboard current by entering data regularly and reviewing it often. This will ensure that you’re always working with the most up-to-date information.
- Focus on the Most Impactful KPIs: Not all KPIs are equally important. Focus on the metrics that directly impact your customer relationship goals and business outcomes.
- Utilize Conditional Formatting: Use conditional formatting to visually highlight key trends and performance issues. This makes it easier to spot areas that need attention.
- Share and Collaborate with Your Team: Ensure that all relevant team members have access to the dashboard and encourage collaboration to leverage everyone’s expertise in improving customer relationships.
Frequently Asked Questions (FAQs)
Click to buy CRM KPI Dashboard in Google Sheets
What are CRM KPIs?
CRM KPIs (Key Performance Indicators) are metrics that measure the effectiveness of your customer relationship management strategies, helping you assess customer satisfaction, retention, and overall business performance.
Why should I use a CRM KPI Dashboard in Google Sheets?
A CRM KPI Dashboard in Google Sheets offers a centralized, customizable, and real-time solution for tracking customer metrics, enabling better decision-making and team collaboration.
Can I automate data entry in the CRM KPI Dashboard?
While Google Sheets allows you to manually input data, you can automate data collection by integrating the dashboard with other CRM systems or data sources.
How often should I update my CRM KPI Dashboard?
To ensure accuracy and relevancy, update your CRM KPI Dashboard regularly, ideally at least once a week or after significant data changes.
Conclusion
Click to buy CRM KPI Dashboard in Google Sheets
A CRM KPI Dashboard in Google Sheets is an invaluable tool for any business aiming to improve its customer relationship strategies. With its real-time data tracking, customizability, and easy collaboration, it provides a clear view of your CRM performance, enabling better decision-making. By following the best practices and continuously refining your dashboard, you can optimize your customer relationships and drive business success.
Visit our YouTube channel to learn step-by-step video tutorials
Youtube.com/@NeotechNavigators