In the banking industry, key performance indicators (KPIs) are crucial for assessing financial health, customer satisfaction, operational efficiency, and more. A well-structured KPI dashboard helps bank managers monitor key metrics in real-time, making informed decisions that drive growth and ensure compliance.
In this article, we will explore the Banking KPI Dashboard in Google Sheets—a ready-to-use template designed to help banks track essential KPIs efficiently. This guide will cover the KPIs, their definitions, formulas, and whether they should be “lower the better” or “upper the better.”
Key Features of the Banking KPI Dashboard in Google Sheets
Before diving into the specifics of the KPIs, let’s first understand the key features of this dashboard template:
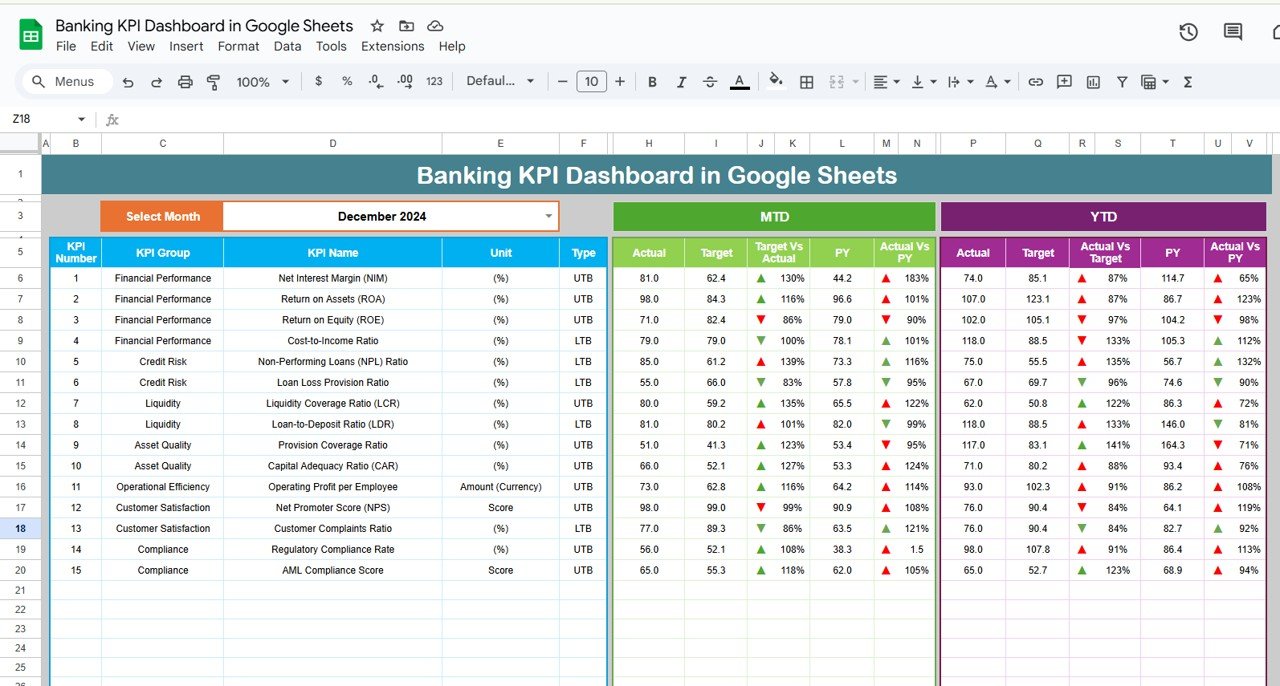
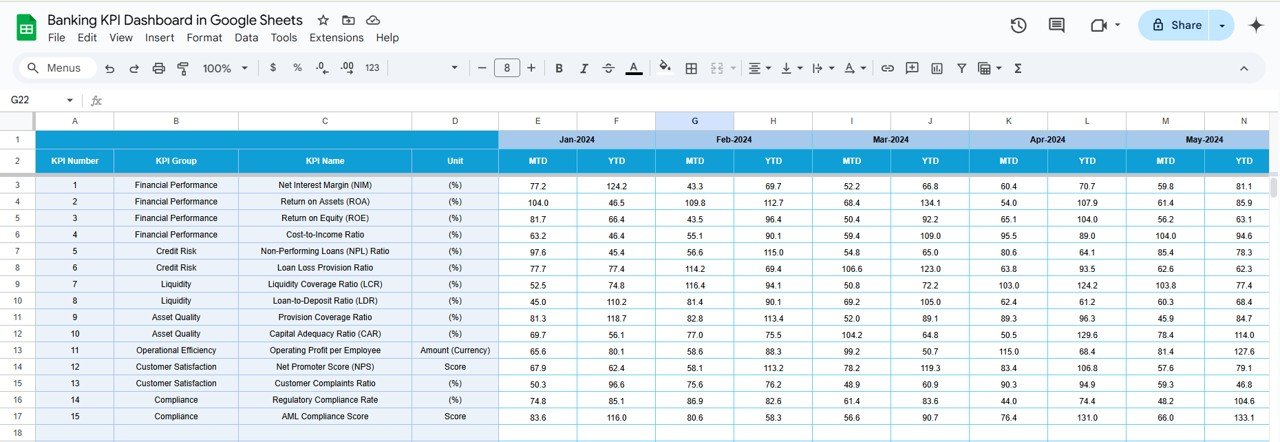
Dashboard Sheet Tab
-
The main sheet displays all KPI information.
-
Month Selection: Select the month from the drop-down in Range D3, and the entire dashboard updates accordingly.
-
MTD (Month-to-Date): Displays actual values, targets, and comparisons to previous year data with conditional formatting (up or down arrows).
-
YTD (Year-to-Date): Shows cumulative performance with comparisons to targets and previous year data.
Click to buy Banking KPI Dashboard in Google Sheets
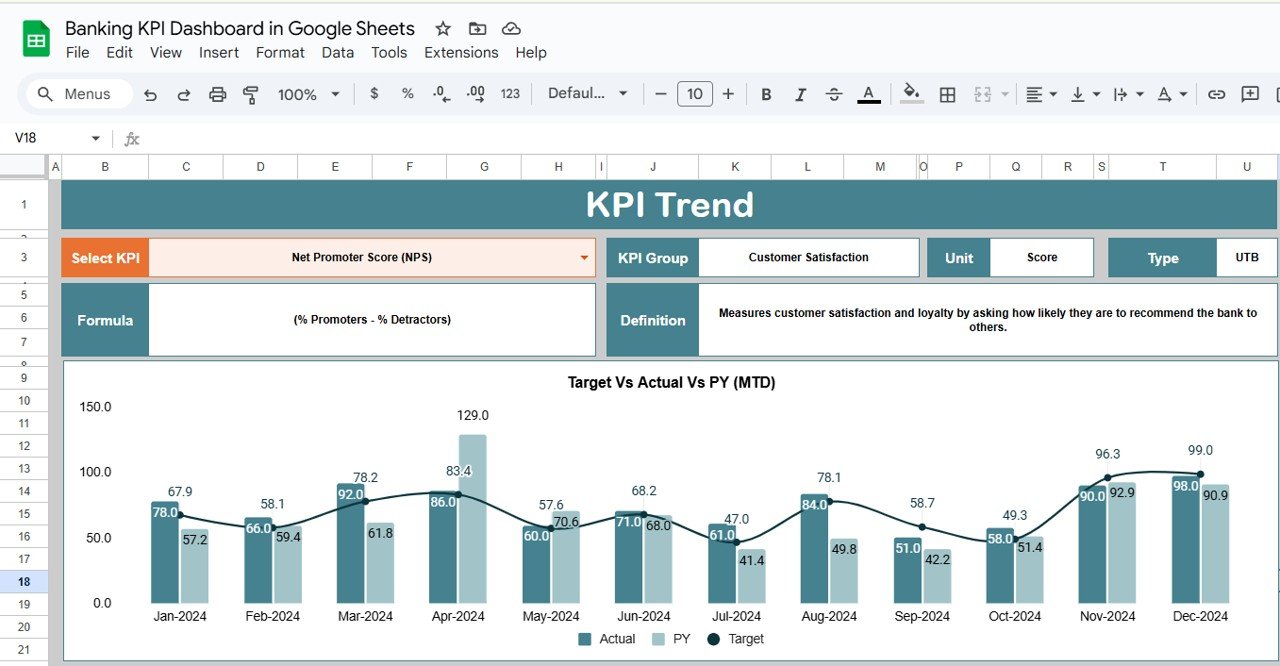
KPI Trend Sheet Tab
-
Allows selection of KPIs from the dropdown in Range C3.
-
Displays KPI group, unit of measure, type (Lower the Better or Upper the Better), formula, and KPI definition.
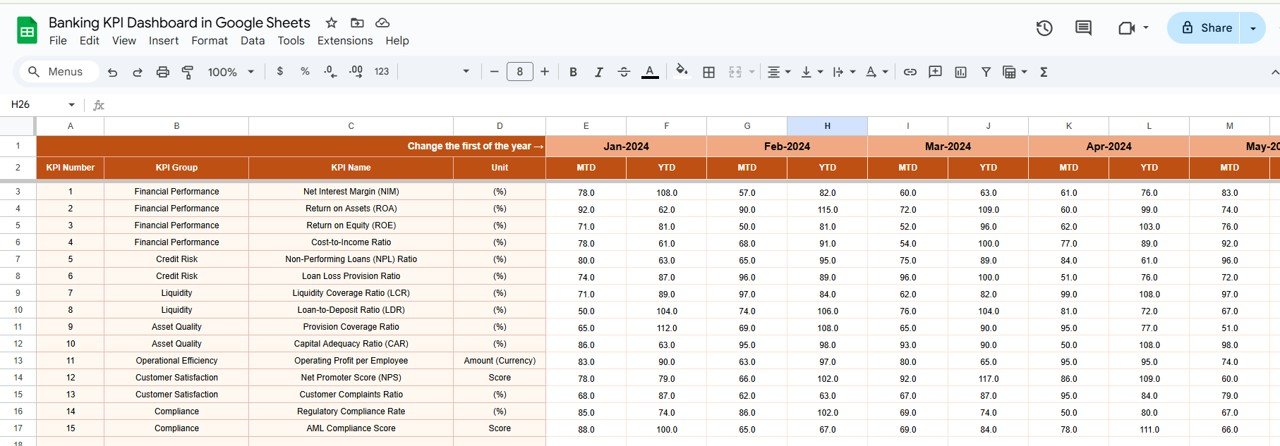
Actual Number Sheet Tab
-
Input actual numbers for both YTD and MTD for the selected month.
-
Change the month from Range E1 by entering the first month of the year.
Click to buy Banking KPI Dashboard in Google Sheets
Target Sheet Tab
-
Enter target values for each KPI for MTD and YTD.
-
Helps track performance against the set goals.
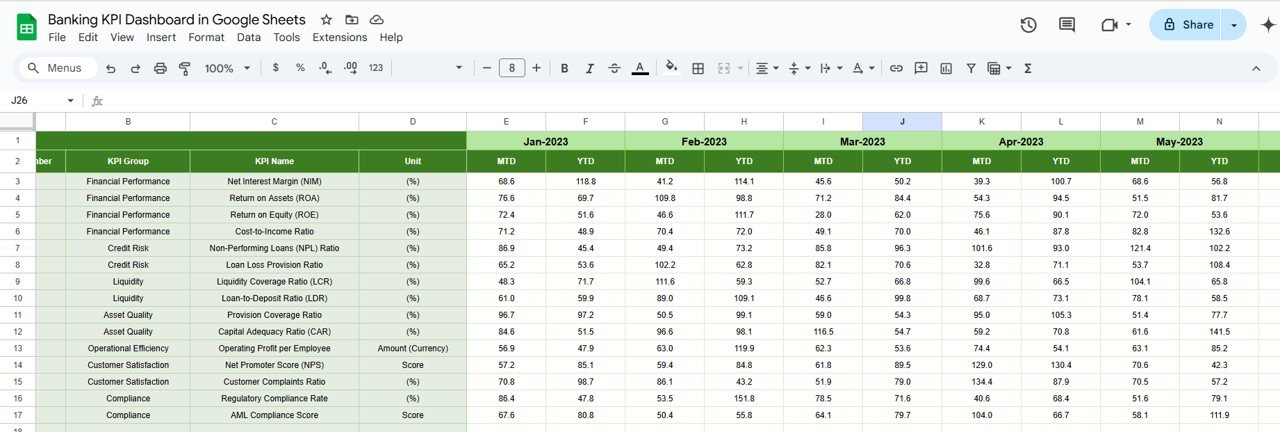
Previous Year Number Sheet Tab
-
Enter data for the previous year in the same format as the current year for accurate year-over-year comparison.
Click to buy Banking KPI Dashboard in Google Sheets
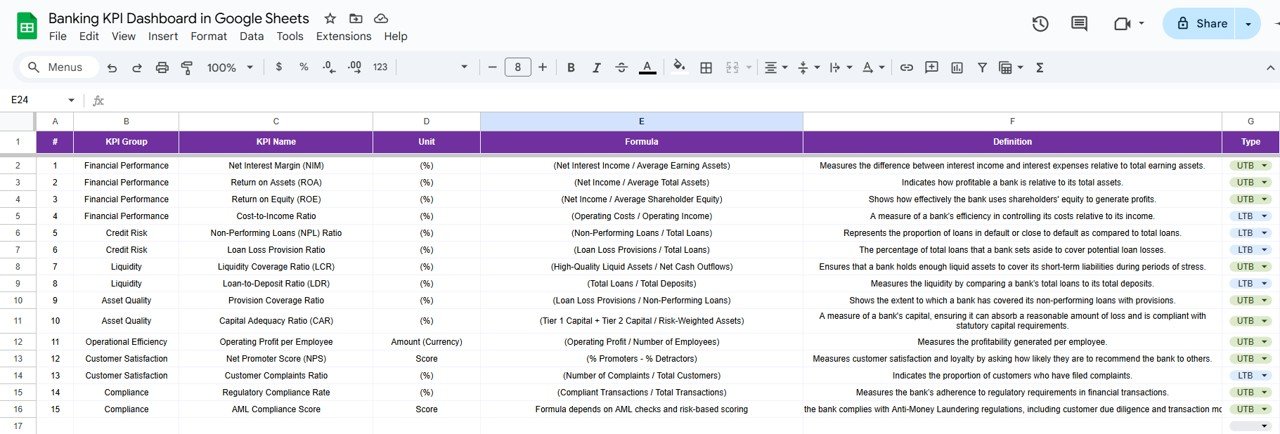
KPI Definition Sheet Tab
Provides detailed information for each KPI, including:
- KPI Name
- KPI Group
- Unit of Measure
- Formula used to calculate the KPI
- Definition explaining the KPI
Advantages of Using the Banking KPI Dashboard in Google Sheets
A Banking KPI Dashboard in Google Sheets offers several benefits to financial institutions. Here are the key advantages:
-
Real-Time Monitoring: Track KPIs in real-time for quick decision-making and responsive action.
-
Customizable Templates: Google Sheets allows flexibility, enabling you to adjust KPIs, formulas, and layout as per your bank’s specific needs.
-
Cost-Effective: Google Sheets is free, making it an affordable option for banks of all sizes.
-
Cloud-Based Collaboration: Teams can collaborate in real-time, ensuring everyone has the most up-to-date information.
-
Accessibility: Access the dashboard from any device with an internet connection, allowing for flexible monitoring.
Opportunities for Improvement in the Banking KPI Dashboard
Click to buy Banking KPI Dashboard in Google Sheets
While the Banking KPI Dashboard in Google Sheets is already an effective tool, there are areas for enhancement:
Automating Data Entry:
- Current Challenge: Manual data entry can be time-consuming and prone to error.
- Opportunity: Integrate with external systems (e.g., banking software, CRM) to automate data entry and reduce human error.
Advanced Visualizations:
- Current Challenge: The dashboard currently uses basic charts and graphs.
- Opportunity: Add more advanced visualizations, such as sparklines, heatmaps, and interactive charts, to make data easier to understand.
Customizable Reporting:
- Current Challenge: Reporting options are limited.
- Opportunity: Expand reporting capabilities by adding options for customizable reports (e.g., PDF exports or email summaries).
Best Practices for Using the Banking KPI Dashboard
To get the most out of the Banking KPI Dashboard in Google Sheets, consider these best practices:
-
Update Data Regularly: Ensure that data is updated at least monthly for accurate and relevant insights.
-
Set Realistic Targets: Base your KPIs on historical data and industry benchmarks to set achievable goals.
-
Collaborate with Key Stakeholders: Share the dashboard with relevant departments to align everyone’s goals and performance metrics.
-
Utilize Conditional Formatting: Use color-coded arrows or indicators to visualize trends and performance.
-
Monitor Key Metrics: Regularly focus on critical KPIs like NIM, ROA, and NPL to assess financial health and risk.
Conclusion
The Banking KPI Dashboard in Google Sheets is an invaluable tool for tracking key performance metrics in the banking industry. By using this dashboard, banks can monitor their financial health, operational efficiency, and customer satisfaction in real-time, leading to informed decision-making and improved performance.
Frequently Asked Questions (FAQs)
Click to buy Banking KPI Dashboard in Google Sheets
What is a KPI in banking? A KPI (Key Performance Indicator) is a measurable value that indicates how effectively a bank is achieving its business objectives. Common KPIs in banking include NIM, ROA, and loan-to-deposit ratio.
How can I customize my Banking KPI Dashboard? You can customize the dashboard by adding or removing KPIs, adjusting formulas, and modifying the layout to fit your bank’s specific requirements.
How do I enter data into the Banking KPI Dashboard? Enter actual numbers for MTD and YTD in the relevant sheets (Actual Numbers Sheet, Target Sheet, Previous Year Numbers Sheet) for each month.
Can I automate the data entry process? Yes, you can integrate the dashboard with external systems like CRM or banking software to automate data entry.
Which KPIs should I track in my bank? Essential KPIs in banking include Net Interest Margin (NIM), Return on Assets (ROA), Cost-to-Income Ratio, Loan-to-Deposit Ratio, and Non-Performing Loan Ratio.
Visit our YouTube channel to learn step-by-step video tutorials