In the fast-paced world of mass media, measuring and tracking key performance indicators (KPIs) is essential for success. The Mass Media KPI Dashboard in Google Sheets is a ready-to-use template designed to help mass media companies monitor and optimize their operations. From audience engagement to ad performance, this dashboard covers all critical KPIs needed to evaluate media success.
In this article, we’ll explore the Mass Media KPI Dashboard in Google Sheets, its key features, and the KPIs it tracks to improve media performance.
Key Features of the Mass Media KPI Dashboard in Google Sheets
Below are the key features of this KPI dashboard template:
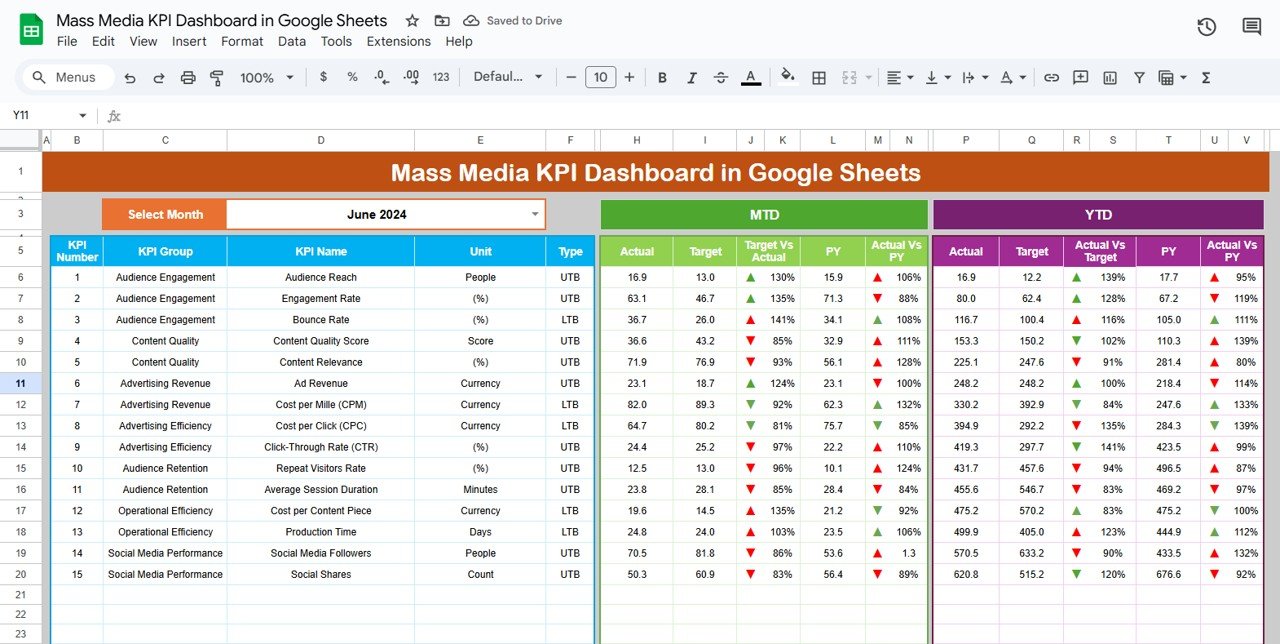
1. Dashboard Sheet Tab
This is the main sheet where all KPI data is displayed.
-
Month Selection: In Range D3, select the month from the drop-down menu, and the dashboard will update to show data for that month.
-
MTD (Month-to-Date): Displays actual numbers, target values, and comparisons with previous year data using conditional formatting (up or down arrows).
-
YTD (Year-to-Date): Shows cumulative performance with comparisons to target and previous year data.
Click to buy Mass Media KPI Dashboard in Google Sheets
2. KPI Trend Sheet Tab
-
Select KPIs from the dropdown in Range C3.
-
Displays KPI group, unit of measure, type (Lower the Better or Upper the Better), formula, and KPI definition.

3. Actual Number Sheet Tab
-
Input actual numbers for MTD and YTD for the selected month.
-
The month selection is available in Range E1, where you input the first month of the year.

Click to buy Mass Media KPI Dashboard in Google Sheets
4. Target Sheet Tab
-
Enter target values for each KPI for MTD and YTD.
-
Helps track performance against the set goals.

5. Previous Year Number Sheet Tab
-
Enter previous year’s data for year-over-year comparisons.
-
This data should be entered in the same format as the current year to maintain consistency.

Click to buy Mass Media KPI Dashboard in Google Sheets
6. KPI Definition Sheet Tab
This sheet contains detailed information for each KPI, including:
- KPI Name
- KPI Group
- Unit of Measure
- Formula for KPI Calculation
- Definition of the KPI

Advantages of Using the Mass Media KPI Dashboard in Google Sheets
The Mass Media KPI Dashboard in Google Sheets offers several benefits to media organizations:
-
Real-Time Tracking: Monitor KPIs in real-time to make timely adjustments to your media strategy.
-
Customizable: Adjust the dashboard to track KPIs that are most relevant to your media campaigns and goals.
-
Cost-Effective: Google Sheets is a free tool, making it an affordable option for media companies to track their performance.
-
Collaboration: Share the dashboard with your team to work collaboratively on media strategies and performance analysis.
-
Accessibility: The dashboard is accessible from any device with internet connectivity, making it easy to stay updated on performance metrics.
Opportunities for Improvement in the Mass Media KPI Dashboard
Click to buy Mass Media KPI Dashboard in Google Sheets
While the Mass Media KPI Dashboard in Google Sheets is a powerful tool, there are opportunities for improvement:
Automating Data Entry:
- Current Challenge: Manual data entry can be time-consuming and prone to errors.
- Opportunity: Integrating the dashboard with advertising platforms and analytics tools can automate data entry and reduce errors.
Advanced Visualizations:
- Current Challenge: Basic visualizations might not provide deep insights.
- Opportunity: Add advanced visualizations, such as bar charts, pie charts, or interactive dashboards, to make data interpretation easier.
Customizable Reporting:
- Current Challenge: The dashboard offers basic reporting capabilities.
- Opportunity: Expand reporting features by allowing users to generate customized reports, such as downloadable PDFs or automated email summaries.
Best Practices for Using the Mass Media KPI Dashboard
To get the most out of the Mass Media KPI Dashboard in Google Sheets, consider these best practices:
-
Update Regularly: Ensure that the data is updated at least once a week to keep track of real-time media performance.
-
Set Clear Targets: Use historical data and industry standards to set achievable KPIs for your media campaigns.
-
Analyze Trends: Regularly review KPI trends to identify areas of improvement and optimize your media strategies.
-
Share Insights: Share the dashboard with relevant stakeholders to provide transparency and align on media goals.
-
Use Conditional Formatting: Leverage color coding or arrows to quickly identify areas of concern, such as declining ad performance or low engagement rates.
Conclusion
The Mass Media KPI Dashboard in Google Sheets is an essential tool for tracking and optimizing key media performance metrics. By monitoring important KPIs like audience reach, ad engagement, and revenue per user, media companies can make data-driven decisions to improve their strategies and achieve their business objectives.
Frequently Asked Questions (FAQs)
What is a KPI in mass media?
A KPI (Key Performance Indicator) in mass media is a measurable value used to evaluate the success of media campaigns and content. Common KPIs include audience reach, ad engagement, and CTR.
How do I customize my Mass Media KPI Dashboard?
The dashboard is fully customizable. You can add, remove, or adjust KPIs, formulas, and data sources to fit your specific media goals.
How do I enter data into the Mass Media KPI Dashboard?
Simply input actual numbers for MTD and YTD in the relevant sheets (Actual Numbers Sheet, Target Sheet, Previous Year Numbers Sheet) for each month.
Can I automate data entry?
Yes, you can integrate the dashboard with advertising platforms and analytics tools to automate data entry and reduce manual effort.
Which KPIs should I track in mass media?
Essential KPIs for mass media include audience reach, ad engagement rate, revenue per user, and cost per thousand impressions.
Visit our YouTube channel to learn step-by-step video tutorials