In today’s fast-paced world, customer service plays a crucial role in defining the success of any business. A well-designed customer service dashboard helps track performance, monitor service levels, and improve overall customer satisfaction. In this article, we will walk you through how to create a Customer Service Dashboard in Google Sheets that offers easy tracking of key metrics such as ticket volume, satisfaction score, resolution times, and more. The dashboard will allow businesses to analyze customer service data effectively and provide insights that can drive improvements.
What is a Customer Service Dashboard in Google Sheets?
A Customer Service Dashboard in Google Sheets is a tool that helps businesses visualize and track the performance of their customer service team. It compiles essential data from various customer service interactions, such as the number of tickets, resolution times, customer satisfaction scores, and more. By leveraging Google Sheets, this dashboard offers a simple and cost-effective solution to manage customer service performance.
In this guide, we will focus on a ready-to-use Customer Service Dashboard template in Google Sheets that consists of two main components: the Dashboard Sheet Tab and the Data Sheet Tab. Let’s take a closer look at these sheets.
Overview of the Customer Service Dashboard Structure
Click to buy Customer Service Dashboard In Google Sheets
The dashboard is divided into two sheets:
- Dashboard Sheet Tab: This sheet is where you will visualize key performance indicators (KPIs) using different types of cards and charts.
- Data Sheet Tab: This is where all the raw data is inputted, which will then be analyzed and represented visually in the dashboard.
1. Dashboard Sheet Tab
The Dashboard Sheet is designed to present customer service performance in a visual format using cards and various charts. Here’s a breakdown of the cards and charts included in this sheet:
Cards on the Dashboard
These cards give an at-a-glance overview of important metrics:
-
# of Tickets: Displays the total number of customer service tickets raised within a specific time period.
-
Avg. Satisfaction Score: Shows the average satisfaction score based on customer feedback for the given time frame.
-
Avg. Resolution Days: This card calculates the average number of days taken to resolve customer issues.
Charts on the Dashboard
The dashboard also includes several charts that provide a deeper analysis of different customer service aspects. These charts include:
-
Avg. Satisfaction Score by Channel: A bar chart that displays customer satisfaction scores across different channels like email, phone, or chat.
-
# of Tickets by Issue Type: A bar chart showing how many tickets are raised for each type of issue, helping you identify common problems.
-
# of Tickets by Priority: A donut chart visualizing the distribution of tickets based on their priority level (e.g., Low, Medium, High).
-
Avg. Resolution Days by Issue Type: A column chart that provides insights into the average resolution days for different types of issues.
-
Total Reopened Cases by Region: A line chart showing trends in reopened cases by region, helping identify regional performance differences.
-
Avg. Satisfaction Score by Customer Sentiment: A bar chart that correlates customer sentiment with their satisfaction score, offering insights into customer emotions.
-
First Contact Resolution by Issue Type: An area chart that tracks the percentage of issues resolved in the first contact across different issue types.
-
Avg. Resolution Days by Assigned Agent: A column chart showing the average resolution days for each agent, helping identify top performers and areas for improvement.

Click to buy Customer Service Dashboard In Google Sheets
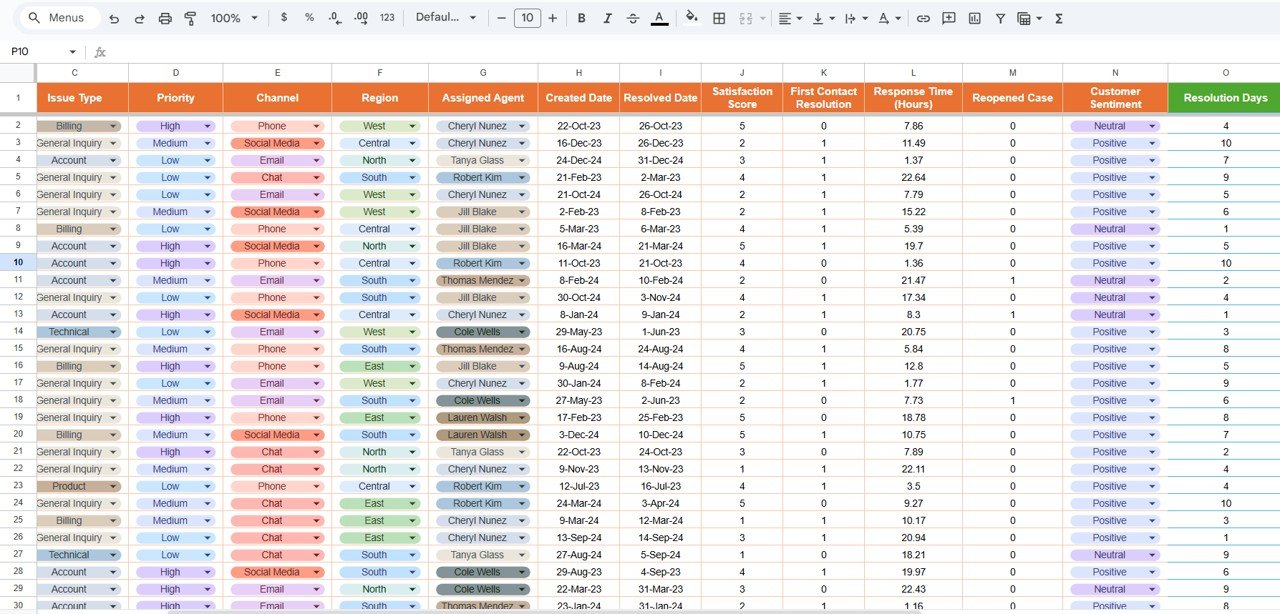
2. Data Sheet Tab
The Data Sheet serves as the backbone of the dashboard. Here, you input all customer service interaction data, which is then processed and displayed in the dashboard. The columns in the data sheet typically include:
-
Ticket ID: A unique identifier for each ticket.
-
Customer Name: The name of the customer who raised the ticket.
-
Issue Type: The type of issue the customer is facing (e.g., Technical Issue, Billing Issue).
-
Priority: The priority level of the ticket (Low, Medium, High).
-
Channel: The communication channel through which the ticket was raised (e.g., Email, Chat, Phone).
-
Region: The geographical region where the customer is located.
-
Assigned Agent: The customer service representative assigned to resolve the ticket.
-
Created Date: The date when the ticket was created.
-
Resolved Date: The date when the ticket was resolved.
-
Satisfaction Score: The rating provided by the customer based on their satisfaction with the resolution.
-
First Contact Resolution: Whether the issue was resolved in the first contact (Yes/No).
-
Response Time (Hours): The time taken to respond to the customer’s query.
-
Reopened Case: Whether the issue was reopened after being marked as resolved.
-
Customer Sentiment: The sentiment of the customer (Positive, Neutral, Negative).
-
Resolution Days: The number of days taken to resolve the issue.
This data is essential for analyzing performance and generating insights in the dashboard.
Click to buy Customer Service Dashboard In Google Sheets
Advantages of a Customer Service Dashboard in Google Sheets
A well-structured Customer Service Dashboard in Google Sheets offers several benefits that can help businesses improve their customer support processes:
-
Real-Time Insights: The dashboard offers real-time tracking of customer service metrics, enabling managers to make timely decisions.
-
Data-Driven Decisions: With clear visual representations of data, managers can quickly identify trends, bottlenecks, and areas for improvement.
-
Easy Collaboration: Since Google Sheets is cloud-based, teams can easily collaborate and access the data from anywhere.
-
Cost-Effective: Unlike other customer service software, Google Sheets provides a free platform for creating custom dashboards.
-
Customizable: You can tailor the dashboard to suit your business’s specific needs by adding or removing metrics and charts.
Opportunity for Improvement in the Customer Service Dashboard
Although the Customer Service Dashboard in Google Sheets is highly effective, there are always opportunities for improvement. Here are some suggestions:
-
Incorporate More Data Sources: If you’re using other customer service platforms like Zendesk or Freshdesk, integrating data from those sources into the dashboard can provide a more holistic view of performance.
-
Automate Data Collection: Set up automatic data feeds from your customer service tools into Google Sheets to save time and reduce manual data entry.
-
Expand the Sentiment Analysis: Incorporate advanced sentiment analysis tools to better understand customer emotions and sentiments at a deeper level.
-
Add Predictive Analytics: Integrating predictive analytics can help forecast future trends and performance, allowing businesses to proactively address potential issues.
Best Practices for the Customer Service Dashboard
Click to buy Customer Service Dashboard In Google Sheets
To make the most out of your Customer Service Dashboard in Google Sheets, it’s essential to follow some best practices:
- Keep Data Clean and Consistent: Ensure that all data entered in the Data Sheet is accurate and consistent. Inconsistent or incorrect data can lead to misleading insights.
- Use Conditional Formatting: Apply conditional formatting to highlight critical data points such as high-resolution days or low satisfaction scores, making it easier to spot issues.
- Update Regularly: Keep the data in the dashboard updated regularly to ensure that it reflects current performance and trends.
- Set Clear KPIs: Focus on the most important metrics that align with your customer service goals. Too many metrics can overwhelm the user and make it harder to draw conclusions.
- Involve the Team: Get feedback from customer service agents and managers to ensure that the dashboard is serving its intended purpose and providing valuable insights.
Conclusion
Creating a Customer Service Dashboard in Google Sheets provides a valuable tool for businesses looking to monitor and improve their customer service operations. By visualizing key metrics, businesses can easily track performance, identify areas for improvement, and make data-driven decisions to enhance customer satisfaction.
With the right data inputs, charts, and best practices, this dashboard becomes an essential part of a business’s customer service strategy, ensuring that teams deliver top-notch service consistently.
Frequently Asked Questions (FAQs)
Click to buy Customer Service Dashboard In Google Sheets
1. What is a Customer Service Dashboard in Google Sheets?
A Customer Service Dashboard in Google Sheets is a visual tool used to track key customer service metrics, such as ticket volume, satisfaction scores, and resolution times.
2. How do I create a Customer Service Dashboard in Google Sheets?
To create a Customer Service Dashboard, you need to input data into a Google Sheets template, which can then be displayed in the form of charts and cards that represent key performance indicators.
3. Can I customize the dashboard?
Yes, the Google Sheets dashboard is highly customizable. You can add or remove metrics, change chart types, and modify the layout to suit your needs.
4. How can I improve my customer service performance using the dashboard?
By analyzing the data from the dashboard, you can identify trends, bottlenecks, and areas for improvement in your customer service process, allowing you to take action to improve overall performance.
5. Is Google Sheets free to use for creating a dashboard?
Yes, Google Sheets is a free, cloud-based tool, making it an affordable option for businesses of all sizes to create a customer service dashboard.
Visit our YouTube channel to learn step-by-step video tutorials
Youtube.com/@NeotechNavigators
Click to buy Customer Service Dashboard In Google Sheets