In the microfinance industry, monitoring key performance indicators (KPIs) is essential for assessing financial health, improving operational efficiency, and ensuring the sustainability of financial services for underserved populations. The Microfinance KPI Dashboard in Google Sheets is a powerful tool designed to help microfinance institutions (MFIs) track critical metrics in real-time. This ready-to-use template enables organizations to monitor various KPIs, including loan performance, customer satisfaction, and financial sustainability, all in one place.
In this article, we will explore the Microfinance KPI Dashboard in Google Sheets, its features, and how it can help microfinance institutions improve performance, track key metrics, and make data-driven decisions.
What is the Microfinance KPI Dashboard in Google Sheets?
The Microfinance KPI Dashboard in Google Sheets is an interactive template that allows microfinance institutions to track, analyze, and visualize important financial and operational metrics. This dashboard is built in Google Sheets for easy data entry, collaboration, and real-time updates, making it an ideal solution for managing key performance indicators in microfinance.
The dashboard consists of six main worksheets, each focused on a specific aspect of performance. The template tracks KPIs such as loan portfolio quality, client growth, financial sustainability, and customer satisfaction.
Key Features of the Microfinance KPI Dashboard in Google Sheets
This dashboard includes six worksheets, each designed to track different KPIs relevant to microfinance operations:
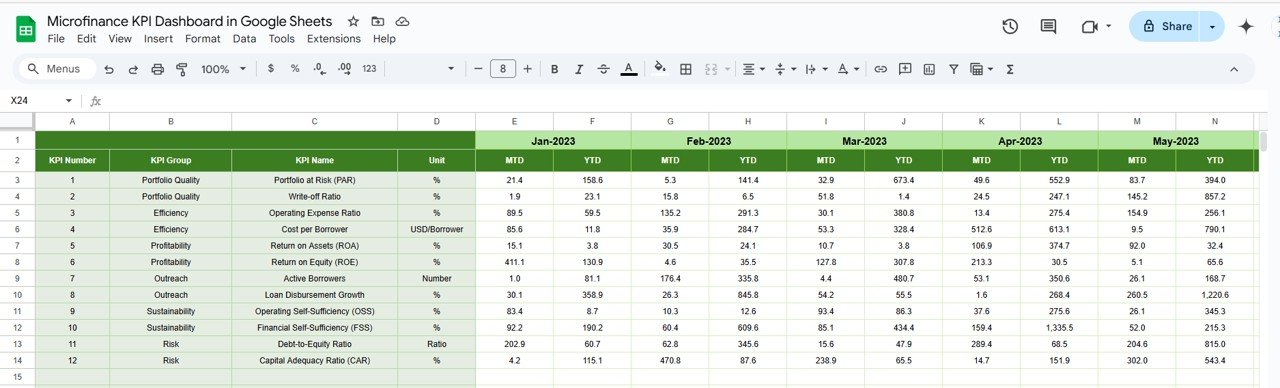
1. Dashboard Sheet Tab
The Dashboard Sheet is the main sheet of the template and provides an overview of all the KPIs. The key features of this sheet include:
MTD (Month-to-Date) and YTD (Year-to-Date) Metrics:
- The dashboard shows MTD and YTD actual data, target values, and previous year (PY) data for comparison.
- Conditional Formatting: Arrows (up/down) indicate whether performance is above or below target and PY values.
Key Metrics Displayed:
- MTD Actual: Actual performance for the selected month.
- MTD Target: The target value for the selected month.
- PY vs Actual: Comparison of the current month’s data with the same period from the previous year.
- YTD Actual: The cumulative actual performance for the current year.
- YTD Target vs Actual: Comparison of the YTD target with actual performance.

Click to buy Microfinance KPI Dashboard in Google Sheets
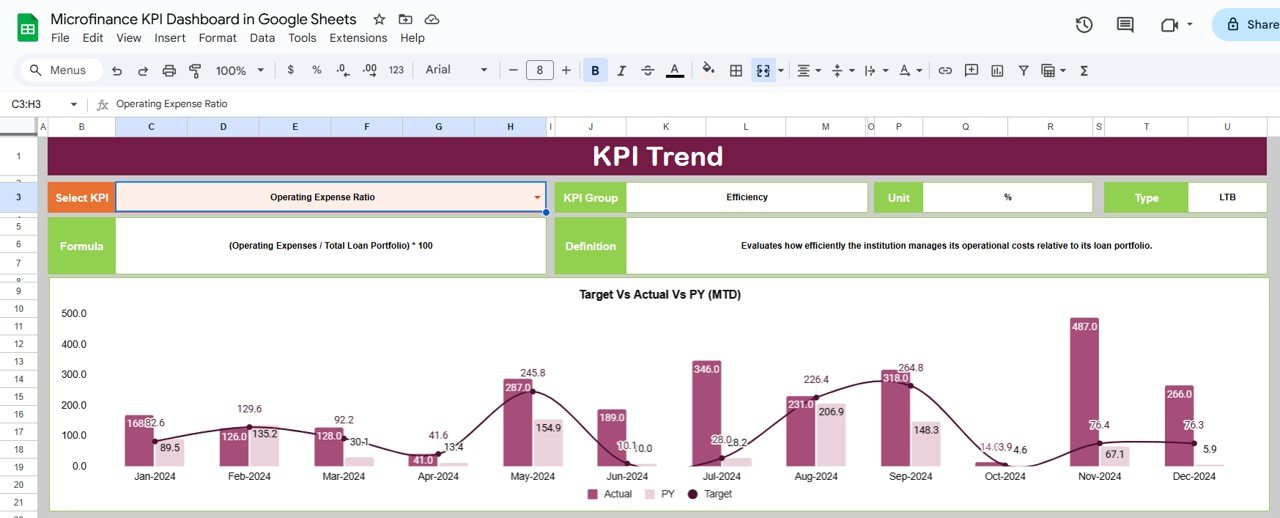
2. KPI Trend Sheet Tab
The KPI Trend Sheet helps you track the performance of individual KPIs over time:
KPI Selection Dropdown:
You can select any KPI from the dropdown in C3, and the sheet will display:
- KPI Group: The category of the KPI (e.g., loan performance, client growth, operational efficiency).
- Unit of KPI: The unit of measurement for the KPI (e.g., percentage, dollars, number of clients).
- Type of KPI: Whether the KPI is “Lower the Better” or “Upper the Better.”
- Formula of KPI: How the KPI is calculated.
- KPI Definition: A description of what each KPI tracks and its relevance to microfinance performance.
Click to buy Microfinance KPI Dashboard in Google Sheets
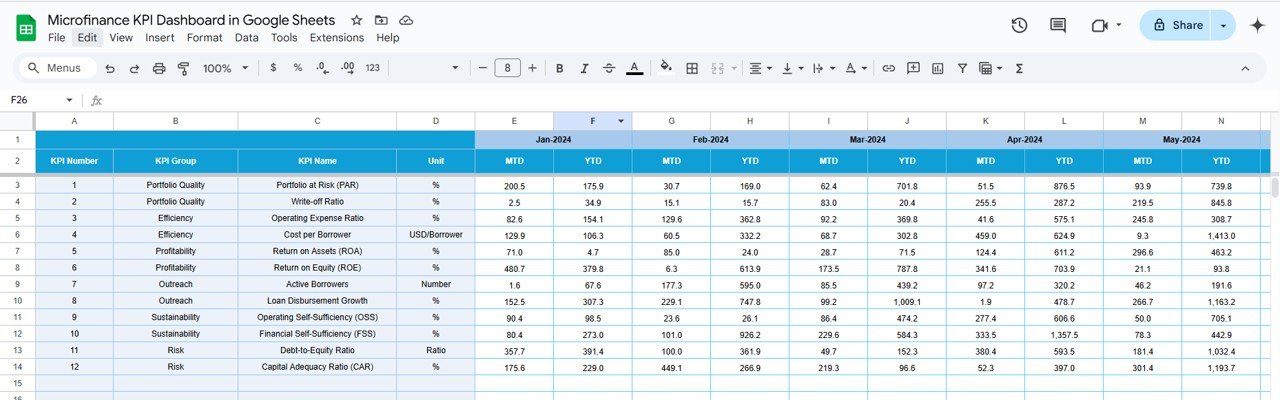
3. Actual Number Sheet Tab
The Actual Number Sheet is where you enter the actual data for MTD and YTD. This sheet updates the dashboard based on the data entered.
-
Monthly Data Entry:
Enter the actual data for each KPI for the selected month (indicated in E1), ensuring the dashboard stays up to date.
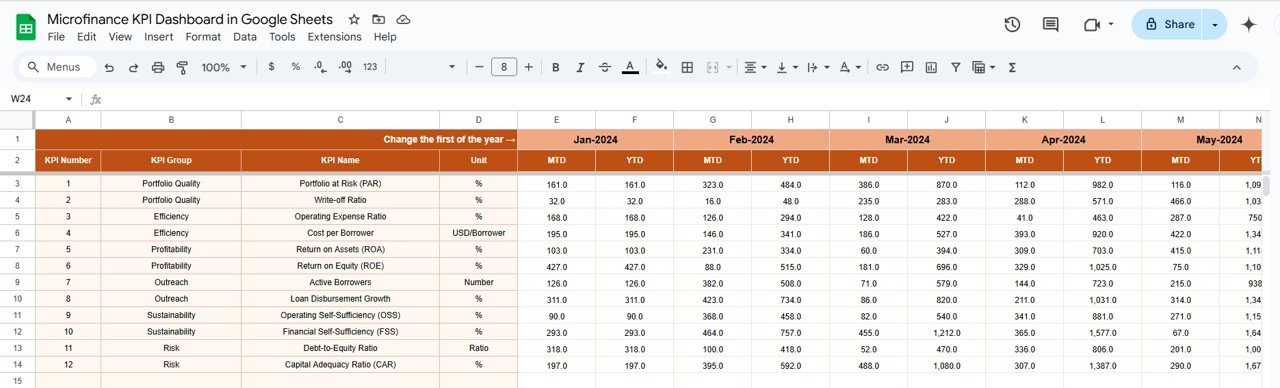
4. Target Sheet Tab
The Target Sheet allows you to enter the target values for each KPI, both MTD and YTD. These targets are used to measure performance and assess if goals are being met.
-
Target Data Entry:
You input your target values for each KPI, which will be compared with actual performance in the dashboard.
Click to buy Microfinance KPI Dashboard in Google Sheets
5. Previous Year Number Sheet Tab
The Previous Year Number Sheet stores the data from the previous year for comparison purposes. This enables you to assess year-over-year performance and identify trends.
-
Previous Year Data Entry:
Enter last year’s data for each KPI to compare it with current performance and track progress.
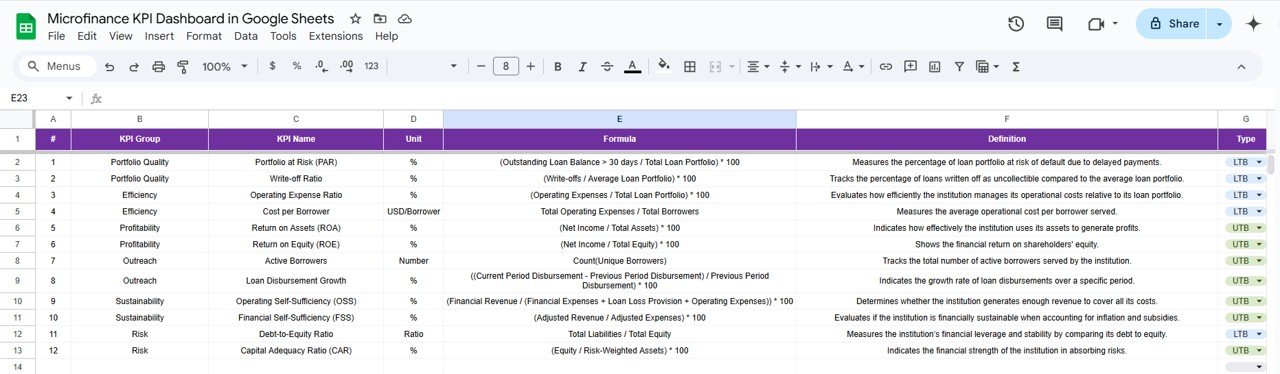
6. KPI Definition Sheet Tab
The KPI Definition Sheet provides detailed definitions for each KPI, ensuring that all stakeholders understand what each metric tracks and how it’s calculated.
-
KPI Definitions:
In this sheet, each KPI is defined by its name, group, unit, formula, and explanation of its significance.
Click to buy Microfinance KPI Dashboard in Google Sheets
Advantages of Using the Microfinance KPI Dashboard
-
Comprehensive Tracking:
Track all essential KPIs related to your microfinance operations in one place, ensuring a clear view of your institution’s performance. -
Real-Time Data Updates:
The dashboard updates automatically as you input new data, providing up-to-date insights for decision-making. -
Customizable for Your Needs:
The dashboard is customizable, allowing you to modify KPIs and tailor it to your specific microfinance institution’s needs. -
Visual Insights:
With charts, conditional formatting, and color-coded indicators, the dashboard provides easy-to-understand visual feedback on your performance. -
Data-Driven Decisions:
By tracking key metrics, the dashboard helps you make informed decisions to optimize operations, improve client service, and maintain financial sustainability.
Best Practices for Using the Microfinance KPI Dashboard
-
Update Data Regularly:
Ensure that data is updated regularly to maintain the accuracy of the dashboard and ensure timely decision-making. -
Monitor Critical KPIs:
Focus on the most important KPIs such as portfolio at risk, client retention, and loan recovery rate, which directly impact the financial health of your microfinance institution. -
Review Year-over-Year Trends:
Compare current data with previous year’s data to assess long-term progress and identify areas where improvements are needed. -
Leverage Insights for Strategic Planning:
Use the insights gained from the dashboard to refine your microfinance strategies, improve operational efficiency, and enhance client satisfaction.
Frequently Asked Questions (FAQs)
Click to buy Microfinance KPI Dashboard in Google Sheets
1. How do I update the Microfinance KPI Dashboard?
Simply enter the actual data for each KPI in the Actual Number Sheet, and the dashboard will automatically update with the latest performance metrics.
2. Can I track multiple microfinance portfolios with this dashboard?
Yes, the dashboard can be customized to track multiple portfolios by adding new sections or columns specific to each portfolio.
3. How can I compare performance against previous year data?
Enter the data from the previous year in the Previous Year Number Sheet to make year-over-year comparisons and assess progress.
Conclusion
The Microfinance KPI Dashboard in Google Sheets is a valuable tool for monitoring and optimizing the performance of microfinance institutions. By tracking key metrics such as loan performance, client growth, and operational efficiency, this dashboard helps institutions make informed decisions, improve financial health, and ensure long-term sustainability. Whether you are managing a small microfinance organization or a large network, this template provides a comprehensive solution for efficient performance management.
Visit our YouTube channel to learn step-by-step video tutorials
Youtube.com/@NeotechNavigators
Watch the step-by-step video Demo: