In the era of digital transformation, companies are adopting advanced technologies to improve business processes, drive innovation, and stay competitive. Tracking key performance indicators (KPIs) related to digital transformation is essential for measuring success and aligning strategic goals. The Digital Transformation KPI Dashboard in Google Sheets is a ready-to-use template designed to help organizations monitor the progress of their digital transformation initiatives.
In this article, we’ll guide you through the features and benefits of the Digital Transformation KPI Dashboard, explaining how it can streamline the tracking of essential digital KPIs.
What is the Digital Transformation KPI Dashboard in Google Sheets?
The Digital Transformation KPI Dashboard in Google Sheets is a powerful tool that helps businesses track and measure the performance of their digital transformation initiatives. The dashboard provides a comprehensive view of key metrics such as system adoption, digital sales, operational efficiency, and customer experience.
With this dashboard, you can easily input actual and target data for various KPIs, visualize trends, and gain insights into your digital transformation journey. The dashboard comes with several worksheets and customizable features, making it ideal for companies looking to optimize their digital initiatives.
Key Features of the Digital Transformation KPI Dashboard
The Digital Transformation KPI Dashboard includes several important worksheets, each designed to track different aspects of the digital transformation process. Below are the key features of each worksheet:
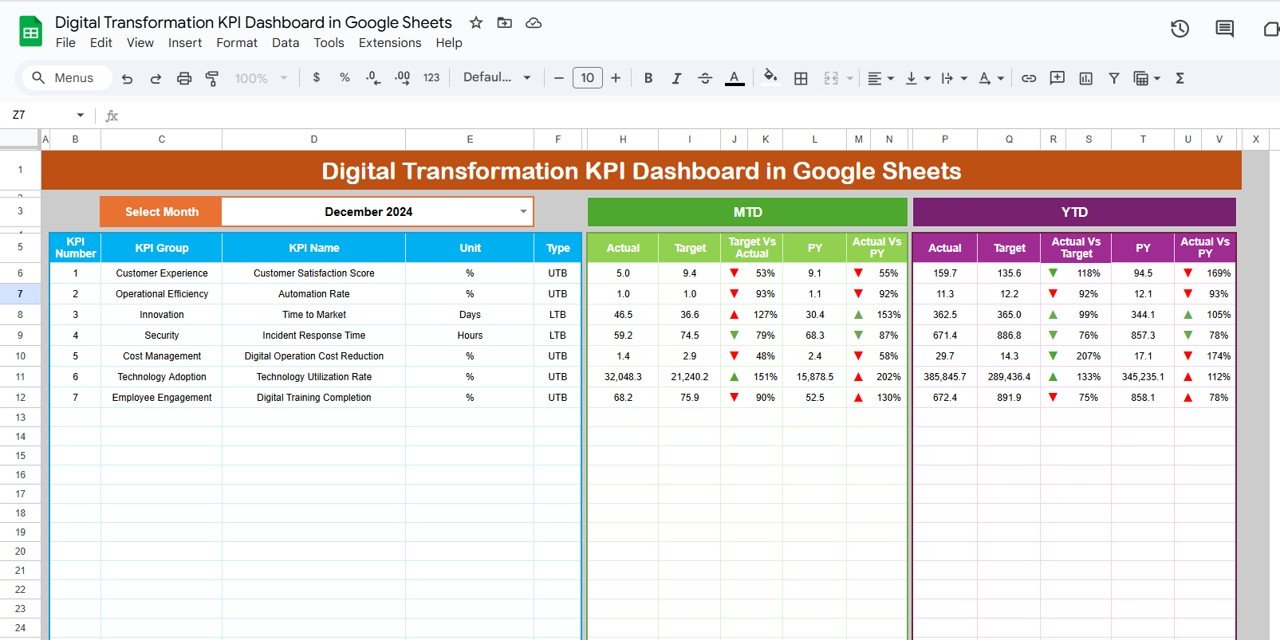
1. Dashboard Sheet Tab
The Dashboard Sheet provides a high-level overview of your digital transformation KPIs. Here, you can quickly track your progress toward achieving your goals.
Month Selection (D3): Choose the month to display the relevant data for that month.
Key Metrics:
- MTD Actual, Target, Previous Year Data: Track your actual performance for the current month, compare it to the target, and assess progress against previous year data.
- YTD Actual, Target, Previous Year Data: Monitor performance year-to-date, compare it to your target, and evaluate progress against the previous year’s data.
-
Conditional Formatting: The dashboard includes up and down arrows to indicate whether the KPIs are meeting or falling short of the targets.
Click to buy Digital Transformation KPI Dashboard in Google Sheets
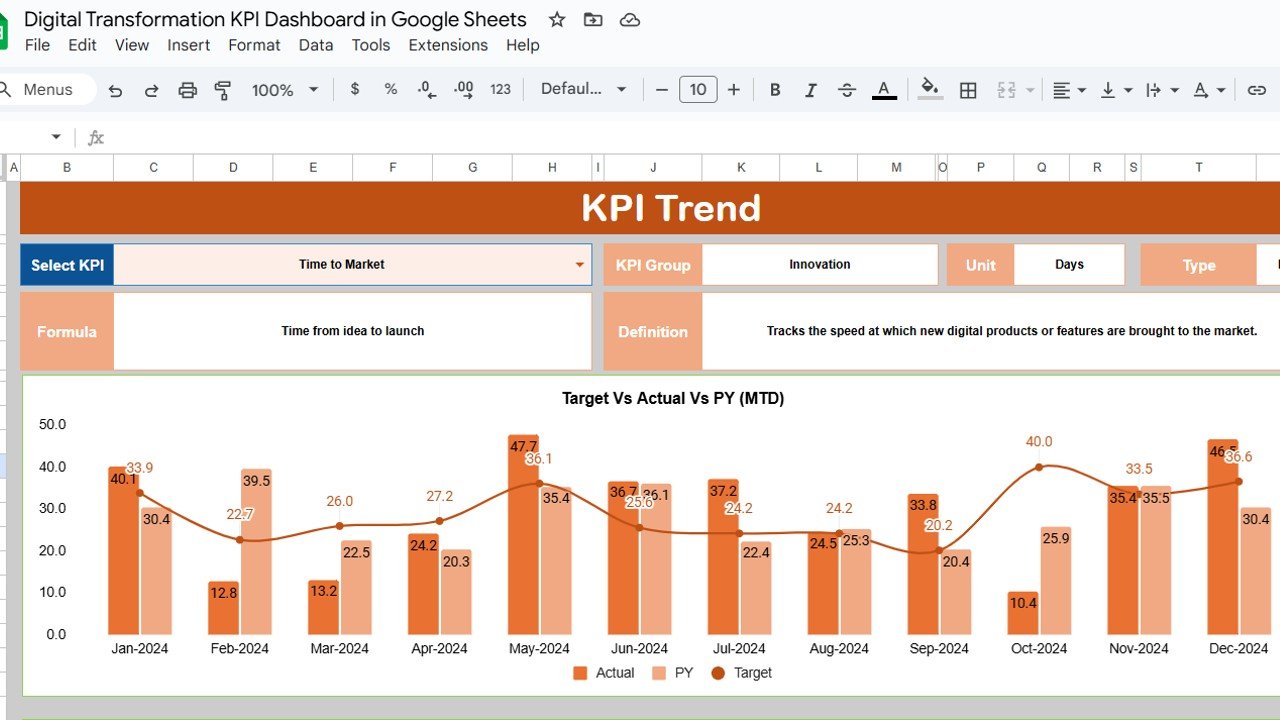
2. KPI Trend Sheet Tab
The KPI Trend Sheet allows you to view performance trends for selected KPIs over time.
-
KPI Selection (C3): Choose the KPI you want to track from the dropdown list.
-
KPI Group, Unit, and Type: This section provides detailed information about the KPI group (e.g., customer experience, operational efficiency), unit of measurement (e.g., percentage, number of users), and whether the KPI is “Lower the Better” (LTB) or “Upper the Better” (UTB).
-
Formula and Definition: Learn how each KPI is calculated and its significance in the context of your digital transformation strategy.
Click to buy Digital Transformation KPI Dashboard in Google Sheets
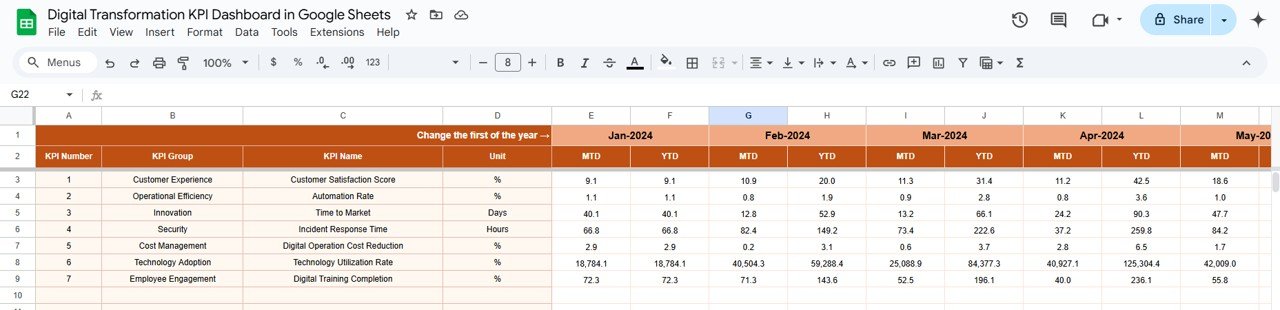
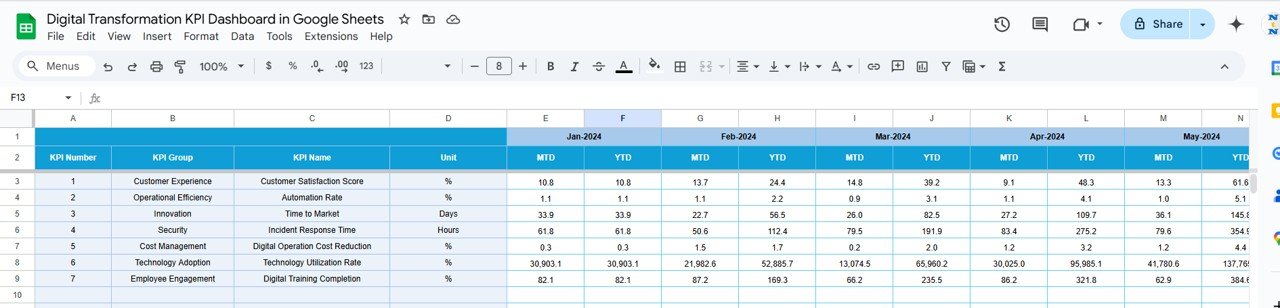
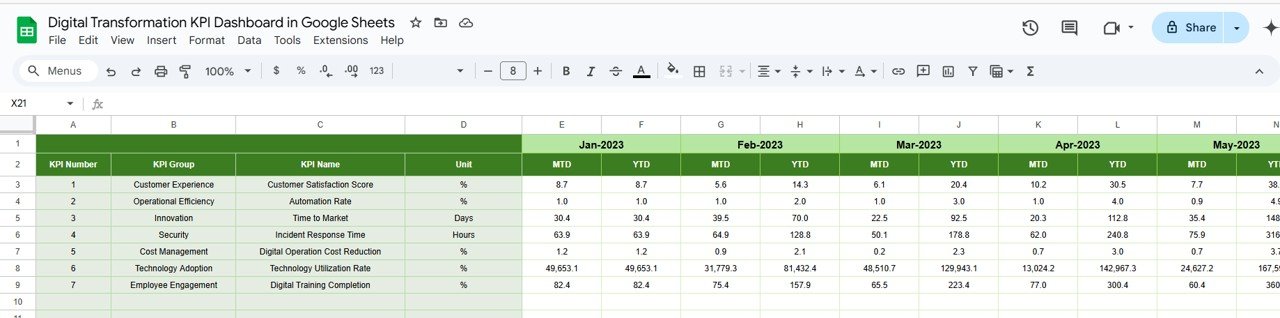
3. Actual Numbers Sheet Tab
This sheet allows you to input actual performance data for your KPIs:
-
MTD and YTD Data: Enter the actual values for the current month (MTD) and year-to-date (YTD) to keep the dashboard up-to-date
.
4. Target Sheet Tab
The Target Sheet is where you input the target values for each KPI:
-
Monthly and YTD Targets: Enter the target values for each KPI for the current month and year-to-date. These targets will be compared against actual performance in the dashboard.
Click to buy Digital Transformation KPI Dashboard in Google Sheets
5. Previous Year Numbers Sheet Tab
This sheet tracks performance data from the previous year for comparison:
-
Historical Data: Enter the previous year’s data to compare progress and evaluate trends.
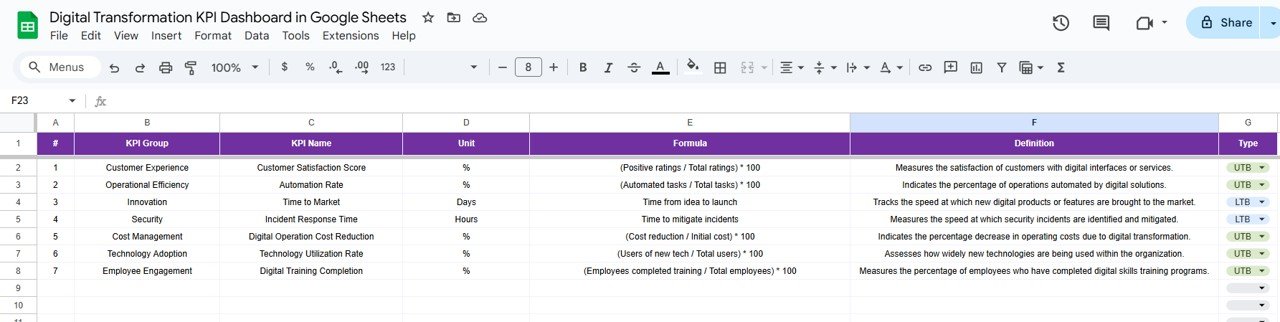
6. KPI Definition Sheet Tab
The KPI Definition Sheet provides a breakdown of each KPI:
-
KPI Name, Group, Unit: Lists the name, group, and unit of each KPI.
-
Formula and Definition: Offers a clear definition of each KPI and how it is calculated, providing context for its relevance to the digital transformation process.
Click to buy Digital Transformation KPI Dashboard in Google Sheets
Advantages of Using the Digital Transformation KPI Dashboard
The Digital Transformation KPI Dashboard offers several key advantages:
- Holistic View of Digital Initiatives: Track multiple KPIs in one place to get a comprehensive view of your digital transformation journey.
- Real-Time Data: Keep your data up-to-date by inputting actual and target values regularly, ensuring real-time tracking of performance.
- Data-Driven Decisions: Use data insights from the dashboard to make informed decisions about future digital initiatives and improvements.
- Visual Insights: The dashboard includes charts and conditional formatting to provide a visual representation of key data trends, making it easy to interpret complex data.
- Customization: Modify the dashboard to meet the specific needs of your digital transformation strategy by adding or removing KPIs and adjusting the layout.
Opportunity for Improvement in the Digital Transformation KPI Dashboard
Click to buy Digital Transformation KPI Dashboard in Google Sheets
While the Digital Transformation KPI Dashboard is a powerful tool, there are opportunities for further improvement:
-
Automated Data Updates: Integrating the dashboard with existing systems like CRM or financial software could automate data entry and reduce manual effort.
-
Mobile Version: A mobile-friendly version of the dashboard would allow managers to track digital transformation KPIs on the go.
-
Advanced Analytics: Adding predictive analytics capabilities could help forecast future trends and KPIs based on historical data.
-
Cross-Department Insights: Integrating cross-departmental data (e.g., sales, marketing, IT) could provide a more complete picture of digital transformation success.
Best Practices for Using the Digital Transformation KPI Dashboard
Click to buy Digital Transformation KPI Dashboard in Google Sheets
To make the most of the Digital Transformation KPI Dashboard, follow these best practices:
-
Regular Data Updates: Keep the dashboard up-to-date by regularly entering actual values for KPIs, targets, and historical data.
-
Set Achievable Targets: Ensure that your digital transformation targets are realistic and aligned with overall business goals.
-
Leverage Insights for Improvement: Use the insights gained from the dashboard to optimize digital processes and improve performance.
-
Collaborate Across Teams: Share the dashboard with different departments (e.g., IT, HR, marketing) to track the broader impact of digital initiatives across the organization.
-
Monitor Trends: Continuously monitor trends to identify areas for improvement and capitalize on digital opportunities.
Conclusion
The Digital Transformation KPI Dashboard in Google Sheets is an essential tool for businesses undergoing digital transformation. By tracking key performance indicators such as system adoption, digital sales growth, and customer satisfaction, this dashboard provides valuable insights into the success of digital initiatives. With real-time data, visual charts, and customizable features, it helps businesses optimize their digital strategies and drive growth.
Frequently Asked Questions (FAQs)
Click to buy Digital Transformation KPI Dashboard in Google Sheets
1. What KPIs are tracked in the Digital Transformation KPI Dashboard?
The dashboard tracks KPIs such as System Adoption Rate, Digital Sales Growth, Operational Efficiency, and Customer Satisfaction.
2. Can I customize the Digital Transformation KPI Dashboard?
Yes, the dashboard is fully customizable. You can add new KPIs, change chart types, and adjust the layout to fit your digital transformation needs.
3. How do I update the Digital Transformation KPI Dashboard?
Simply enter the actual data in the Actual Numbers Sheet and set the targets in the Target Sheet to keep the dashboard updated.
4. Can I integrate the dashboard with other tools?
Yes, you can integrate the dashboard with CRM or financial systems to automate data entry and improve tracking accuracy.
5. How often should I update the Digital Transformation KPI Dashboard?
It’s recommended to update the dashboard regularly, especially when new data is available, such as the end of the month or quarter.
Visit our YouTube channel to learn step-by-step video tutorials
Youtube.com/@NeotechNavigators
Watch the step-by-step video Demo:
Click to buy Digital Transformation KPI Dashboard in Google Sheets