In the digital era, communities are at the heart of brand engagement. Whether it’s a forum, Facebook group, Discord server, or customer community, monitoring its health and performance is crucial. That’s where a Community Management KPI Dashboard in Google Sheets becomes a game-changer. It helps you track vital metrics, improve community strategies, and keep stakeholders informed — all in one dynamic, easy-to-use spreadsheet.
In this guide, we will explore everything you need to know about this powerful dashboard: its structure, functionalities, advantages, best practices, improvement opportunities, and more.
What is a Community Management KPI Dashboard?
A Community Management KPI Dashboard is a centralized tool that helps community managers track, monitor, and report on the performance of their community. It measures essential Key Performance Indicators (KPIs) to understand how well the community is growing, engaging, and retaining members.
When created in Google Sheets, the dashboard becomes not only accessible and collaborative but also easy to customize and scale.
Key Features of the Community Management KPI Dashboard in Google Sheets
This dashboard template is designed with clarity and performance in mind. It contains 6 essential worksheet tabs:
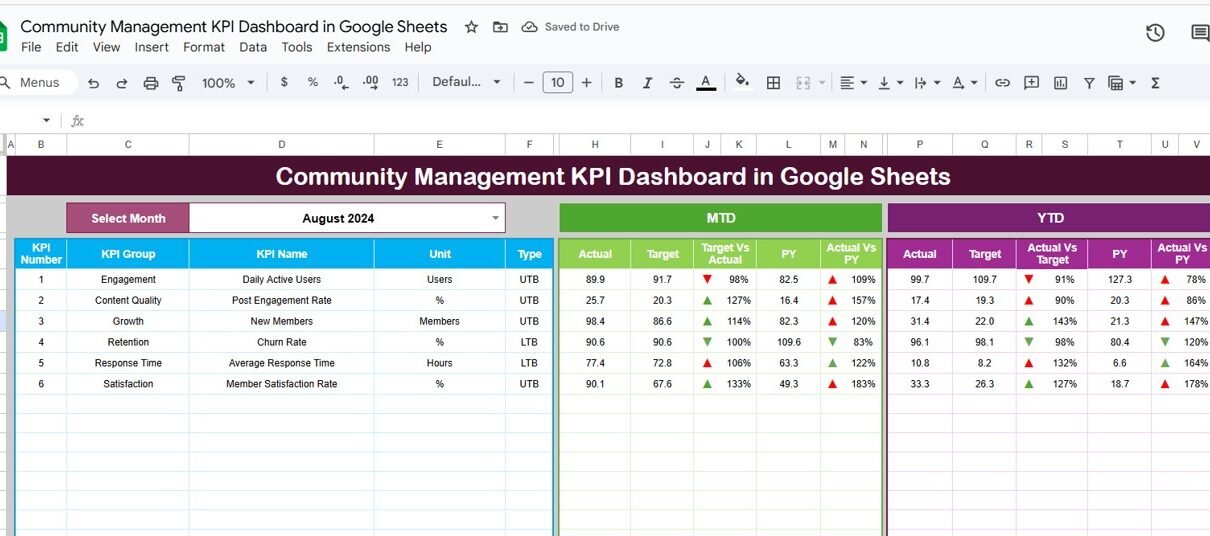
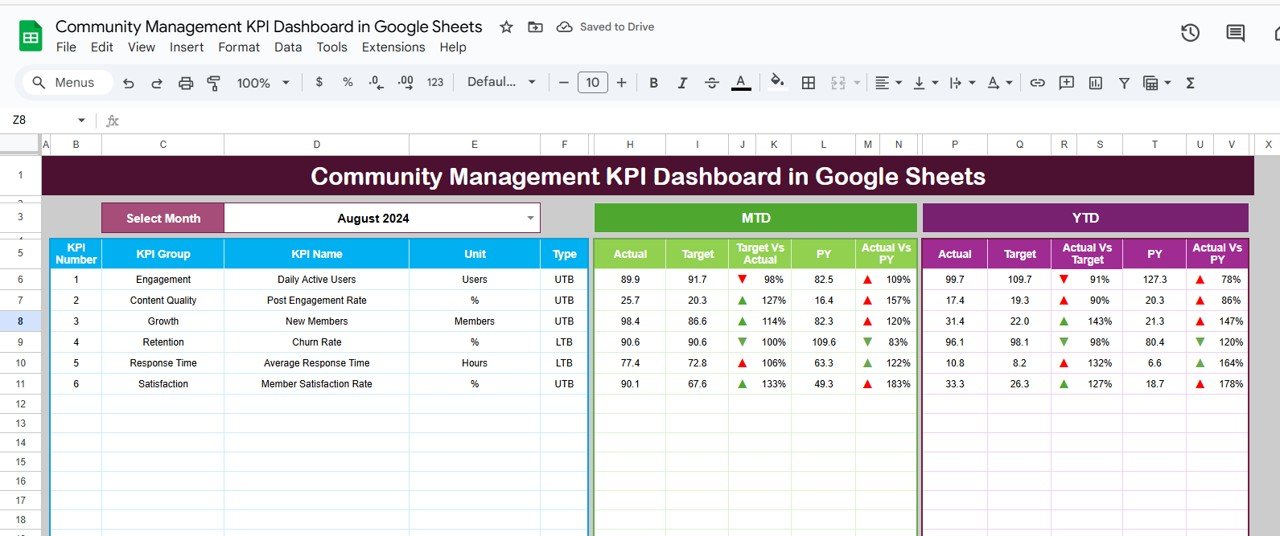
1. Dashboard Sheet Tab
-
This is the main visual interface of the tool.
-
Users can select a month from the dropdown (Range D3).
-
Automatically displays updated:
MTD (Month-to-Date) Actual, Target, and Previous Year
YTD (Year-to-Date) Actual, Target, and Previous Year
-
Includes up/down arrows for comparison (with conditional formatting).
-
Gives quick insight into the health of your community KPIs.
Click to buy Community Management KPI Dashboard in Google Sheets
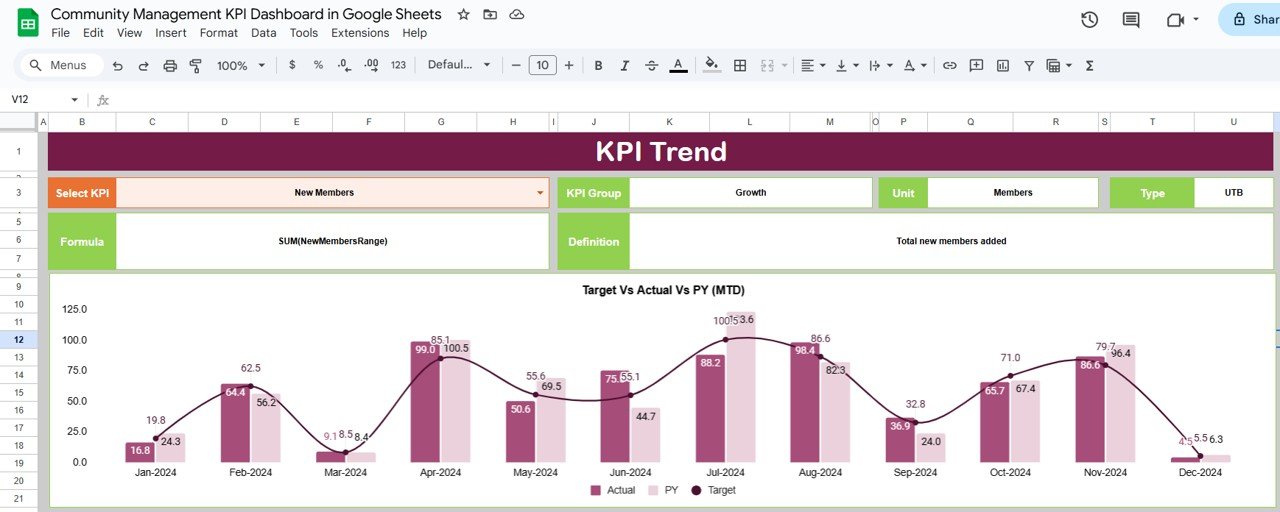
2. KPI Trend Sheet Tab
-
Choose the KPI name from a dropdown (Range C3).KPI Group
-
Unit of KPI
-
Type (Lower the Better or Upper the Better)
-
Formula
-
Definition
-
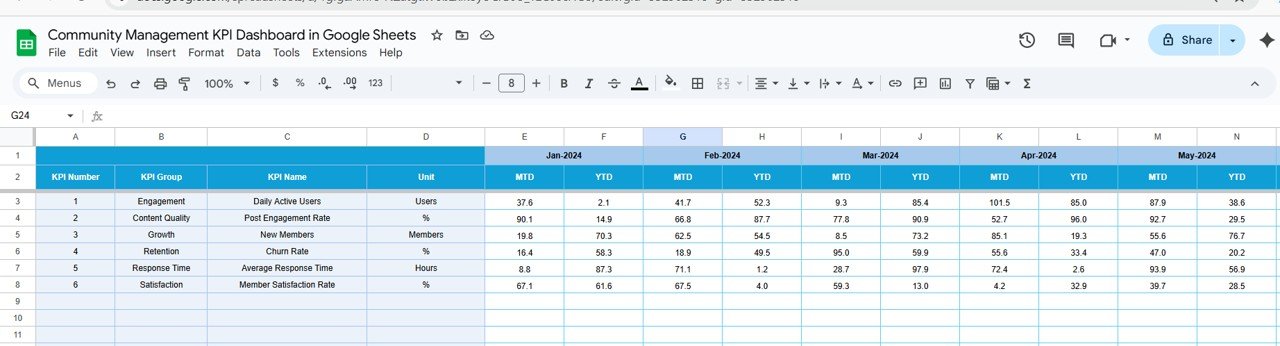
3. Actual Number Sheet Tab
-
Input the monthly actual numbers here.
-
Allows you to change the start month from Range E1.
-
Supports both MTD and YTD entries.
Click to buy Community Management KPI Dashboard in Google Sheets
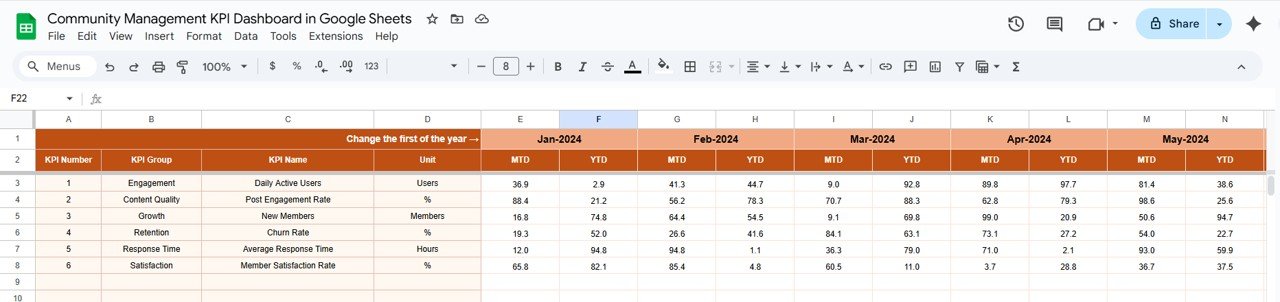
4. Target Sheet Tab
-
Enter target values for each KPI for every month.
-
Supports both MTD and YTD targets.
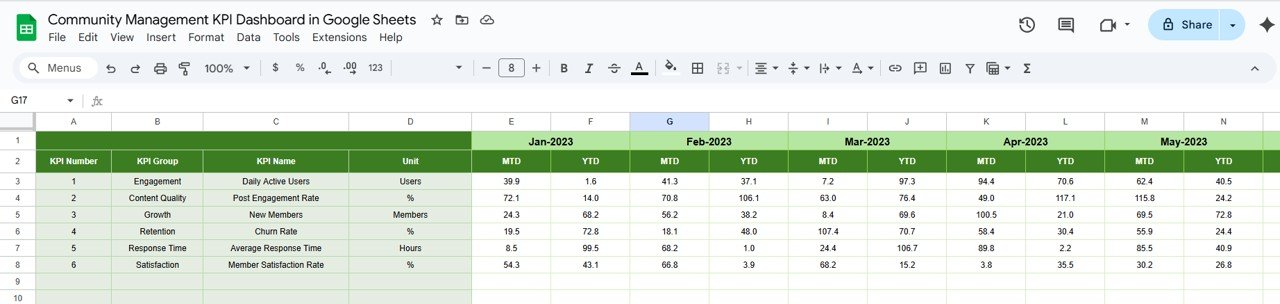
5. Previous Year Number Sheet Tab
-
Input the same KPI values from the previous year.
-
Enables year-over-year performance tracking.
Click to buy Community Management KPI Dashboard in Google Sheets
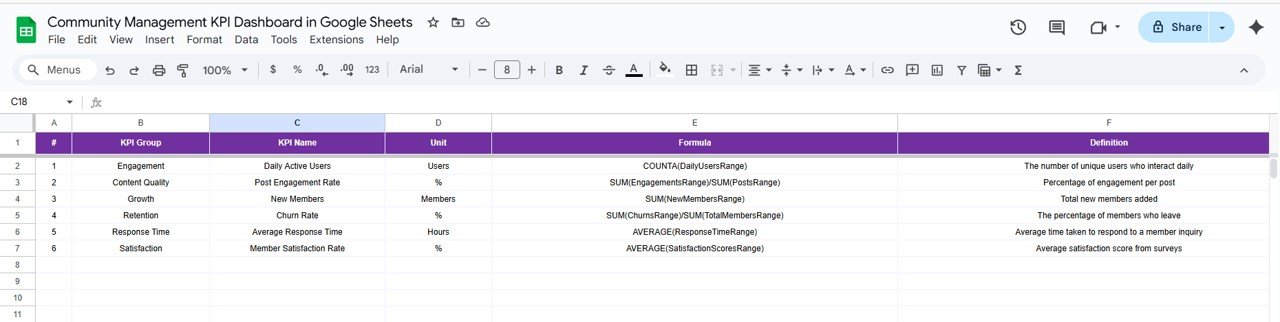
6. KPI Definition Sheet Tab
Enter KPI details:
- KPI Name
- KPI Group
- Unit
- Formula
- KPI Definition
Why Should You Use This Dashboard?
This tool is more than a spreadsheet. It is your strategic partner in making data-driven decisions. Below are several reasons to integrate it into your workflow:
Real-Time Insights
Google Sheets allows for real-time updates. As soon as someone adds data, everyone can view the updated results.
Easy Customization
You can easily add or remove KPIs, update target values, and adjust formulas without needing technical expertise.
No Special Tools Required
You only need a Google account. No need to invest in expensive BI tools or software.
Collaborative and Shareable
Stakeholders, team members, and leadership can access the same sheet with different access levels.
Advantages of Community Management KPI Dashboard in Google Sheets
Click to buy Community Management KPI Dashboard in Google Sheets
Let’s explore the key benefits this dashboard offers:
-
Clear Performance Visibility: Offers a single view of all vital KPIs.
-
Goal Tracking: Aligns monthly performance against defined targets.
-
Historical Comparison: Shows current vs previous year trends for each KPI.
-
Conditional Formatting: Visual cues like up/down arrows quickly indicate performance shifts.
-
Trend Analysis: Helps identify long-term growth, stagnation, or decline.
-
Increased Accountability: Teams can see their performance metrics transparently.
Opportunity to Improve the Community Management KPI Dashboard
Click to buy Community Management KPI Dashboard in Google Sheets
Although highly functional, every tool has room for enhancement. Here are some ideas to make this dashboard even better:
-
Automate Data Import: Connect with community tools (e.g., Discord, Facebook Groups) via Apps Script or third-party plugins.
-
Add Visual Charts: Use built-in chart tools for trend lines, bar graphs, and pie charts.
-
Include Filters: Add slicers to filter by KPI groups, months, or team roles.
-
Make it Mobile Friendly: Optimize the layout for viewing on smartphones or tablets.
-
Integrate Time-Based Alerts: Use conditional triggers to flag overdue KPIs or falling metrics.
Best Practices for Using the Community Management KPI Dashboard
To get the best results, follow these tips:
-
Update Data Regularly: Add actual numbers every week or month.
-
Set Realistic Targets: Define achievable but challenging KPI goals.
-
Use it in Team Meetings: Review KPIs during team reviews or planning sessions.
-
Keep Definitions Clear: Maintain an updated KPI Definition sheet for transparency.
-
Manage Access Wisely: Share the dashboard with edit or view access depending on the user’s role.
-
Use Version Control: Regularly backup or duplicate sheets to avoid accidental data loss.
Conclusion
Click to buy Community Management KPI Dashboard in Google Sheets
Managing an online community without tracking performance is like sailing without a compass. A Community Management KPI Dashboard in Google Sheets empowers you with the right metrics at the right time, enabling informed decisions, improved engagement, and measurable results.
It’s accessible, affordable, and fully customizable — a perfect solution for startups, nonprofits, and large organizations alike. With proper usage, it can elevate your community strategy and foster long-term growth.
Frequently Asked Questions (FAQs)
1. What is the main purpose of the Community Management KPI Dashboard?
Its main purpose is to track, analyze, and report key performance indicators related to community growth, engagement, and retention.
2. Can I use this dashboard for any type of community?
Yes, it is flexible and works for online communities like Facebook Groups, Discord servers, forums, or internal communities.
3. Do I need coding knowledge to use this dashboard?
Not at all. It’s built entirely in Google Sheets, and you only need basic spreadsheet knowledge.
4. How often should I update the dashboard?
You can update it monthly or weekly, depending on the size and activity of your community.
5. Can I track more than 12 KPIs?
Yes, the dashboard is fully customizable. You can add more KPIs in the definition and data sheets.
6. How is this dashboard different from BI tools like Tableau or Power BI?
This is a lightweight, spreadsheet-based tool. While it lacks advanced visualizations, it offers simplicity, collaboration, and cost-effectiveness.
7. Is this dashboard mobile-friendly?
While Google Sheets works on mobile, it’s best viewed on desktop. You can optimize layout manually for smaller screens.
8. Can I share this dashboard with my team?
Absolutely. You can share it via Google Sheets’ built-in sharing options with view or edit access.
Visit our YouTube channel to learn step-by-step video tutorials
Youtube.com/@NeotechNavigators
Watch the step-by-step video Demo:
Click to buy Community Management KPI Dashboard in Google Sheets