Efficient office space management has become crucial for modern organizations. With hybrid work models, managing meeting rooms, desks, and collaborative spaces can quickly become complex. To address this challenge, we have developed a ready-to-use Office Utilization Dashboard in Google Sheets. This dashboard helps managers, office administrators, and team leaders monitor room bookings, track usage, and improve overall workspace efficiency.
In this article, we will explore all aspects of the dashboard, its features, benefits, best practices, and opportunities for improvement.
What is an Office Utilization Dashboard in Google Sheets?
An Office Utilization Dashboard is an interactive tool designed to monitor how office resources—like meeting rooms, open desks, and collaborative spaces—are being used. By visualizing booking patterns and occupancy trends, organizations can make data-driven decisions, optimize resource allocation, and improve employee productivity.
Our Google Sheets-based solution provides a simple, ready-to-use format, eliminating the need for complex software or manual tracking.
Key Features of the Office Utilization Dashboard
Click to Buy Office Utilization Dashboard in Google Sheets
This dashboard includes three worksheet tabs, each serving a unique purpose:
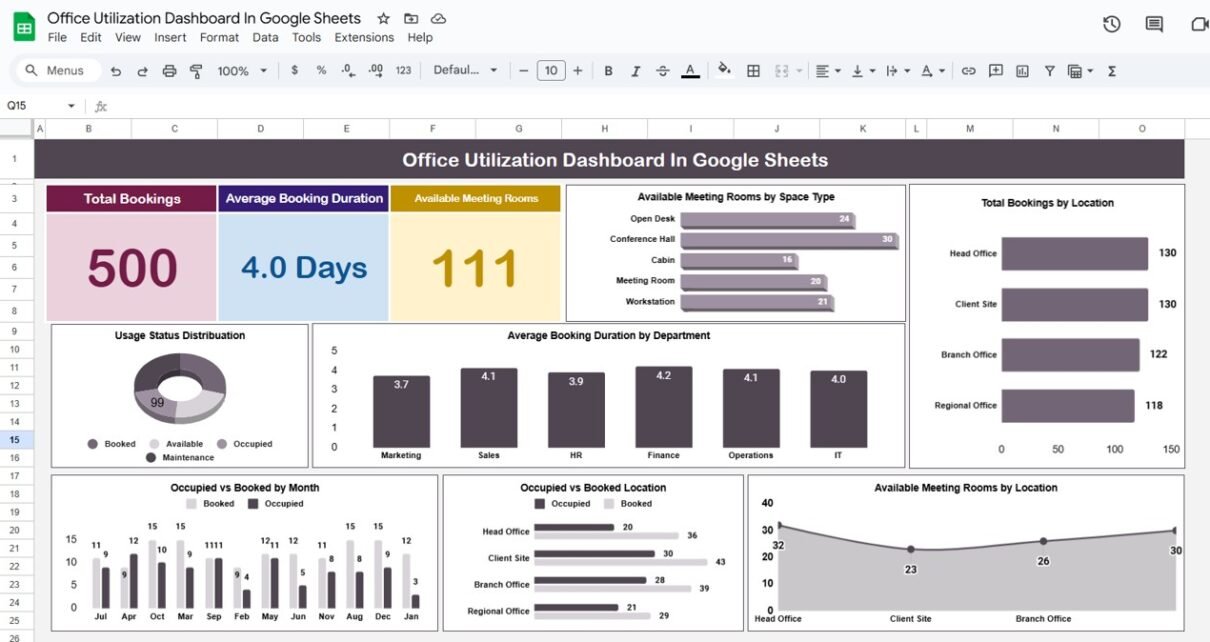
1. Dashboard Sheet Tab
The Dashboard sheet provides a high-level overview of office utilization metrics with cards and charts:
Cards:
-
Total Bookings – Count of all booked spaces.
-
Average Booking Duration – Average time for each booking.
-
Available Meeting Rooms – Number of rooms currently available.
Charts:
-
Available Meeting Rooms by Space Type – Visualize which types of spaces are most available.
-
Total Bookings by Location – Track bookings across multiple office locations.
-
Usage Status Distribution – See the proportion of occupied, booked, and available spaces.
-
Average Booking Duration by Department – Understand which departments are using spaces more efficiently.
-
Available Meeting Rooms by Location – Compare room availability across offices.
-
Occupied vs Booked Location – Analyze which areas are frequently used or underutilized.
-
Occupied vs Booked by Month – Spot trends in space utilization over time.
This sheet provides a snapshot of office efficiency and allows managers to quickly identify bottlenecks.

Click to Buy Office Utilization Dashboard in Google Sheets
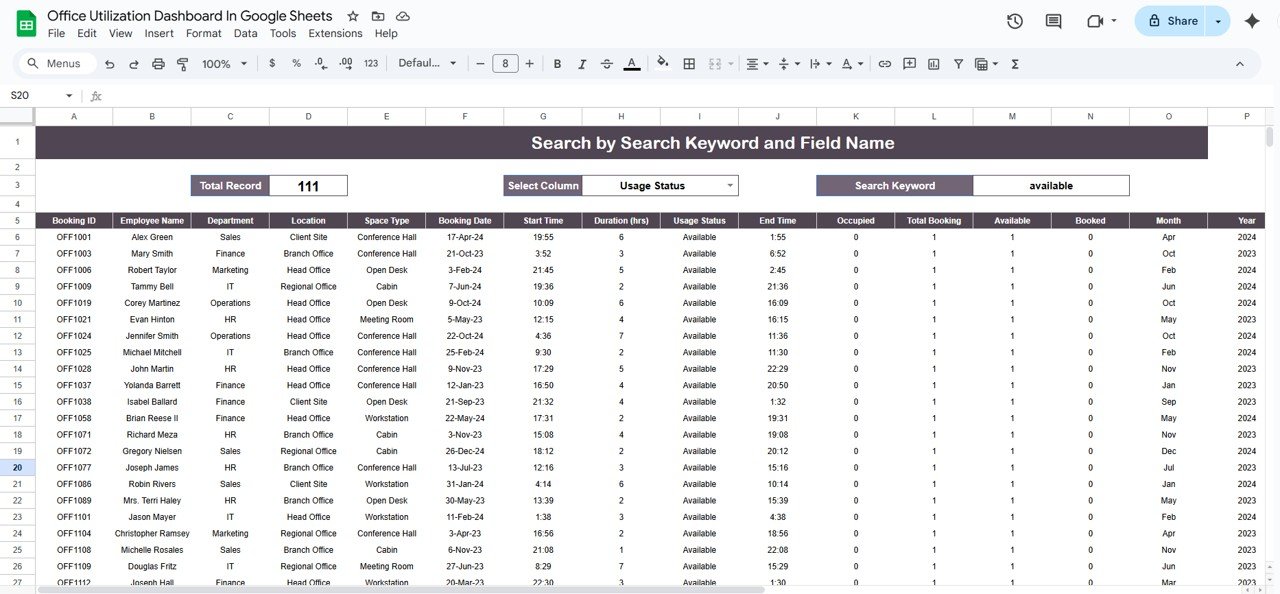
2. Search Sheet Tab
The Search sheet makes it easy to find specific booking records:
-
Search by Keyword & Field Name – Quickly filter by department, employee, usage status, or location.
-
Dynamic Record Count – Instantly shows total records matching your search criteria.
For example, you can search for all “available” spaces in the Finance department or identify which rooms are booked most often.
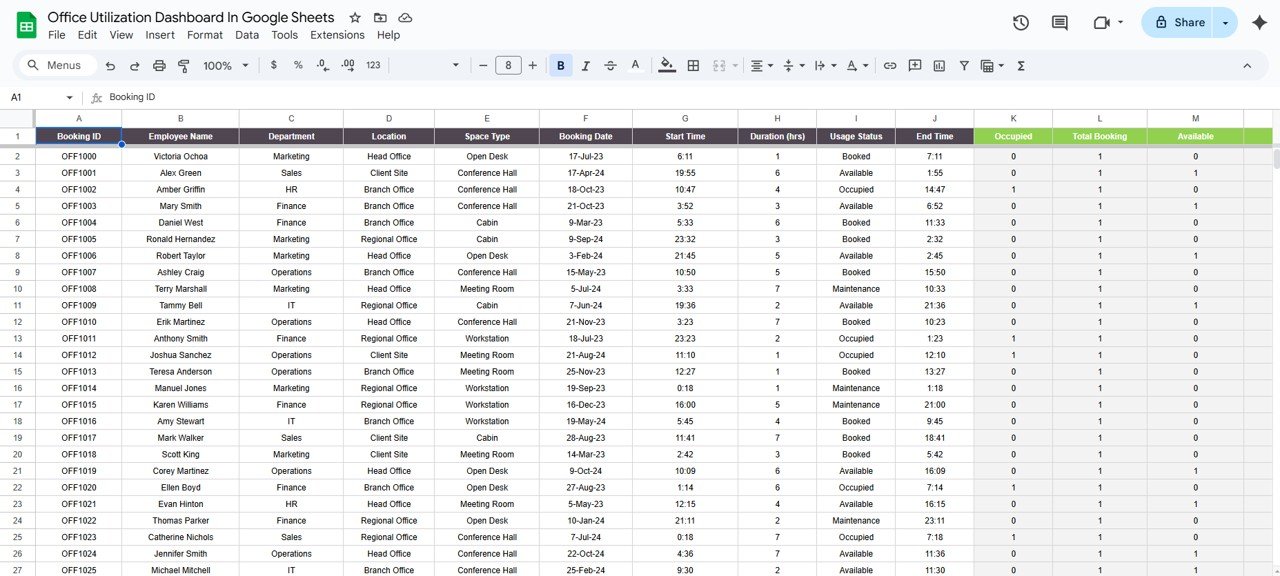
3. Data Sheet Tab
The Data sheet acts as the database for all office bookings. You can input details such as:
-
Booking ID
-
Employee Name
-
Department
-
Location
-
Space Type (Conference Hall, Open Desk, etc.)
-
Booking Date & Time
-
Duration (hrs)
-
Usage Status (Available, Booked, Occupied)
-
Occupied / Total Booking
-
Month & Year
All charts and metrics in the dashboard are dynamically linked to this sheet, making it easy to update and maintain the system.
Click to Buy Office Utilization Dashboard in Google Sheets
Advantages of Using This Dashboard
Using this Office Utilization Dashboard in Google Sheets provides several benefits:
-
Real-Time Insights – Quickly understand office occupancy and resource usage.
-
Better Space Management – Identify underutilized rooms or desks to optimize office layouts.
-
Department-Level Analysis – Track usage by department to ensure fair resource allocation.
-
Trend Analysis – Spot monthly or yearly trends in bookings to plan future office requirements.
-
Ease of Use – No advanced technical skills required; Google Sheets is widely accessible.
Opportunities for Improvement
Click to Buy Office Utilization Dashboard in Google Sheets
While this dashboard is robust, there are ways to enhance it further:
-
Integrate with calendar systems like Google Calendar or Outlook for automatic booking updates.
-
Add conditional formatting to highlight high-demand rooms or overbooked spaces.
-
Implement role-based access control to ensure only authorized users can edit bookings.
-
Expand metrics to include employee utilization rates for hybrid work tracking.
-
Incorporate alerts for upcoming expired or unconfirmed bookings.
Best Practices for Using the Dashboard
Click to Buy Office Utilization Dashboard in Google Sheets
-
Regularly Update Data: Keep the Data sheet updated to ensure accurate insights.
-
Filter by Department: Customize views for department heads to track their own usage.
-
Use Monthly & Annual Views: Combine monthly and annual analysis to understand patterns.
-
Monitor Occupancy Trends: Identify peak hours to optimize room allocation.
-
Backup Your Sheet: Always maintain a copy to prevent data loss.
Conclusion
The Office Utilization Dashboard in Google Sheets is a powerful tool for managing office space efficiently. By tracking bookings, monitoring usage, and analyzing trends, organizations can optimize resources, improve employee satisfaction, and reduce costs. Whether you manage a small office or a multi-location workspace, this dashboard simplifies office management with clear, actionable insights.
Visit our YouTube channel to learn step-by-step video tutorials
Youtube.com/@NeotechNavigators
Watch the step-by-step video Demo: