In the fast-paced food supply industry, maintaining efficiency, quality, and timely delivery is critical. Organizations need to monitor multiple performance metrics simultaneously to ensure smooth operations, reduce waste, and optimize the supply chain.Food Supply Chain KPI Dashboard in Google Sheets
A Food Supply Chain KPI Dashboard in Google Sheets provides a ready-to-use solution to track, analyze, and improve supply chain performance. This article explores its features, setup, best practices, and how it empowers decision-makers with actionable insights.Food Supply Chain KPI Dashboard in Google Sheets
What Is a Food Supply Chain KPI Dashboard?
A Food Supply Chain KPI Dashboard is an interactive Google Sheets template designed to capture key performance indicators (KPIs) for your food supply operations. It consolidates essential metrics like delivery performance, inventory turnover, order accuracy, supplier reliability, and cost efficiency into one dynamic view.
With this dashboard, you can:
-
Monitor Monthly and Year-to-Date (YTD) performance
-
Compare actual results with targets and previous year data
-
Identify trends and areas needing improvement
-
Make data-driven decisions to optimize your supply chain
Key Features of the Food Supply Chain KPI Dashboard
The dashboard is built across 6 worksheet tabs, each serving a distinct purpose:
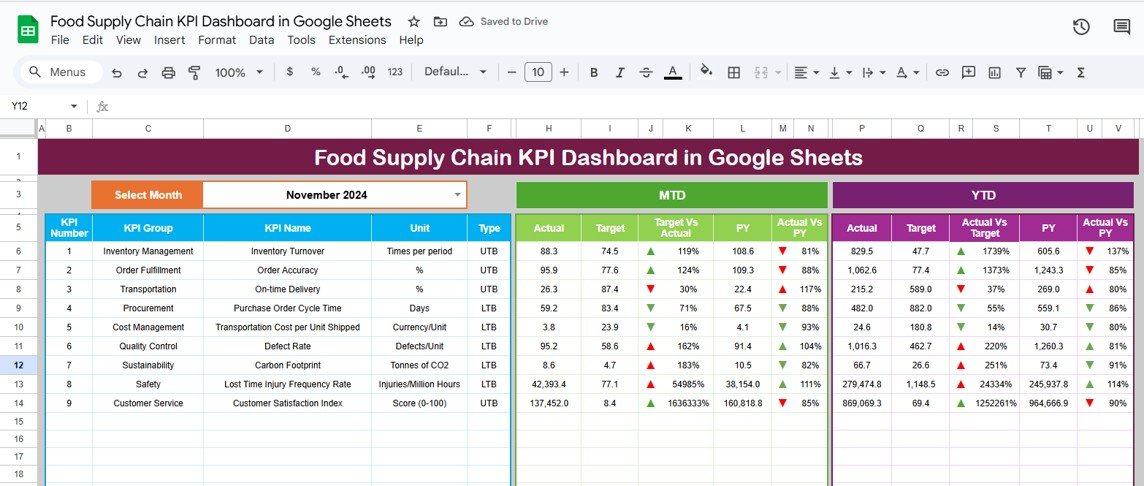
1. Dashboard Sheet Tab
The Dashboard Sheet is the main hub where all KPIs are displayed visually.
Features include:
-
Month Selection: Change the month from range
D3to update the dashboard numbers automatically. -
MTD and YTD Analysis: Compare Month-to-Date (MTD) and Year-to-Date (YTD) actuals against targets and previous year (PY) data.
-
Conditional Formatting: Use up/down arrows to quickly highlight performance above or below target.
-
Target vs Actual: Monitor how KPIs perform against monthly and annual goals.
Click to Buy Food Supply Chain KPI Dashboard in Google Sheets
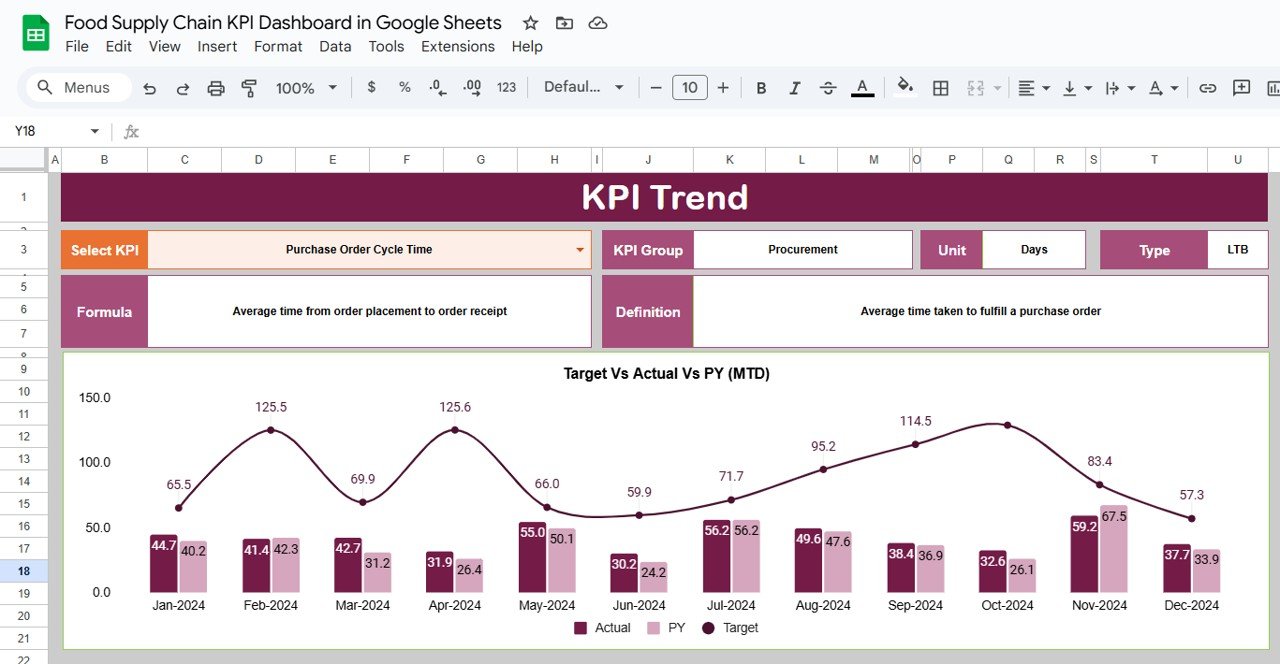
2. KPI Trend Sheet Tab
This sheet allows users to select a specific KPI from a dropdown (range C3) and view detailed information:
-
KPI Group
-
Unit of measurement
-
KPI type (Lower-the-Better / Upper-the-Better)
-
KPI formula
-
KPI definition
This tab provides an in-depth view of individual KPI trends over time, helping identify bottlenecks or areas for improvement.
Click to Buy Food Supply Chain KPI Dashboard in Google Sheets
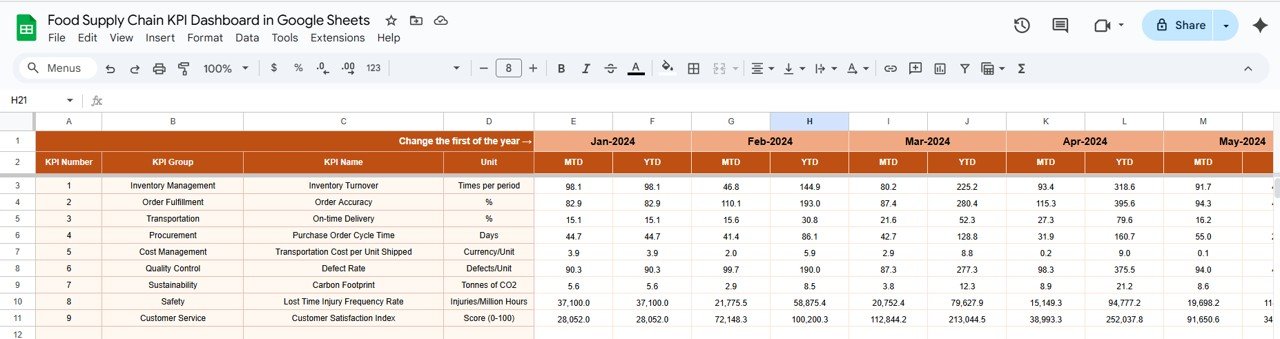
3. Actual Number Sheet Tab
Here, you enter the actual performance numbers for each KPI:
-
Supports both MTD and YTD values
-
Month can be changed from range
E1(start of the year) -
Automatically updates the Dashboard Sheet for real-time tracking
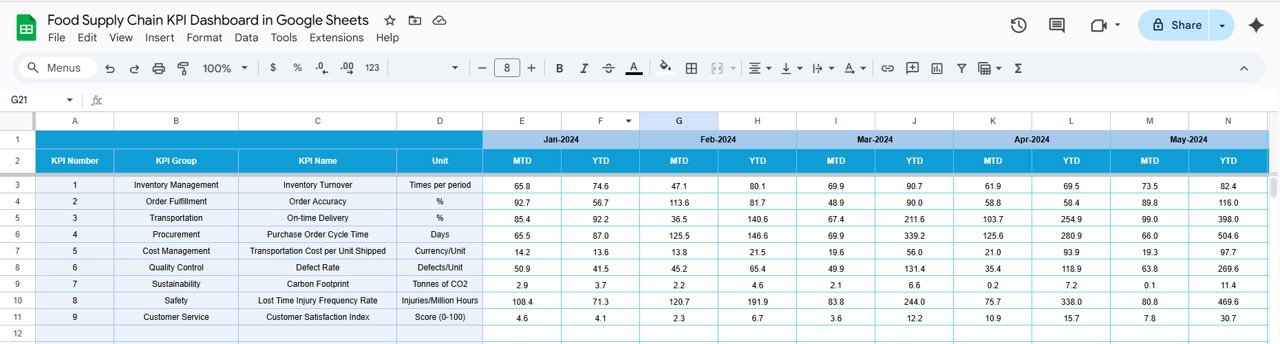
4. Target Sheet Tab
This sheet stores monthly and annual target values for all KPIs:
-
MTD targets
-
YTD targets
-
Helps measure performance gaps against actuals
Click to Buy Food Supply Chain KPI Dashboard in Google Sheets
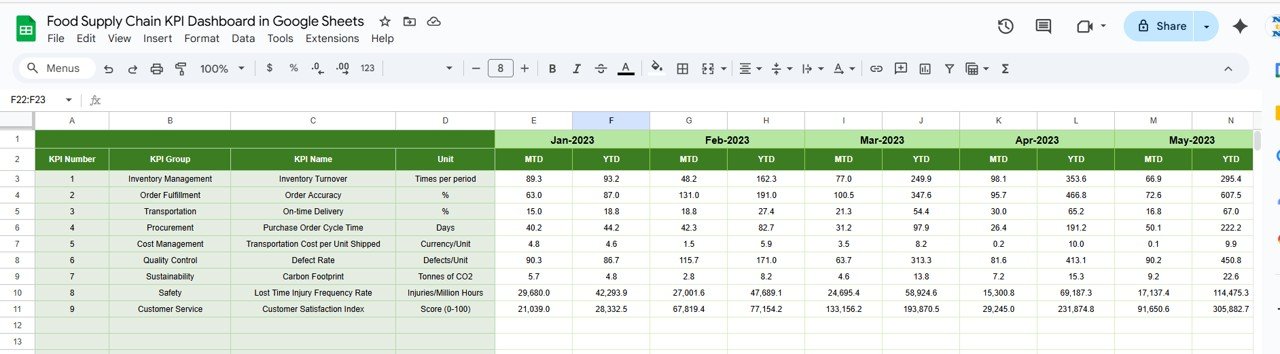
5. Previous Year Number Sheet Tab
Enter previous year data to enable comparison with current year performance:
-
Supports both MTD and YTD data entry
-
Enables trend analysis for improvement and planning
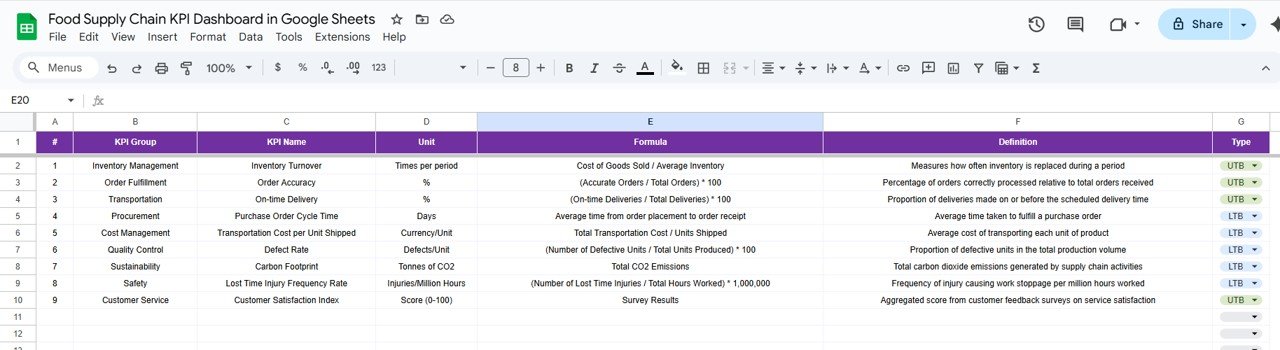
6. KPI Definition Sheet Tab
This sheet serves as the master list of all KPIs with key details:
-
KPI Name
-
KPI Group
-
Unit of measurement
-
Formula for calculation
-
KPI definition
-
Lower-the-Better or Upper-the-Better type
Having a well-structured definition sheet ensures consistency across reporting and performance evaluation.
Click to Buy Food Supply Chain KPI Dashboard in Google Sheets
How to Use the Dashboard Effectively
To get the most out of your Food Supply Chain KPI Dashboard, follow these steps:
-
Enter Targets: Populate the Target Sheet with your monthly and yearly KPI goals.
-
Input Actuals: Regularly update the Actual Number Sheet with real data for MTD and YTD performance.
-
Update Previous Year Data: Maintain historical comparison by updating PY data each month.
-
Review Dashboard: Use the main dashboard sheet to visualize performance trends, identify underperforming areas, and take corrective actions.
-
Analyze KPI Trends: Use the KPI Trend Sheet to deep-dive into specific metrics, understand the formula used, and assess performance patterns.
Advantages of Using a Food Supply Chain KPI Dashboard
-
Centralized Tracking: Monitor all supply chain KPIs in a single sheet.
-
Visual Insights: Conditional formatting and charts highlight key performance metrics.
-
Historical Comparison: Compare current performance with targets and previous year’s data.
-
Time-Saving: Quickly review multiple KPIs without manually analyzing raw data.
-
Improved Decision-Making: Helps managers take informed actions to improve efficiency and reduce costs.
Best Practices for Supply Chain KPI Tracking
Click to Buy Food Supply Chain KPI Dashboard in Google Sheets
-
Regular Updates: Enter data consistently to maintain accuracy.
-
Use Standard Metrics: Standardize KPI definitions and calculation formulas to avoid confusion.
-
Analyze Monthly Trends: Compare MTD and YTD performance to identify recurring issues.
-
Set Realistic Targets: Ensure targets are achievable and reflect operational capacity.
-
Collaborate with Teams: Share the Google Sheet with relevant stakeholders for real-time updates and transparency.
Opportunities for Improvement
While the dashboard provides powerful insights, organizations can enhance it by:
-
Adding interactive charts and graphs for each KPI trend
-
Automating alerts for KPIs falling below targets
-
Integrating with Google Forms or ERP data for automated updates
-
Creating department-wise dashboards for granular analysis
Who Can Benefit From This Dashboard?
Click to Buy Food Supply Chain KPI Dashboard in Google Sheets
-
Food Manufacturers: Track production and supply chain efficiency.
-
Logistics Companies: Monitor delivery timelines and order accuracy.
-
Retail Chains: Measure supplier performance and inventory levels.
-
Quality Assurance Teams: Analyze food safety and compliance metrics.
-
Procurement Departments: Optimize vendor management and sourcing efficiency.
Conclusion
A Food Supply Chain KPI Dashboard in Google Sheets is an essential tool for organizations seeking operational excellence. By consolidating all KPIs into a single, interactive sheet, this dashboard helps monitor performance, reduce inefficiencies, and ensure a smooth supply chain.
Visit our YouTube channel to learn step-by-step video tutorials
Youtube.com/@NeotechNavigators
Watch the step-by-step video Demo:
Click to Buy Food Supply Chain KPI Dashboard in Google Sheets