Efficiently managing office maintenance is critical for organizations to ensure smooth operations, reduce downtime, and control costs. Monitoring requests, tracking resolution times, and analyzing costs can be complex without a structured system.
Our Office Maintenance Dashboard in Google Sheets is a ready-to-use tool designed to simplify maintenance tracking and provide actionable insights. In this article, we will explore the features, benefits, and best practices for leveraging this dashboard effectively.
What is an Office Maintenance Dashboard?
An Office Maintenance Dashboard is a centralized tool that allows organizations to track, analyze, and manage all maintenance activities. Using Google Sheets makes this dashboard:
-
Accessible: View and update data from anywhere with internet access.
-
Collaborative: Multiple team members can work simultaneously.
-
Visual: Cards, charts, and tables provide instant insights.
-
Customizable: Adaptable to different office locations, categories, and priorities.
This dashboard helps facilities managers, office administrators, and maintenance teams monitor requests, prioritize tasks, and control costs efficiently.
Key Features of the Office Maintenance Dashboard
Click to Buy Office Maintenance Dashboard in Google Sheets
The dashboard consists of 3 worksheet tabs, each serving a unique purpose:
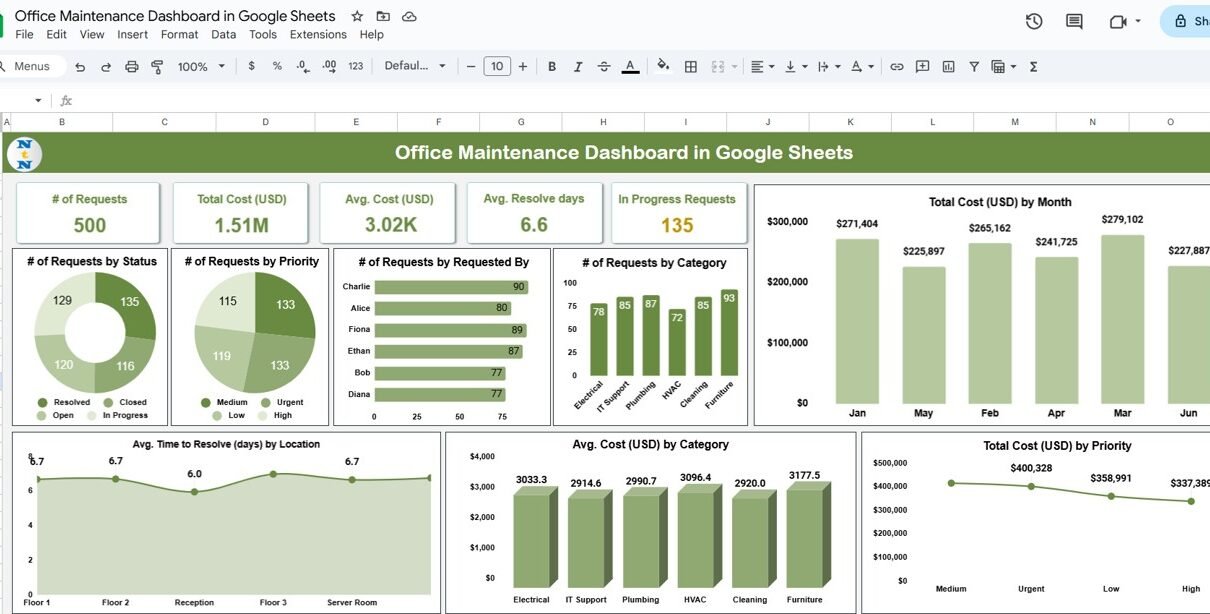
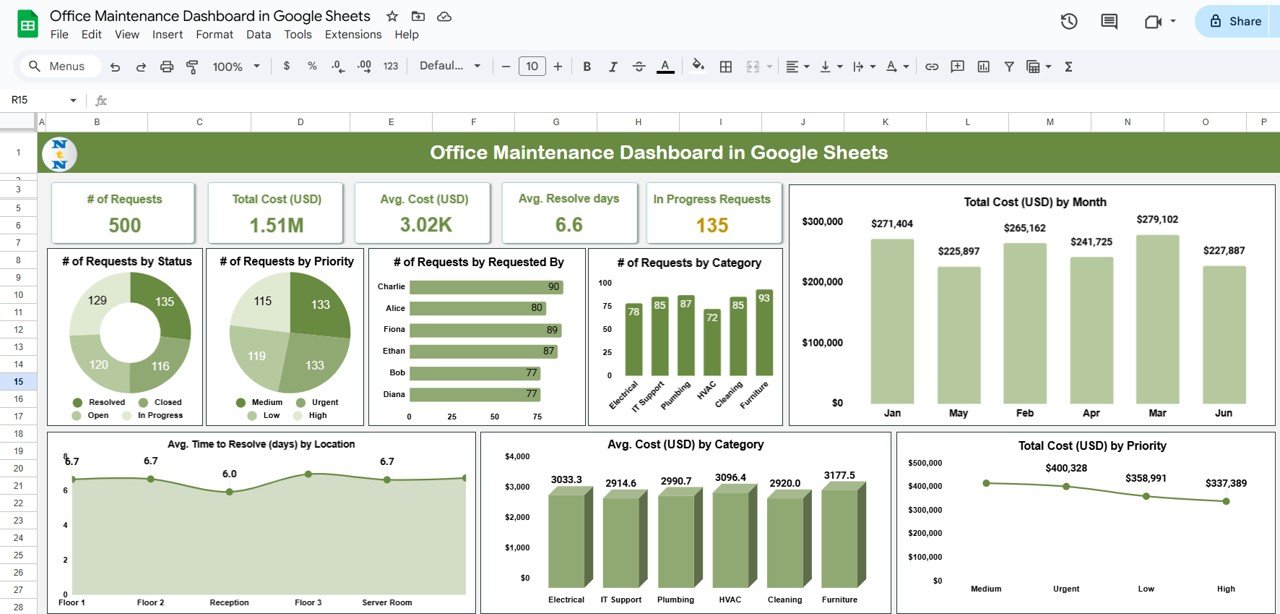
1. Dashboard Sheet Tab
The Dashboard Sheet is the main analytics hub where all insights are displayed.
Cards Section:
-
# of Requests: Total maintenance requests logged.
-
Total Cost (USD): Cumulative cost of completed requests.
-
Avg. Cost (USD): Average cost per request.
-
Avg. Resolve Days: Average time to resolve maintenance tickets.
-
In Progress Requests: Number of requests currently in progress.
Charts Section:
-
# of Requests by Status: Visualize the distribution of open, closed, and pending requests.
-
# of Requests by Priority: Track urgent, high, medium, and low-priority tasks.
-
# of Requests by Requested By: Identify employees submitting maintenance requests.
-
# of Requests by Category: Analyze requests by type (e.g., HVAC, IT Support, Electrical).
-
Total Cost (USD) by Month: Monitor monthly maintenance spending.
-
Avg. Time to Resolve (days) by Location: Compare performance across office locations.
-
Avg. Cost (USD) by Category: Understand cost trends by type of request.
-
Total Cost (USD) by Priority: Assess how priority impacts maintenance expenses.
This combination of cards and charts provides a comprehensive overview of office maintenance activities at a glance.
Click to Buy Office Maintenance Dashboard in Google Sheets
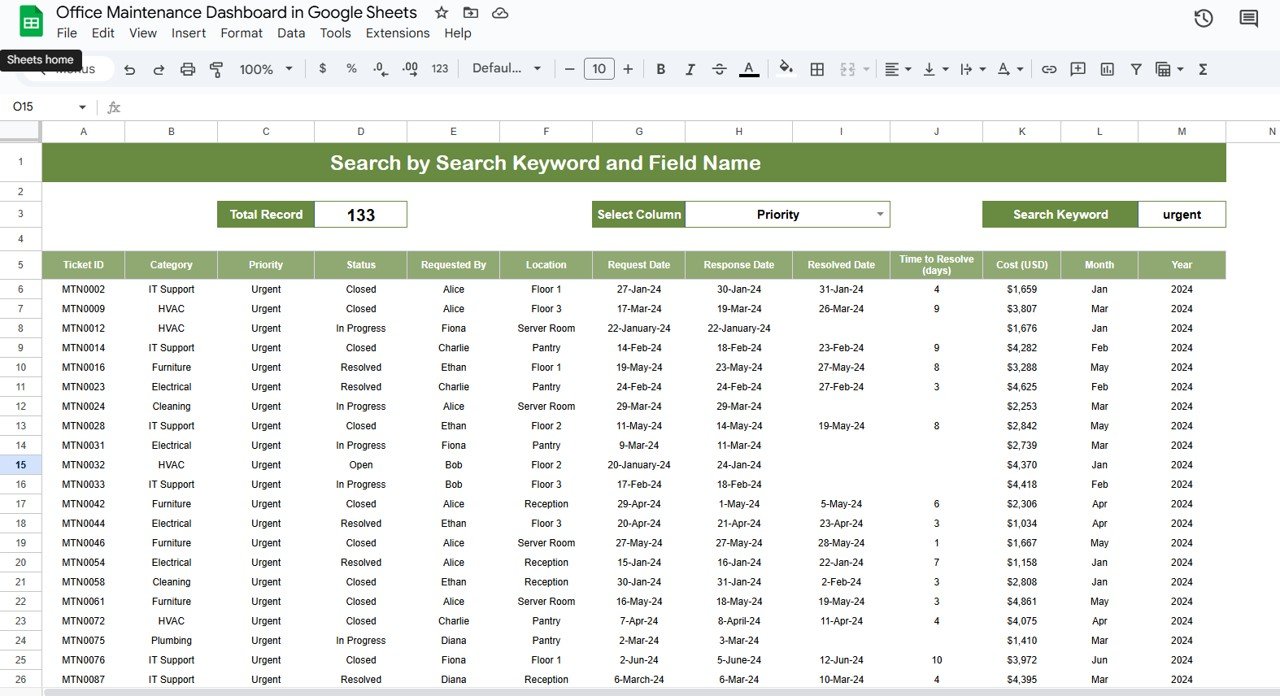
2. Search Sheet Tab
The Search Sheet enables quick filtering and retrieval of specific records.
Key Features:
-
Search by Keyword: Enter a search term to find matching tickets.
-
Select Column: Choose the field (e.g., Priority, Category, Requested By) to refine results.
-
Total Record Count: Shows the number of records matching the search criteria.
This makes it easy to track tickets based on priority, category, employee, or location.
Click to Buy Office Maintenance Dashboard in Google Sheets
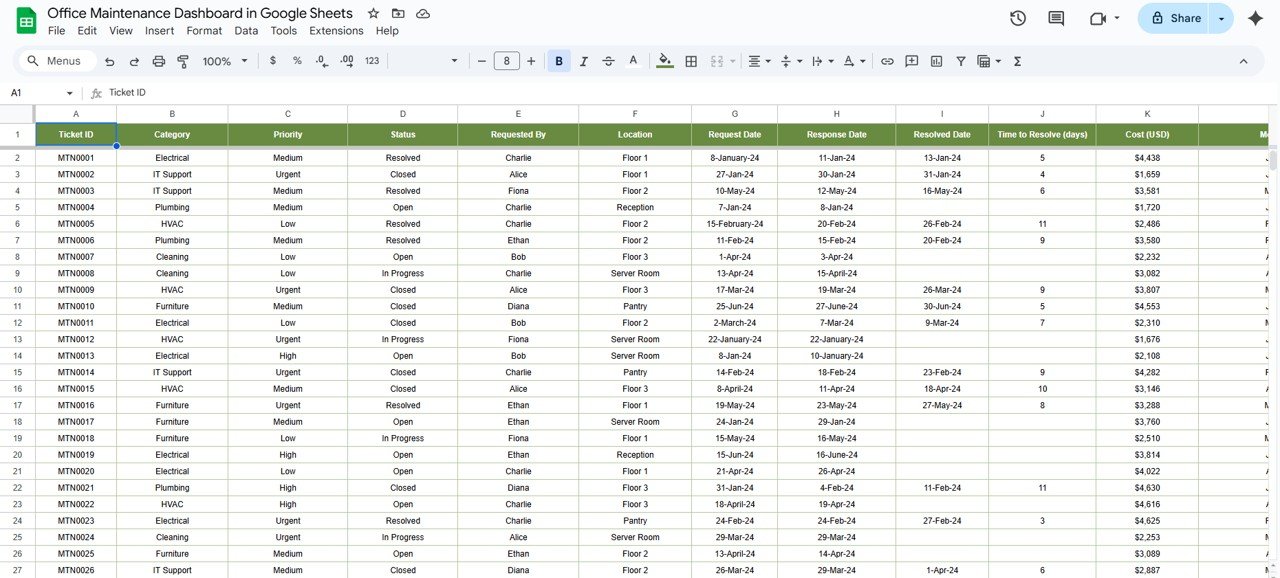
3. Data Sheet Tab
The Data Sheet serves as the backend for all inputs.
Key Features:
-
Store detailed maintenance request data.
-
Fields include Ticket ID, Category, Priority, Status, Requested By, Location, Request Date, Response Date, Resolved Date, Time to Resolve (days), Cost (USD), Month, and Year.
-
Updates in this sheet automatically reflect on the Dashboard and Search tabs, ensuring real-time analytics.
Click to Buy Office Maintenance Dashboard in Google Sheets
This structure ensures centralized data management and prevents duplication or inconsistencies.
Benefits of Using the Office Maintenance Dashboard
-
Real-Time Insights: Track costs, resolution times, and pending requests instantly.
-
Prioritize Effectively: Identify urgent requests and allocate resources efficiently.
-
Cost Control: Monitor maintenance expenses and identify high-cost areas.
-
Performance Tracking: Compare resolution times across locations, categories, and staff.
-
Streamlined Management: Reduce manual tracking and simplify reporting to management.
Opportunities for Improvement
Click to Buy Office Maintenance Dashboard in Google Sheets
-
Automate Alerts: Set Google Sheets notifications for overdue or urgent requests.
-
Add Conditional Formatting: Highlight high-priority tickets or requests exceeding expected resolution times.
-
Monthly Summary Reports: Create pivot tables for recurring monthly reviews.
-
Integrate with Forms: Use Google Forms for employees to submit requests directly into the dashboard.
-
Visual Enhancements: Add heatmaps for cost or time-to-resolve metrics across floors or departments.
Best Practices
-
Update Data Regularly: Ensure all maintenance requests are logged promptly.
-
Maintain Accurate Costs: Record actual costs for transparency and reporting.
-
Prioritize Requests: Urgent and high-priority requests should be addressed first.
-
Use Dashboard Cards: Monitor key metrics daily for quick decision-making.
-
Review Trends Monthly: Analyze trends in costs, request types, and resolution times for process improvement.
Conclusion
Click to Buy Office Maintenance Dashboard in Google Sheets
The Office Maintenance Dashboard in Google Sheets is a powerful, flexible, and user-friendly solution for managing office maintenance tasks. With real-time tracking, detailed analytics, and clear visualizations, facilities managers and office administrators can:
-
Reduce downtime
-
Optimize maintenance spending
-
Improve resolution efficiency
-
Ensure accountability for staff
Whether you are managing a single office or multiple locations, this dashboard provides a complete overview of all maintenance activities in one place.
Visit our YouTube channel to learn step-by-step video tutorials
Youtube.com/@NeotechNavigators
Click to Buy Office Maintenance Dashboard in Google Sheets